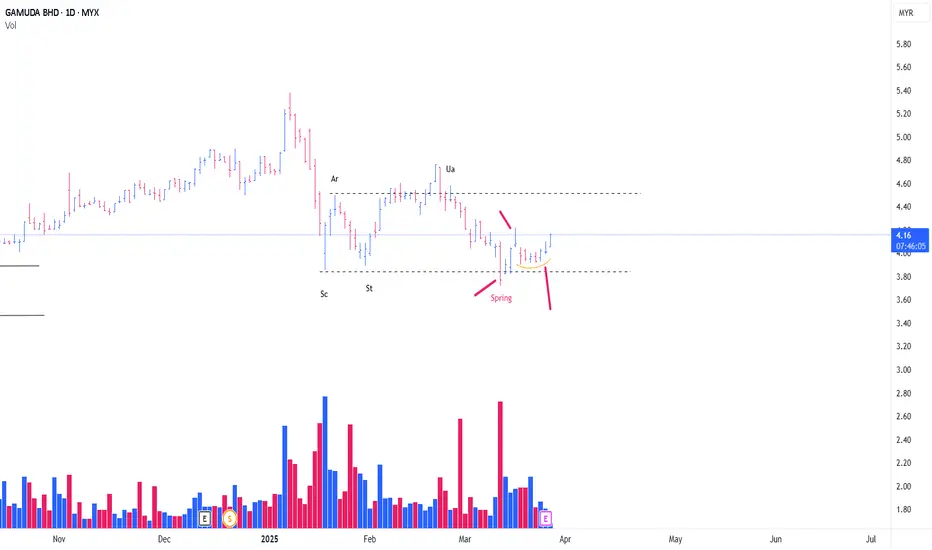
GAMUDA MARK UP CAMPAIGN
So, a rare schematic of wyckoff spotted. Finally.
A Type #1 Schematic of Accmulation
I have been started my position as attached, along with my clients (Red Line)
Technically :
1/ The Spring is very nice, Textbook Classic as mentioned by David Weiss
2/ The Feather's weight along with SpringBoard (Yellow LIne) prompted us to add position
With the QR, released yesterday showing an increase profit margin + revenue + earning.
PureWyckoff
Wyckoffmethod
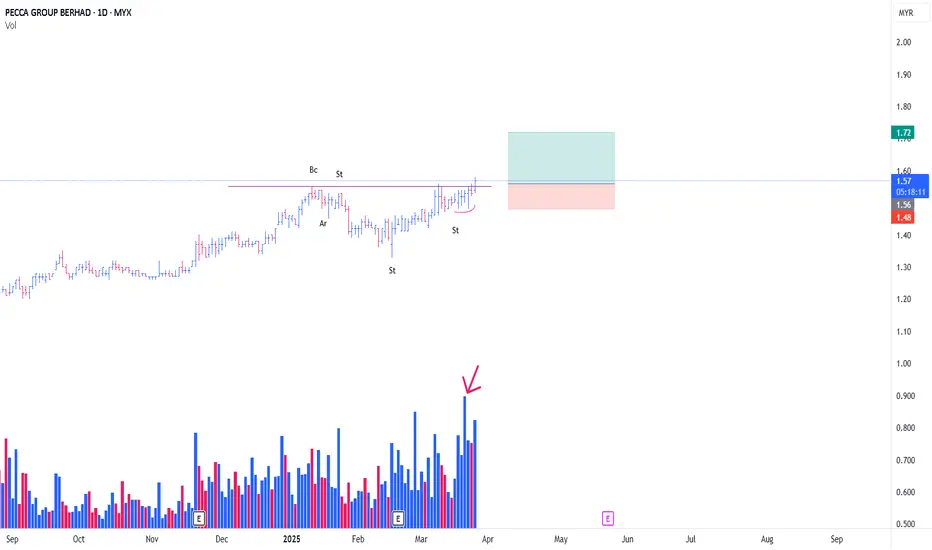
PECCA MARKING UPPecca, an Atypical Type of Schematic #2 Wyckoff Re-Accmulation
Why Pecca?
technically =
1. Feather's Weight (red crescent)
2. Absoprtion (Red arrow)
3. fulfilling Wyckoff 9 Buying point
TriggerBar today, as a test, for a follow through in the upcoming days.
Position initiated as attached
PureWyckoff
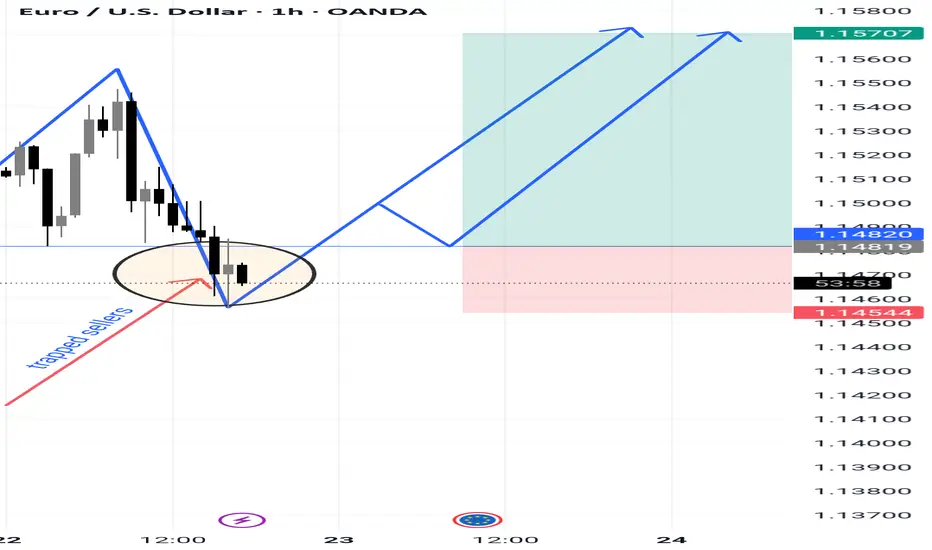
EU long play 1. Eur group shows strength, USD is generally weak
2. An established support has been broken, showing that there are trapped sellers.
3. wait for price to close at the support or even better yet retest it for a potential 3r setup
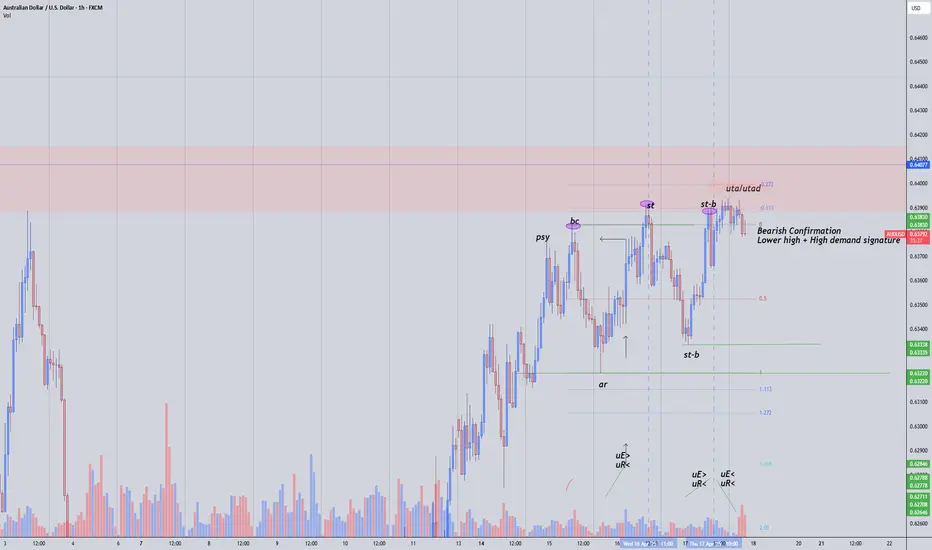
LTF DistributionContinuation of previous post :
1H Range starts off this schematic by stopping the momentum at the point of the first secondary test, it fails to break the previous high and this markets goes from moving up to sideways into this TR. Each rally to previous highs reflects upside effort increasing, but upside result is decreasing indicating buyers weakness near this level. uE>, uR< = bearish indicator.
Favorable bearish confirmation would be a lower high, paired with high buy volume confirming the shift to bearish market.
WILL ECOMATE MARK UP?This is Schematic #2 Rising Bottom of Re -Accumalation
I am attracted to the TriggerBar on 11/3/25, which succesfully commit above the upper trading range
In which subsequently reacted with a very low supply (Arrow)
Made a decision for EP
Going to expose progressively, if things improving from here on wards
Bursa KLCI has been under massive selling
Im expecting a volatility in upcoming weeks
PureWcykoff

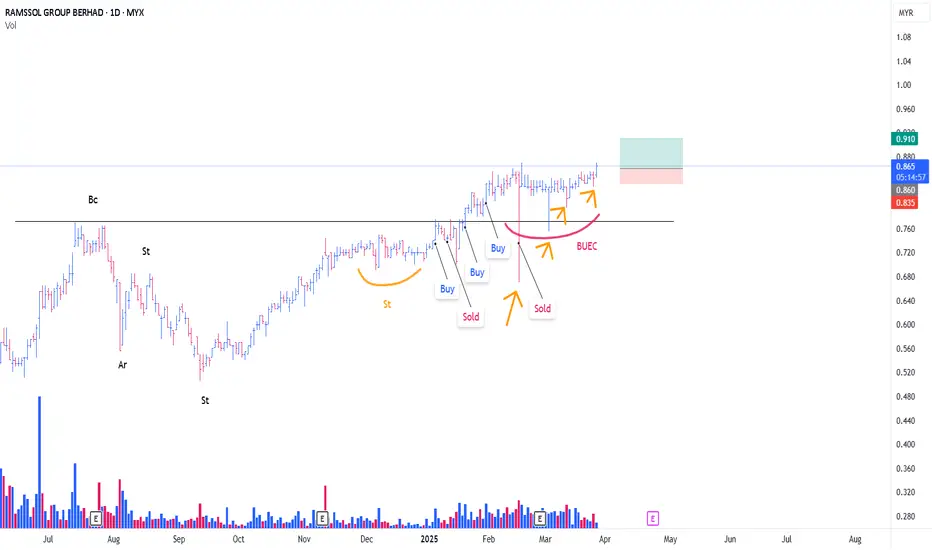
RAMSSOL CONTINUE MARKING UPI have been following ramssol since my last position
For ramssol, this is an Atypical Type #2 Re-Accumulation Schematic
The Rising Bottom
Based on the chart, I bought @ 6th Jan , i assumed that ramssol was at Phase D incoming to the phase E , awaiting for markup.
However somehow price plummeted (18th Feb) and i managed to secure some profits.
Since then, what interesting to me, is that, ramssol has 4 undercut (orange arrow) and price making uptrend
-These 'undercut' can be considered as 'Stepping Stone SPRING'
from the volume side, supply successfuly absorbed with succesful test of the 'Spring'
Position initiated as attached
Pure Wyckoff
Tight SL
$SUPER Wyckoff Accumulation – Schematic #1 or #2 in PlayBSE:SUPER Wyckoff Accumulation – Schematic #1 or #2
My base case at the moment is Wyckoff Accumulation Schematic #2 , where the Secondary Test ( ST-B ) could mark the very bottom. This idea will be validated for me especially if we see interaction with the High Time Frame VAL .
Green Zone:
We have confluence with VAL and Green TRP Zone from HTF ReAccumulation idea.
High Time Frame Wyckoff ReAccumulation Idea:

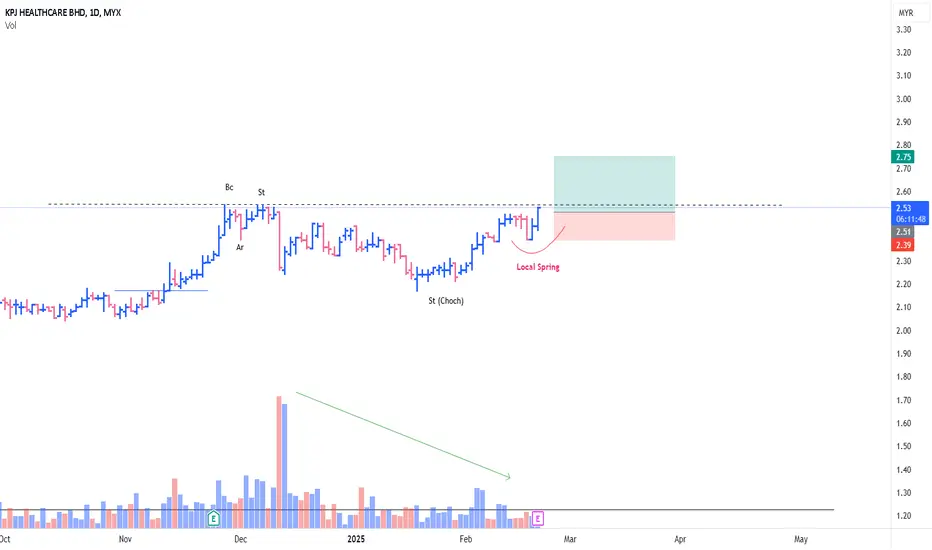
KPJ MARKING UPThis is just a continuation from my previous KPJ thesis
**(Link attached below)
Looks like current price action is on going Buec to me
Thus, Ep initiated around 2.56-2.58

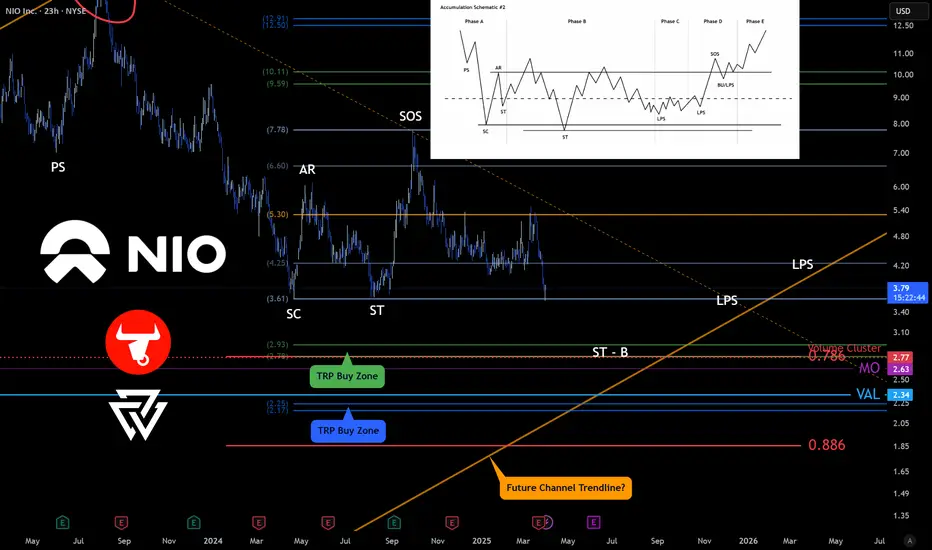
$NIO Wyckoff Accumulation – Schematic #1 or #2 in PlayMy base case at the moment is Wyckoff Accumulation Schematic #2 , where the Secondary Test ( ST-B ) could mark the very bottom. This idea will be validated for me especially if we see interaction with the High Time Frame Channel projection.
Green Zone:
We have multiple levels of confluence around this zone:
0.786 Fibonacci Retracement from the 2020 low to the 2021 top
MO – Monthly Open level
Volume cluster from previous local consolidation
Blue Zone:
If price drops as low as VAL, I expect it to be just a quick, volatile wick breaching into the Blue Zone.
High Time Frame Channel projection:
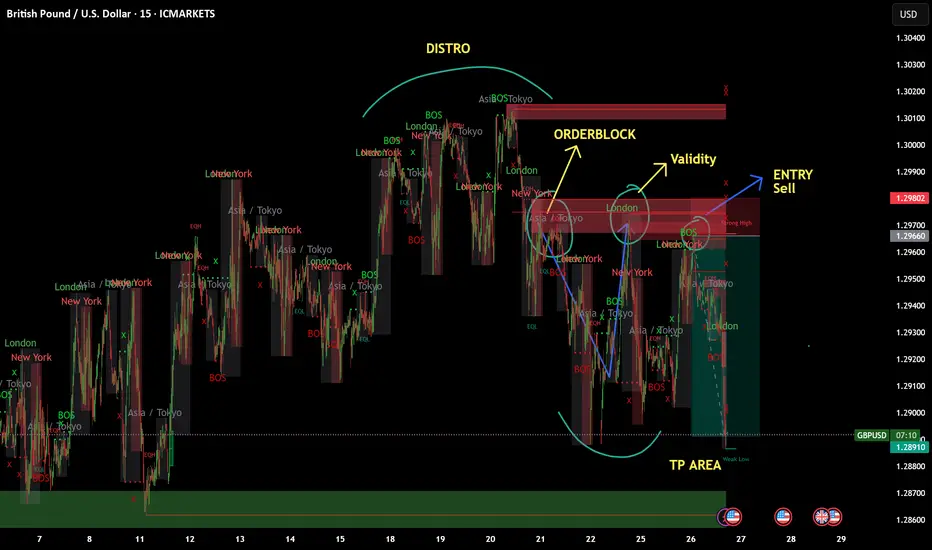
GBPUSD Sell Trade March 26 2025- Sell Limit ActivatedHello Traders!
Another great movement of GBPUSD, 1H and 15min TF confluence.
Entry: 5min TF with validity of OB (check charts for detailed annotation)
Note: This trade was a sell limit order in MT4 aiming for 1:5RR. You can see also Distribution Schematics in Higher Timeframe.
#wyckoff
#proptrader
#Riskmanagement
BTC | 90K or 40KBTC is seemingly in the early days of a brand new bearish cycle.
This is somewhat surprising, since ETH did not make a new ATH - which has happened every single time in the past rallies.
The bounce zones I will be watching for the coming bearish cycle:

$TRAC @trac_btc #Ordinals — Beginning of a Wyckoff AccumulationPOLONIEX:TRACUSDT @trac_btc #Ordinals 👀
— Possibly the beginning of a Wyckoff Accumulation Range—Schematic #1 or #2 are my base case for now.
If the local range POC holds as the LPS (Last Point of Support), then Schematic #2 is in play. If it’s lost, the probability shifts toward a new low and a SPRING.

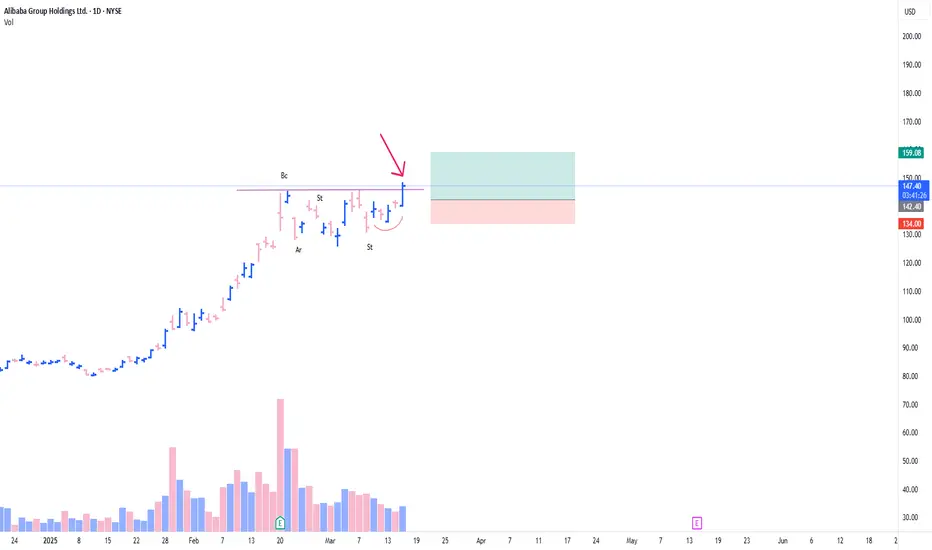
BABA TO CONTINUE MARKING UPTypical Re-Accumation of Schematic #2
As volume depleted,
1/ Feather's weight with SpringBoard in action (Red Line)
2/ Trigger Bar ** red arrow today with huge vol influx
in the background of Uptrend, position initiated as attached
Pure Wyckoff
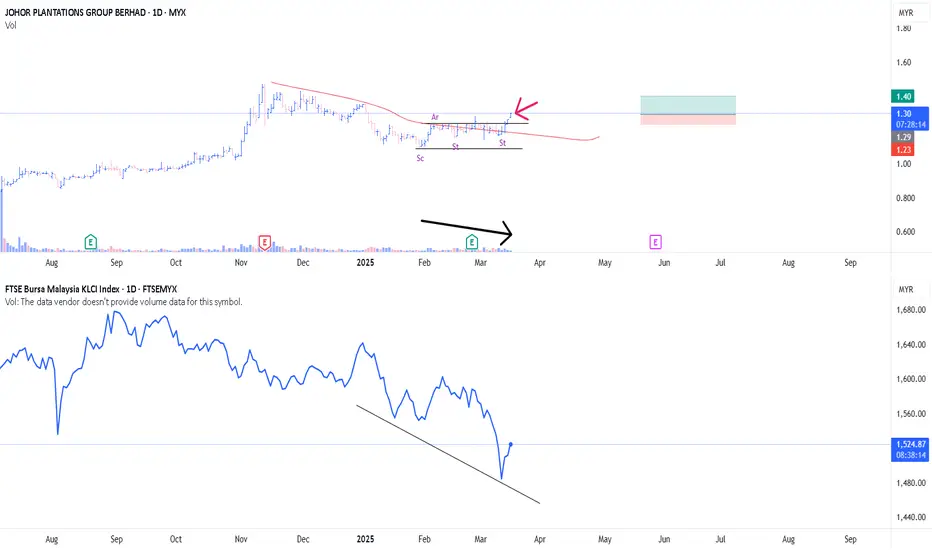
JPG MARK UP CAMPAIGNFor JGP, This is a Typical Rising Bottom (Schematic #2 of Accumulation)
Few reasons, should be pointed out :
1/ Based on Comparative Analysis , JPG somehow shows interest from the CO (JPG did HH HL, While General Market did HL LL)
-- This is a sweet spot
2/ Supply Evaporating (black arrow)
3/ JPG so far fulfilling the Wyckoff 9 Buying Criteria
4/ TriggerBar (red arrow) shows relatively higher average intraday vol influx
**Red line = Creek
EP n SL as attached
pure wyckoff
$BANANA @BananaGunBot ─ Possibly beginning of Accumulation Range🍌 $BANANA @BananaGunBot 🍌
Could this possibly be the beginning of an Accumulation Range?
As usual, my base case is Wyckoff Accumulation Schematic #1.
Time and more data will tell—adding $BANANA to the watchlist.
Clues to Support an Idea:
1️⃣ Prolonged downtrend
2️⃣ Preliminary Support (PS) – Surge in selling volume followed by above-average buying volume
3️⃣ Selling Climax (SC) – Huge increase in selling volume
4️⃣ Automatic Rally (AR) – Short-lived spike in buying volume

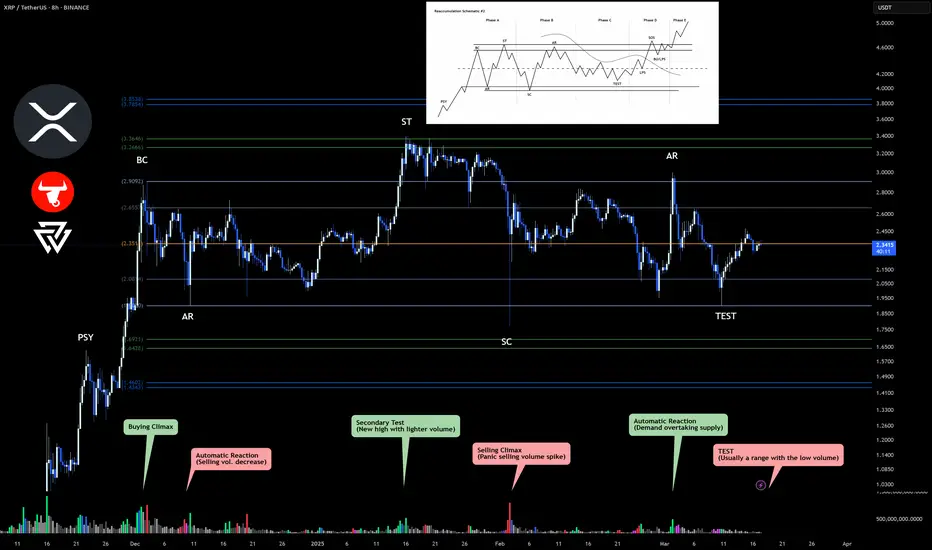
$XRP #XRPArmy @Ripple ─ Wyckoff Re-Accumulation Schematic #2CRYPTOCAP:XRP My preferred🔺bullish scenario is Wyckoff Re-Accumulation Schematic #2 🔺
Also the volume pattern is looking spot on. 👀
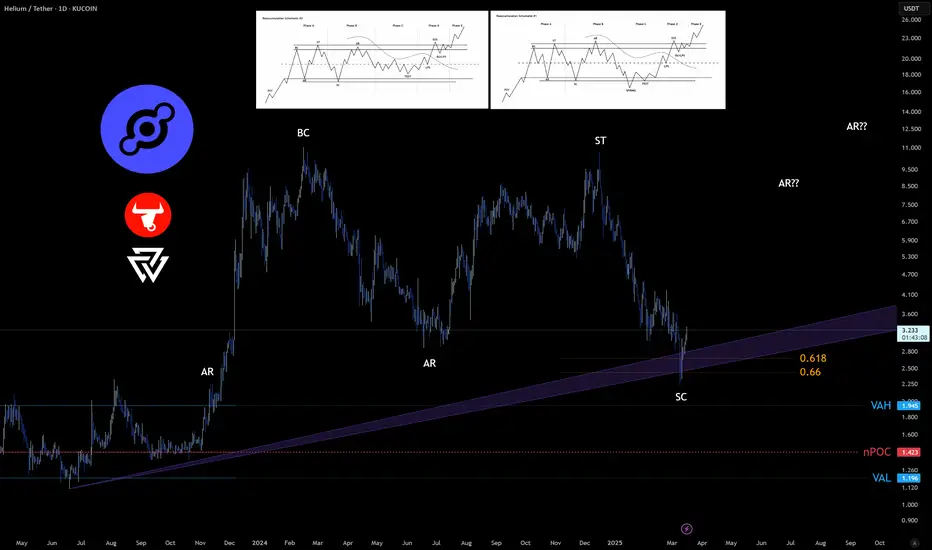
$HNT @helium ─ Future Outlook Wyckoff Re-AccumulationFWB:HNT @helium @HeliumFndn ─ Future Outlook 👁️
Wyckoff Re-Accumulation Schematic #1 & #2 scenarios.
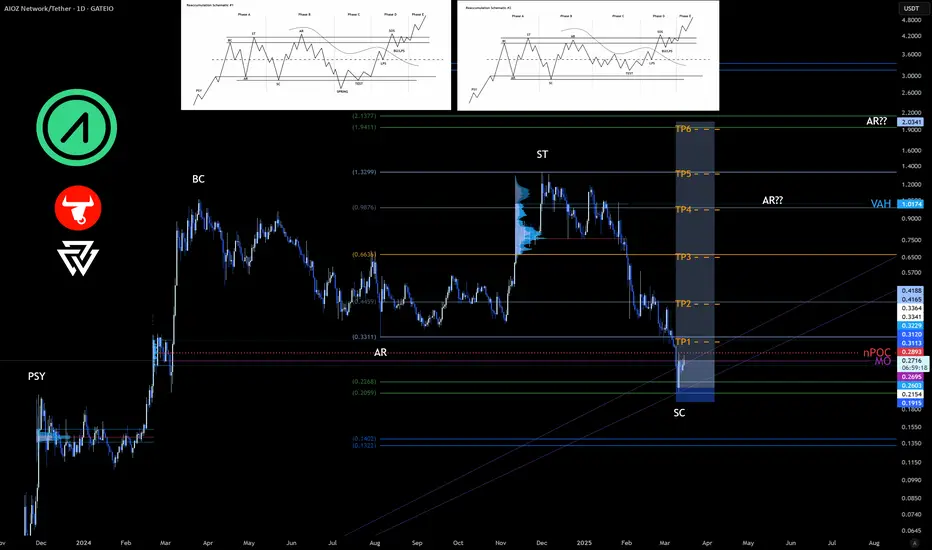
$AIOZ @AIOZNetwork Future Outlook - with Wider Range$AIOZ @AIOZNetwork ─ Wyckoff Re-Accumulation Schematic #1 or #2 scenarios.
Wider Trading Range: Range defined by Pivots from AR ─ ST
------------
------------
Note:
A long trade is the most bullish scenario possible.
As always, my play is:
✅ 50% out at TP1
✅ Move SL to entry
✅ Pre-set the rest of the position across remaining TPs
It's important to take profits along the way and not let a winning trade turn into a losing one.
Will it move in a BEARISH direction? GBPUSDI am checking GBPUSD schematics, waiting for bearish confirmation in this wyckoff schematics. Full of Liquidity Manipulations since last week march 3-7 2025. Patience is key as it develops.
-Once it confirms the direction I will join Bearish Traders here. 😁😁
Rundown of TF:
Daily---> 4H---> 1H---> 15min----> 5 min.
#proptrader
#discipline
#growthoriented
#consistency

KPJ MARKING UPAn Atypical Re-Accmlation Schematic #2 (Rising Bottom)
With Supply evaporating (Green Arrow)
In the Background of Local Spring,
All these, with my assumption that, the St (phase B),
acting as a Change of Character (Choch)
entry n Stop loss as attached
Pure Wyckoff
Strength on PCAR stock Paccar Inc. stock looks strong. We can see that since October 2024, the largest volume occurred after publishing earnings reports or on ex-dividend dates. Please note that:
- All bars on those days are down with the closing price in the middle of the bar which in Volume Spread Analysis (VSA) indicates strength.
- The volume on the October 22nd 2024 daily bar is the largest till now and the current price is above it.
- All professional activity after October 2024 is happening around the buying zone created during the October 22nd bar (blue rectangle $104.38 - $104.91).
- Recent buying (February 12th) breaks the previous low ($102.64) and recovers above that level which is a Wyckoff's Spring.
This all is very bullish. Still, the last testing showed the presence of supply.
If professionals can absorb the supply, we may expect a rally towards $116.01 - $117.83 with potential resistance in the $112.18 - $114.73 zone. Otherwise, another leg down to $100.01 for more buying is possible.

GBP/USD: Distribution Signals a Drop to 1.25GBP/USD appears to be in a distribution phase, struggling to break through resistance around 1.2620. The price has formed multiple rejection points at this level, indicating weakening bullish momentum.
The recent lower high, combined with a potential break of the ascending trendline, suggests sellers are regaining control. If price breaches the key support zone, a move towards the 1.2500 region becomes increasingly likely.
With a bearish harmonic pattern and liquidity grab indications, GBP/USD could see further downside as selling pressure intensifies.

LINK | Wyckoff Method | Phase 3 IMPULSE WAVELINK shows a very clear Wyckoff Method Cycle from the macro timeframe:
This is typically what a Wyckoff Method cycle looks like from a macro perspective:
When we look at Chainlink from the macro and compare it to the previous cycle, it seems likely that LINK goes up in "impulse waves". We now have Wave 3 to look forward to, which may likely play out over a few months - as did the previous cycle.
________________
COINBASE:LINKUSD
