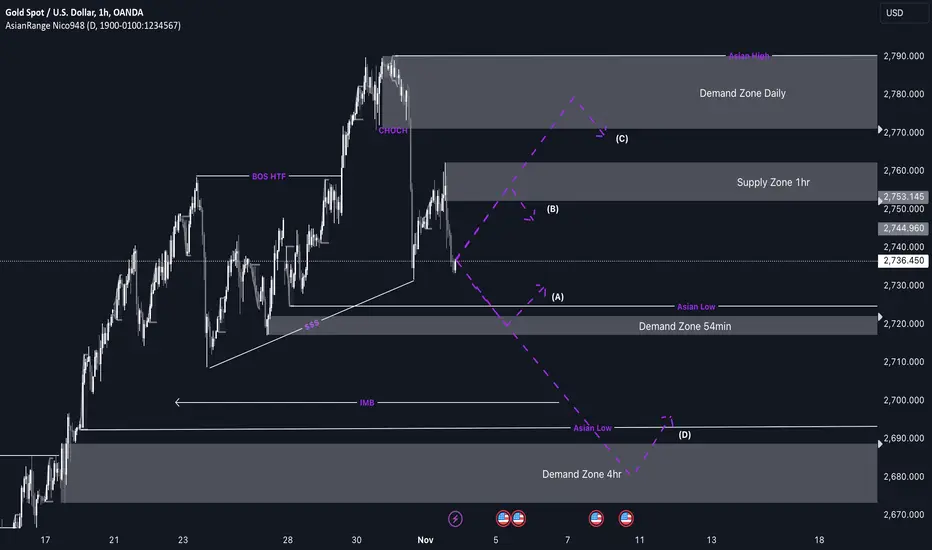
XAU/USD shorts from 2,760 or Longs from 2,720This week, my analysis suggests that gold may continue to drop, targeting the trendline liquidity formed below. Once that liquidity is taken out, I anticipate a bullish reaction, potentially around the demand zone I have identified. If the price retraces up to the supply zone, I’ll look for potential sell opportunities to follow this short-term bearish trend.
Since my overall bias is bullish, I am more inclined towards long positions due to the higher time frame outlook. However, if the price surpasses any of my nearby Points of Interest (POIs), I’ll watch for a deeper retracement around the demand at 2,680 or the supply at 2,780.
Confluences for Gold Sells:
- Price has shown a bearish shift on the higher time frame.
- Supply zones remain on both the 1-hour and daily charts.
- There is significant trendline liquidity below, providing a target for further downside movement.
- The dollar has been moving bullishly, which aligns with a potential drop in gold.
- Gold has been in a strong bullish trend and may be showing signs of exhaustion, hence the recent heavy decline.
P.S. I’ll stay vigilant and assess where the price moves first. If price breaks structure to the downside, I’ll have a stronger inclination to sell.
Have a great trading week!
Wyckoffmethod
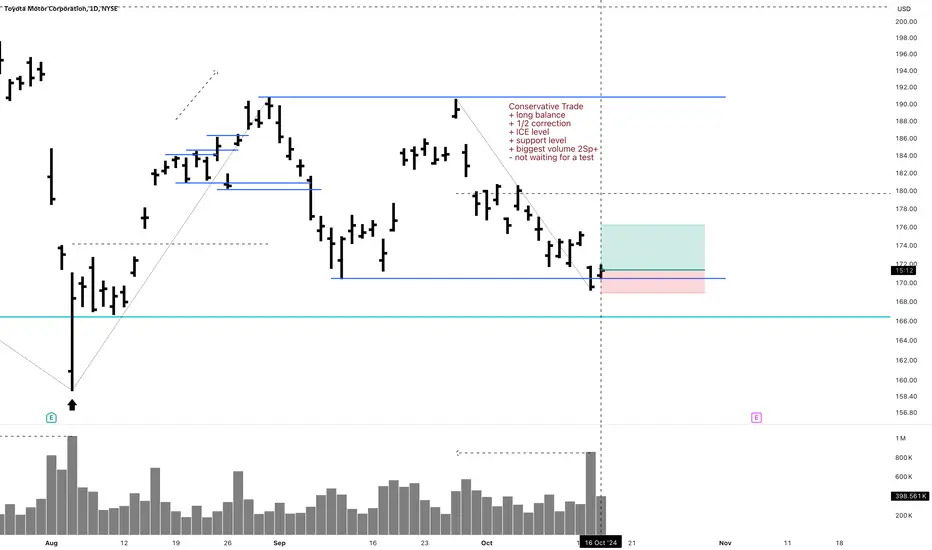
TM 1D Investment Long Conservative TradeConservative Trade
+ long balance
+ 1/2 correction
+ ICE level
+ support level
+ biggest volume 2Sp+
- not waiting for a test
Monthly Trend
"+ long impulse
+ T2 level
+ 1/2 correction
+ support level
+ biggest volume Sp
+ weak test?"
Calculated affordable stop limit at $168.93
Take profits
20% at 1 to 2 R/R
20% at 1/2 1D
20% at 1D Creek
20% at 1/2 1M
20% at 1M T1
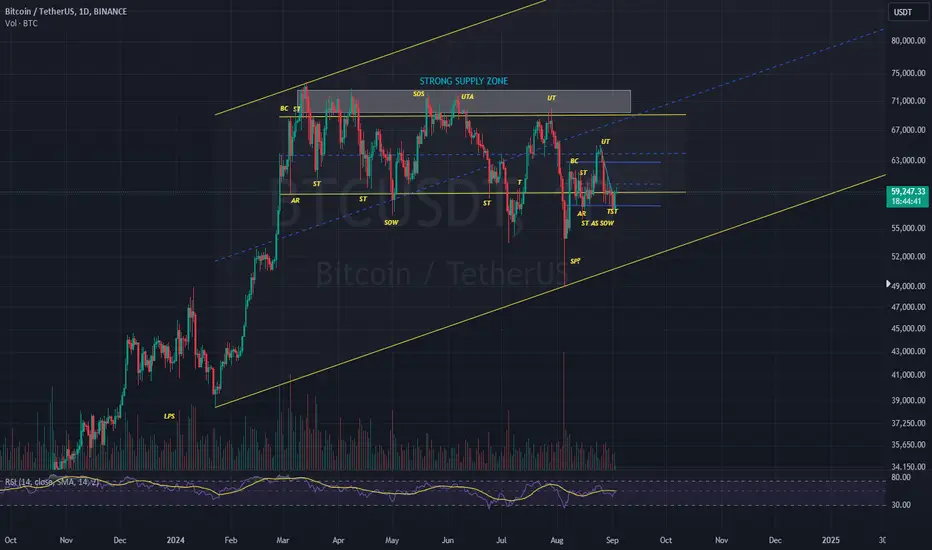
Let's be optimistic about BTC if it is closed above 59.5 KBTC testing the down side of lateral range that have formulated since March 2024. (Testing the Ice)
It will be positive if it is closed above 59500 on the daily time frame and the first target will be 62K
IN 4 HOUR Time Frame , it has broken down trend
GBPJPY Buy trade activated Oct 25 2024Another simple trade using the knowledge of supply and demand, liquidity capture, london session and new york session. This was an intraday trade -> buy limit using mt4. Always pay attention to the manipulations and Session you are trading, orderflow will always respect the higher timeframe. First analysis of this trade was from Daily structure to 1h structure.
Refinement : Using 15 min TF to find optimal entry.
RR: 6:1
#smarttrading
#supplydemand

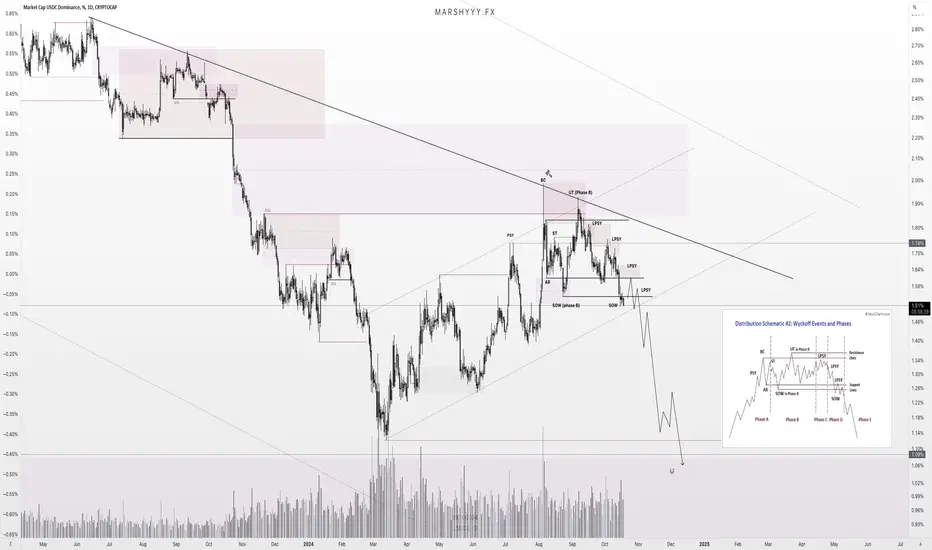
USDC.D In a Wyckoff Distribution range - Breakdown imminentUSDC.D Looking bearish as hell here in its Wyckoff distribution range. Compare it to USDT.D and see the similarities.
The difference being USDC.D is leading here and weaker, compared with USDT.D. Both still look great for the downside here and its only a matter of time before they roll over and the market runs to new highs!
USDC.D:
USDT.D:
Once this breaks down with USDT.D, we are in for the next bullish expansion in the market to new ATHs!
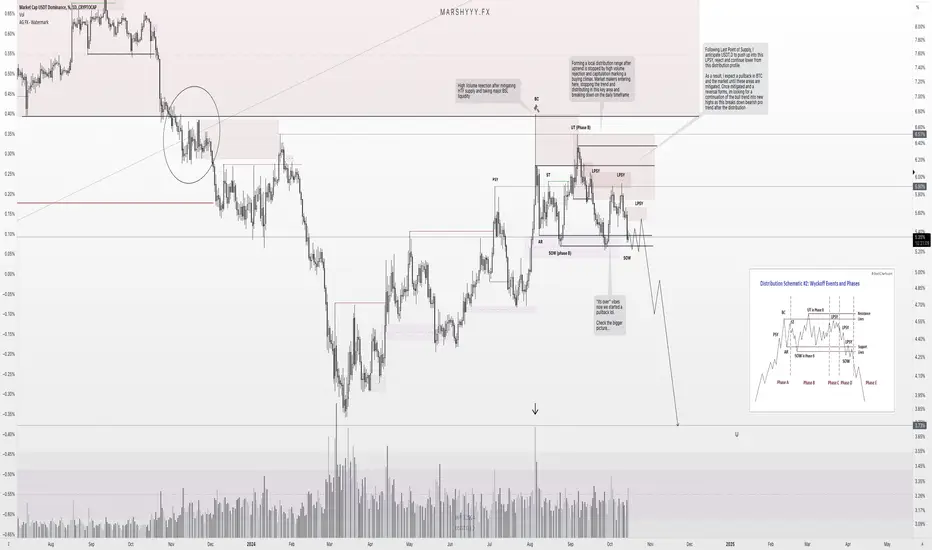
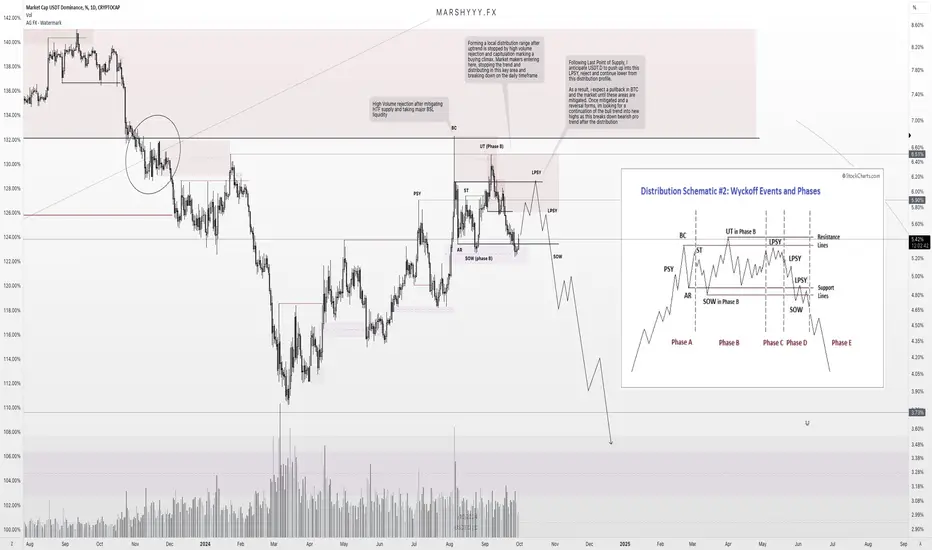
USDT.D Incoming bearish reversal and a bullish market and Q4!Im loving the look of USDT.D right now, it looks so bearish with the recent HTF closes. It looks done for and in the perfect wyckoff distribution.
Following the plan to a T, rejecting off the 5.90% level as discussed in the prior analysis where this was a key resistance level from the first PSY event. Price has refused to push to the upper limit of the range, rejecting from the last supply point and PSY in the range, formed a swing high on the daily, swept that high and is now continuing to distribute lower in line with the HTF picture.
This does look like a local top here following the last points of supply and we could be putting in local bottoms in the market.
Market could start its next run higher anytime over the next couple weeks now! Be patient, we are almost there!
Gold Wyckoff AnalysisGold's been on a stellar run with a strong campaign initiated at the start of September which broke out of a beautiful Wyckoff accumulation on the much higher time frame BUEC. Overall still very bullish for gold over the next 18-24months.
In the current price action we've had a strong push up from $2,590 where we have found a new trading range. We had a potential spring event that failed to breakout which shows some weakness in the market right now suggesting more of a distribution/selling/profit taking event.
Since this spring the range has tightened and tested both extremes of the range at the purple circles indicating no real support either way to rally further or sell of. The volatility is suggesting selling activity however we will not know until the range is completed. This smaller range can also be a test of the potential spring event
Expecting the market to show us an answer over the coming days as price continues to contract in a bearish fashion however this can still always mean 2 things, that
1. sellers are exhausted or nearing the end of taking profits and demand is strong
or
2. demand is weakening
Now looking for another potential spring event that dips below the prior one, if this shows any weakness and fails its going to be a sharp quick drop to the next high volume node at $2,580.
Trading opportunities to go long will be in the green circle in which will be a faster reversal given the location as this would also represent another higher time frame test of the consolidation breakout that happened at the start of September
or
At a successful spring event test back in the range.
or
The failure of a spring event not able to reclaim the range and going short to the next high volume node in the green circle.

TOTAL - Wyckoff Accumulation 2 Setting up!Price come into the monthly demand at the $1.8 trillion level and we have since formed range conditions after a selling climax event with a massive volume rejection on the weekly and daily wicks into the monthly demand range as shown on the chart. This was also discussed and noted on 05/08 at the height of the crash where i noted the presence of high volume being a positive thing in stopping the proceeding bearish trend alongside the fear and greed index reading 26 in fear as we come into key levels after the capitulation showing us great signs.
TOTAL Volume Analysis from 05/08:
Since then we have formed a local range after the high volume capitulation low got put in and many question whats next in this range?
For me, im seeing this as an accumulation range after the SC event just like ive detailed on BTC.
I think we have bottomed in the market, i think we are accumulating here in this local range and we are likely to form a last point of support (LPS) and HL in the range before a breakout of the highs into new highs over Q4.
Its setting up great here and im confident we dont put in new lows from here. Im expecting a little more correction in the range as shown into the LPS but overall im focused on the upside from here in line with the HTF!

TOTAL - Wyckoff Accumulation Range in Progress!Price come into the monthly demand at the $1.8 trillion level and we have since formed range conditions after a selling climax event with a massive volume rejection on the weekly and daily wicks into the monthly demand range as shown on the chart. This was also discussed and noted on 05/08 at the height of the crash where i noted the presence of high volume being a positive thing in stopping the proceeding bearish trend alongside the fear and greed index reading 26 in fear as we come into key levels after the capitulation showing us great signs.
TOTAL Volume Analysis from 05/08:
Since then we have formed a local range after the high volume capitulation low got put in and many question whats next in this range?
For me, im seeing this as an accumulation range after the SC event just like ive detailed on BTC.
I think we have bottomed in the market, i think we are accumulating here in this local range and we are likely to form a last point of support (LPS) and HL in the range before a breakout of the highs into new highs over Q4.
Its setting up great here and im confident we dont put in new lows from here. Im expecting a little more correction in the range as shown into the LPS but overall im focused on the upside from here in line with the HTF!

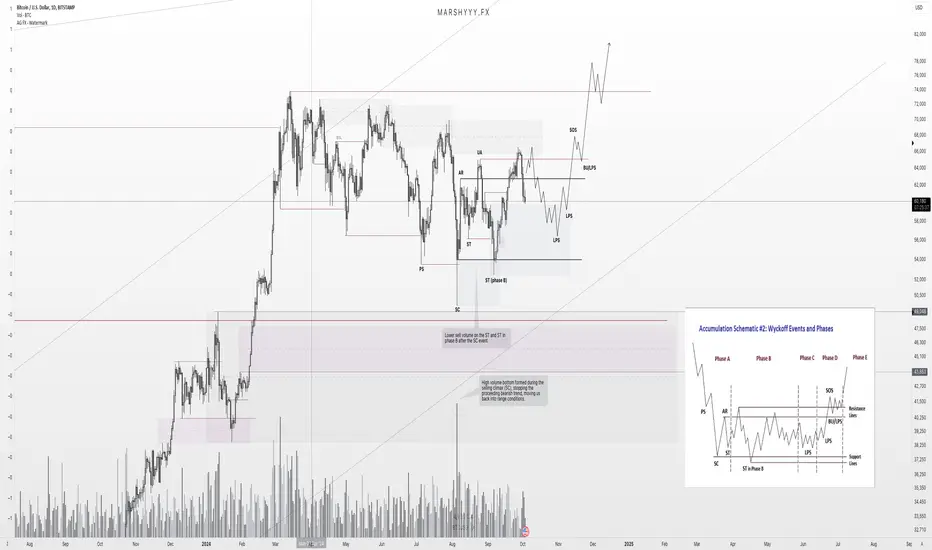
BTC Wyckoff accumulation Schematic 2 - Moving as planned!BTC Update:
So since my analysis on BTC, price has delivered beautifully and exactly as anticipated from the forecast, having took the internal highs at FWB:65K and into HTF supply from the prior weekly bearish leg and we had the bearish reaction from this area.
Price has pushed back into the daily range with a lovely bearish reaction, further fuelled by the FUD news, timed pretty much perfectly to the bearish momentum and downturn in the market as we sit in this accumulation range. However im not worried regarding the news as i see it as FUD in line with my wyckoff understanding.
In line with my USDT.D update also posted recently, im still seeing a little downside risk in BTC and im expecting it to continue bearish and push down deeper into the levels marked up between GETTEX:59K - $52K. This level is the discount of the accumulation range and the HTF weekly range and aligns with the weekly demand range, 3D demand range and daily demand range, alongside resting SSL to target at $57,500 in this area, making a prime reversal level and key level imo.
As im viewing this as a reaccumulation range, following wyckoff schematic 2 as shown, im looking at price to form a last point of support in this area and a bullish reversal to form and expand out of it as shown. This is my main idea and thesis so far as we continue to range here after the capitulation event. Now my idea could get invalidated at a later time but right now its aligning pretty perfectly alongside what im seeing on USDT.D in its distribution range and price doesn't have to take the lows again on BTC so don't be fooled into thinking it does as right now its not suggesting this and im not looking for it.
Patience is needed here as we need more price action to form to work with, but overall its looking great, i aint worried and my focus remains on the range.
As a result, i expect alts to continue to bleed and underperform, especially as BTC.D continues to push up into HTF supply and ETH is looking rather weak here with potential to take its lows again, which could end up being SMT divergence between ETH and BTC as it forms its bottom here over the coming weeks.
With Q4 just starting, im looking for the next expansion phase in the market to begin within this quarter, alongside the US elections next month which is typically a bullish event in the market! Its all aligning in my opinion for a bullish Q4 and Q1 of 2025, we just need to have patience here and not get shaken out in this range.
In addition to this China has started quantitive easing and their market has went on a massive bullish run the last week, with the US also easing up on interest rates cutting them by half a point, leaving investors able to acquire debt at a cheaper rate which typically fuels further bullish momentum in the market, as the M2 money supply increases too which i will delve into in another post.
Essentially as global money supply increases, money markets tend to also increase and ill break down this relationship in some other charts to show you just how correlated this is as its very interesting stuff.
The technicals are aligning with the macros and i think its shaping up to be a great Q4 and Q1 of 2025!
Dont be fooled by the first bearish tones to Q4, think of the monthly candle in terms of the PO3 Power of three formation, we have started the new monthly candle, forming the downside wick before the true expansion to the upside begins!
USDT.D Pulling back into Last Point of SupplyUSDT.D Update:
The markets pulling back as expected, this is as USDT.D pulls back into the range with some momentum, creating a bearish pullback in BTC and alts in conjunction with my prior BTC and USDT.D analysis
Nothing to be worried about, simply pulling back into the range forming a last point of supply in the distribution range on USDT.D and a last point of support on BTC in its range.
We still have some pain to come where i anticipate USDT.D to push higher into the areas marked up before seeing the reversal back bearish, what matters here is sticking to the plan and remaining patient.
If your not allocated in the market, this pullback will provide ample opportunity to get some exposure and risk on before the next bullish leg in the market as USDT.D breaks down out of this range. This will be one of the last chances you get to get in coins that are still priced in discounts relative to the HTF!
As price has pushed into this area im seeing an increase in volume from the latest 2 daily candles which is a good sign imo as we come into this key area and supply. However, theres no signs yet to suggest the trend on USDT.D is over and we remain bullish on the daily and 4h as we push into the range high.
As a result, im still expecting more pain in the market and red until USDT.D tops out and there is still room to the upside for it to push into as shown on the chart. I remain patient here and confident in my bias and idea still as nothing has changed at all.
There is a lot of resistance coming up on USDT.D and id be surprised to see it continue to the upside when theres a lot of levels to clear in this range as well as the prior resistance at 6.51% and the PSY at 5.90%. These areas key areas and im looking for USDT.D to reject from these areas, with high volume before breaking down from the 4h into the daily and then pro trend in line with the HTF picture as discussed here: free-analysis-channel.
Patience needed here and some confirmations from these areas over the coming week or so!
Never surprised, never worried and always composed 🫡
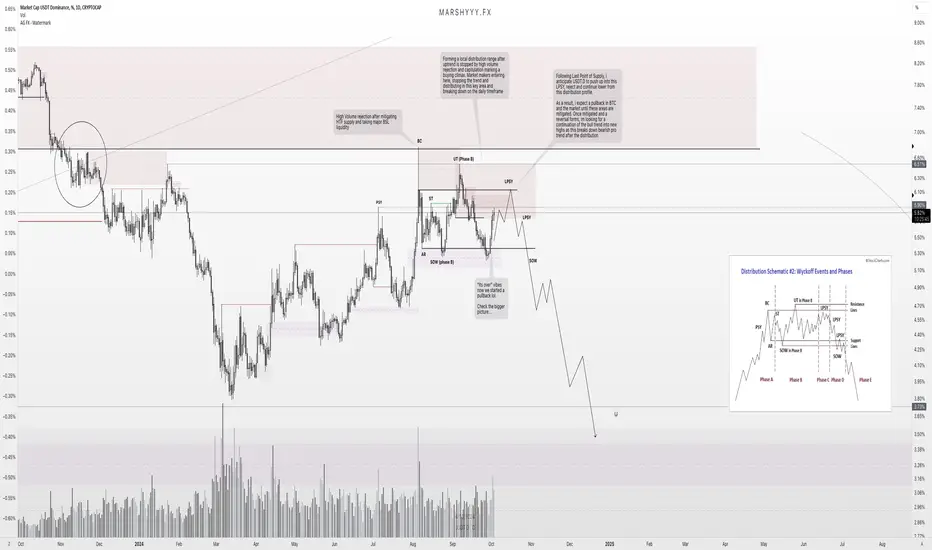
USDT.D Wyckoff Distribution Profile - Bullish Q4 Upon UsUSDT.D Distributing as BTC accumulates.... The Perfect Storm and great times ahead in Q4 are upon us!
As BTC sets up in its accumulation range near perfectly aligned to the accumulation schematic i shared prior.
USDT.D is setting up near perfectly according to the Wyckoff distribution schematic too, which is no surprise as their relationship is inverse.
A pullback is needed and forming in the market, forming phase 3 of the profile into last points of support and last points of supply.
Phase D to follow - The expansion out of the range, leading us into a beautiful Q4!
Just as BTC looks to be in an accumulation range, USDT.D looks like its forming a local distribution range as expected at these levels and as ive said plenty of times prior.
When I delve into the daily TF it becomes more apparent and easier to see, just like it is on the BTC accumulation range.
USDT.D has pushed into the FVG i was looking at and come lower into the range lows and closed bearish on the daily below the prior swing low indicating weakness.
USDT.D is naturally having a pullback now after taking SSL and filling all the FVGs in the range, and BTC and the market is also having a pullback as this trends up with it being inverse.
As im seeing this as a distribution range, i expect this to push back into the upper bound of the range into supply and form a last point of supply in a distribution profile, before continuing bearish pro trend and truly breaking to the downside throughout Q4. This is the same as my BTC analysis where im looking for a BTC pullback into a LPS before continued upside into new ATHs.
This in turn sets us up for a bullish Q4 in the market as USDT.D breaks down bearish pro trend and into the HTF targets around 3.73%, whilst BTC pushes into new ATHs alongside a bullish market.
We are not prepared enough for whats to follow 🚀
Snoflake [SNOW] Wyckoff Bullish PatternsVery fundamental company. The last consolidation after very large drops is a good prognosis for an upward exit. It is necessary to focus on Wyckoff Wave Volume, which decreases at the bottoms. This means a decrease in selling pressure. There were two shafts with a very large purchase volume and a wave marked with volume 200. It was a very large sale that did nothing to the price. This sale was absorbed by buyers.
This security has typical accumulation features. In my opinion, it is on BUY with a target of $ 140/150
For more analyses using price and volume and the Wyckoff method, subscribe to the profile

Wyckoff accumulation Schematic 2 setting up in the market:My thoughts on the crypto market looking at the HTF to the LTF setups playing out in these lows in altcoins.
Im thinking we capitulated into HTF key demand levels and SSL in August for the august monthly candle leaving a large downside range in most pairs creating the sellers climax (SC) event with huge volume nodes and wicks, starting the initial phase of the accumulation process in this local range and stopping the previous trend.
We have then ranged further and reaccumulate in the August candle in key levels creating the AR, ST and UA events in the range. Then as we moved into the September monthly candle where we failed to run the august lows with the ST event in phase b, as seller volume droped off as price tests the range lows indicating a lack of sellers after the SC event, giving us a possible wyckoff accumulation model 2 taking place as shown in the schematic below.
In turn leaving SSL intact on the august lows below $49,500 which we may not run, whilst people expect another sweep lower to take the LTF range lows, not realising its a potential accumulation range setting up in a larger overall range from the capitulation, without the need for an external LQ sweep to the lows again.
Im seeing a lot of coins following last points of support in accumulation structures on the LTF in key levels, flipping LTF bullish on the daily and now pushing higher.
Im thinking we see a possible expansion set up for October Q4 out of the lows in line with LTF bullish structure, going from LTF bullish accumulation following last points of support (LPS) into new HTF bullish structure as we come into Q4.
Thats kinda how im seeing the market set up right now and im leaning towards not seeing a further crash lower into new lows and the prior August lows for the most part just yet and more so towards this being an accumulation range with a pullback to LPS before a new bullish move higher into ATHs

DXY (Dollar) Sells from 101.700For the DXY, my outlook is that the price will retrace back up to 101.700 before continuing its bearish trend with another drop. Since that point of interest (POI) is still far from the current price, I’ll be looking for a potential buy setup around the 100.800 area, which aligns with a 3-hour demand zone.
If the price respects this zone, it could generate enough momentum for the pullback. We’re already seeing a strong reaction from the 9-hour demand zone I marked last week, supporting this scenario. A further decline in the dollar will serve as a confluence for bullish moves in my other pairs.
Have a great trading week, everyone!

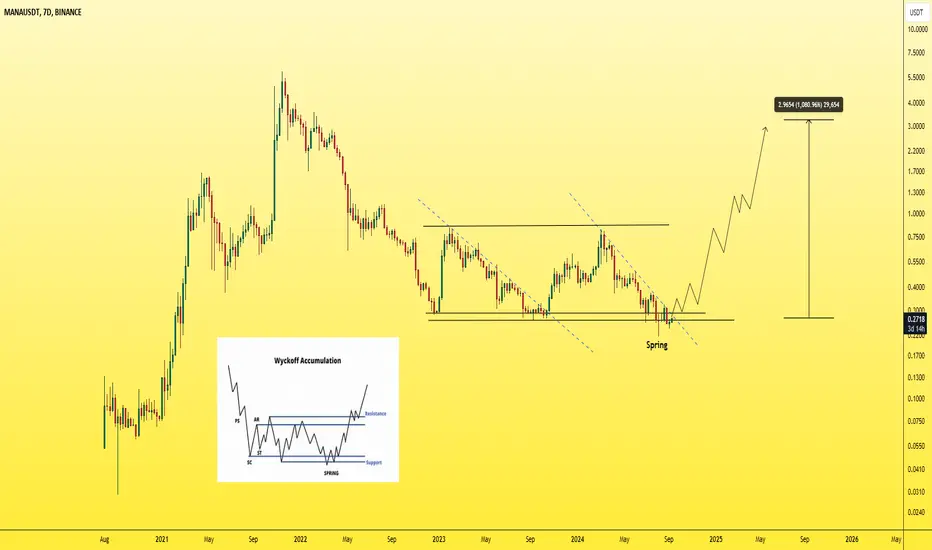
[MANAUSDT] - Keep ur eye on it!as u see ... clearly wyckoff accumulation on weekly chart
price now is at a rock bottom
i recommend it for long term investment.
best regards Ceciliones🎯
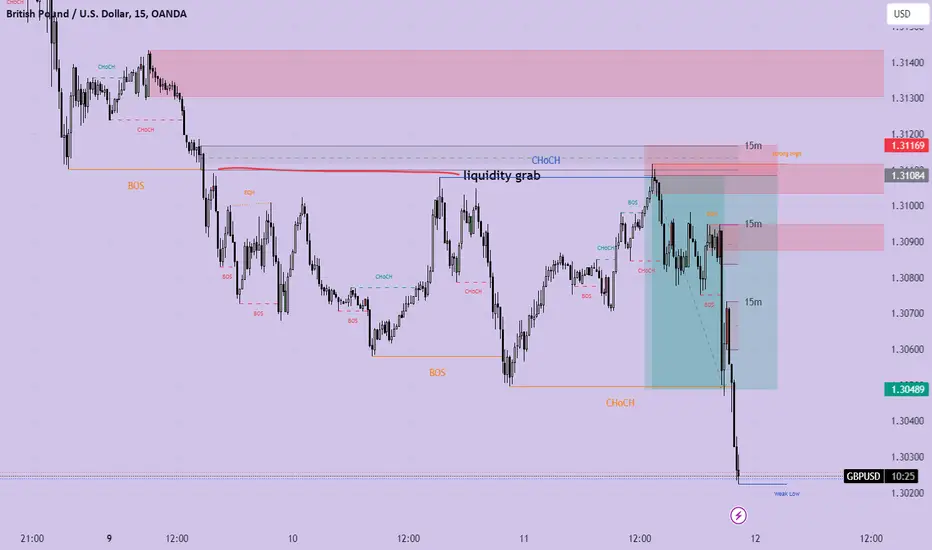
GBPUSD Sept 11 Sell Trade This trade was set in pending order at around 3-4am EST . During London Session.
I saw some continuation in bearish structure due to the fact that previous day introduced supply (we can see it in (4h- 1H Timeframe). After carefully checking the Point of Interest, I set the sell limit.
Risk to Reward Ratio: 1:7
Supply Entry with confluence in liquidity.
move that gives momentum during CPI News release 8:30am EST
#wyckoff
#patience
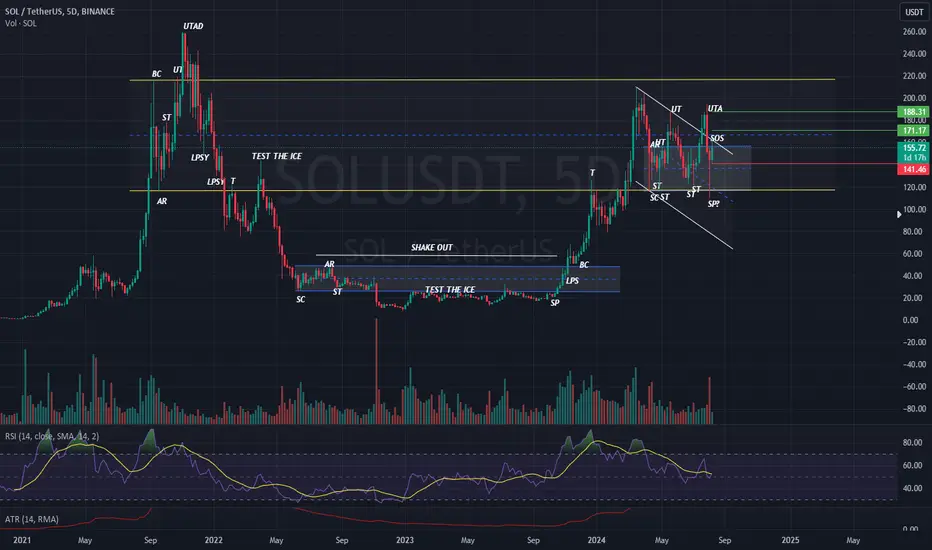
Does Solana will continue their bounce play more than 45% !!Solana has gained more than 45 % from last fall down that was in 5th August 2024
the trend right now is inside the range ( Phase C - Wyckoff Method )
The far target is 216 ( Top of the side way range) if the Re-accumulation phase has succeed.
SL is 141.46 ( this for me is consider thin stop loss due to the high BINANCE:SOLUSDT volatility of the crypto market)
I am Just sharing insights and market trends for learning and growing every day and it is not financial advice.
CCK MARKING UPClassic wyckoff Re-Accumulation of Schematic #1
With spring in the house
What attracted me the most, is that, there was an absoprtion past 2 days as evidence by the volume (Black Arrow)
With breakout today accompanied with huge vol, this is a sBar (Siginificant Bar) as mentioned by Prof Roman in his teaching. I called it Timing Bar
Thus, i went with a heavyweight position on this one
Risk is always respected
in view of that, i humbly initiated position as attached

SDS PROBABLY MARKING UPAs plotted, This looks like Typical Re-Accmulation (Rising Bottom, Schematic #2)
What interesting to me, is that the incoming supply is reducing and evaporating as evidence by vol @ 29/7/24 (Black Arrow)
-As mentioned by David weiss : Probably this is The Contraction
Thus i humbly initiated my position as attahced
Pure Wyckoff, Anything can happen

BTC 42K?Unbelievable! What Would Richard Wyckoff Do if He Saw the Bitcoin Chart Today? BINANCE:BTCUSD About to Repeat History? Is the Price About to Return to the Beginning of the Year Levels?
Levels> 44k-42k$

MBMR GOING FOR MARK UP
In the background of plummeting KLCI (Bursa Index), this stock rising above
Classic Type 1 Re-Accmulation
Price succesfully overcome the suply on 5/8/24 (red arrow)
-Wyckoffian call it 'COMPOSITE OPERATOR ROTATION'
Plus, with the 'Spring' !
I put my trust on the setup
position as attached
PureWyckoff
Anything can happen

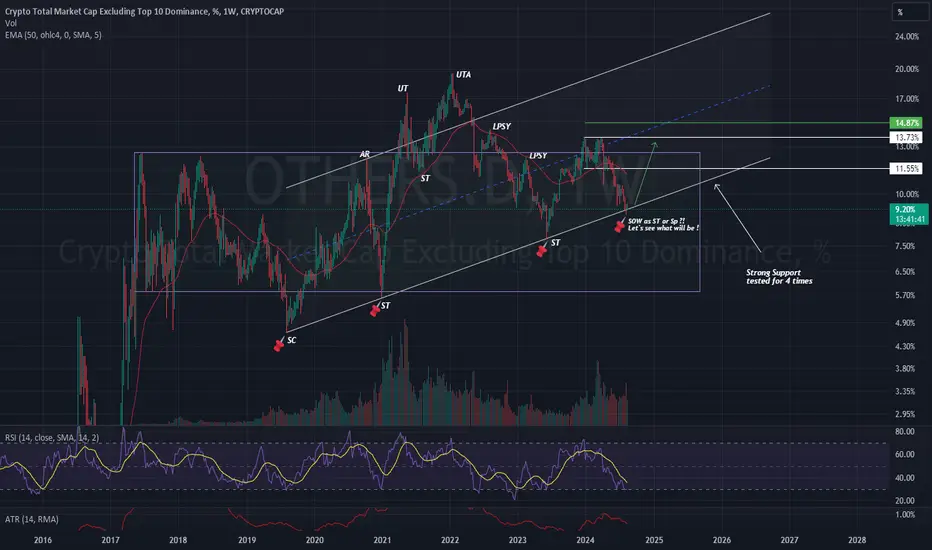
Others.D holding strong Support for the 4th timeOthers.D holding strong Support zone that have been tested for 4 times and failing to hold it will lead to 7.78% as the nearest target.