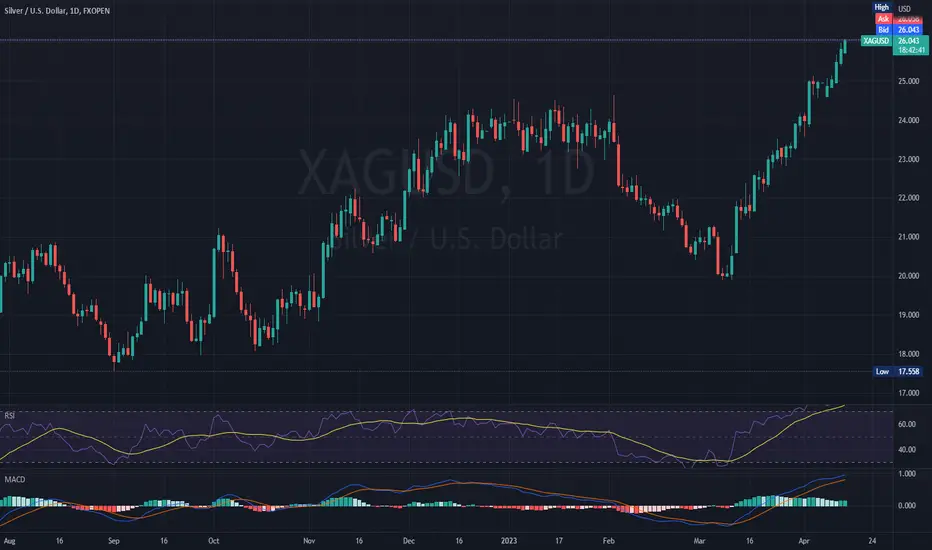
SILVER BULLISH OUTLOOKSilver is gaining momentum, similar to the other precious metal, Gold. But their purposes are different: while Gold is used as protection against inflation from investors, silver has a lot more industrial uses, especially in the green energy sector. This makes the metal a lot more sought after.
Both MACD and RSI are confirming the bullish trend, and if it continues, targets of 27.5 and even 29.1 can be expected.
On the opposite scenario, as a pivot point, 23 might be considered, and if silver surpasses that level, further down movement to levels of 21.9 can be observed.
Risk Disclosure: Trading Foreign Exchange (Forex) and Contracts of Difference (CFD's) carries a high level of risk. By registering and signing up, any client affirms their understanding of their own personal accountability for all transactions performed within their account and recognizes the risks associated with trading on such markets and on such sites. Furthermore, one understands that the company carries zero influence over transactions, markets, and trading signals, therefore, cannot be held liable nor guarantee any profits or losses
XAG
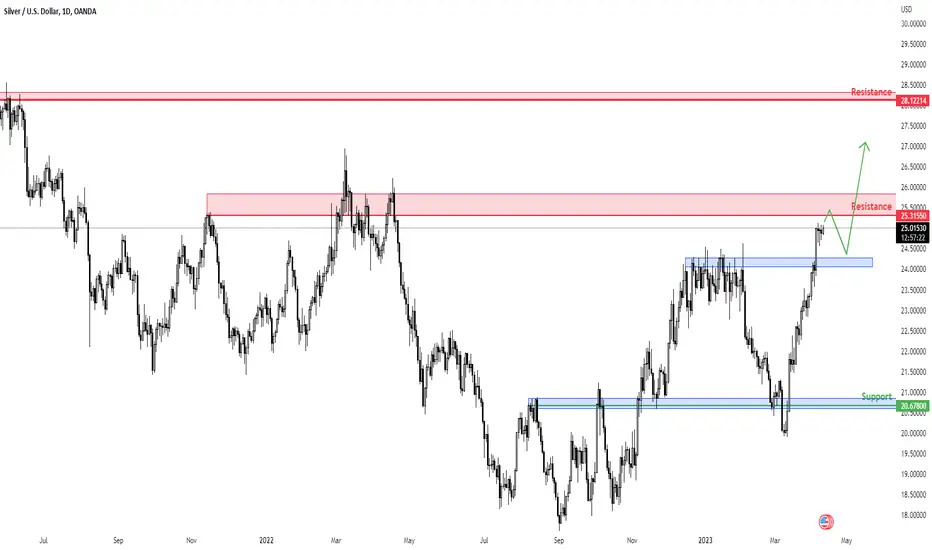
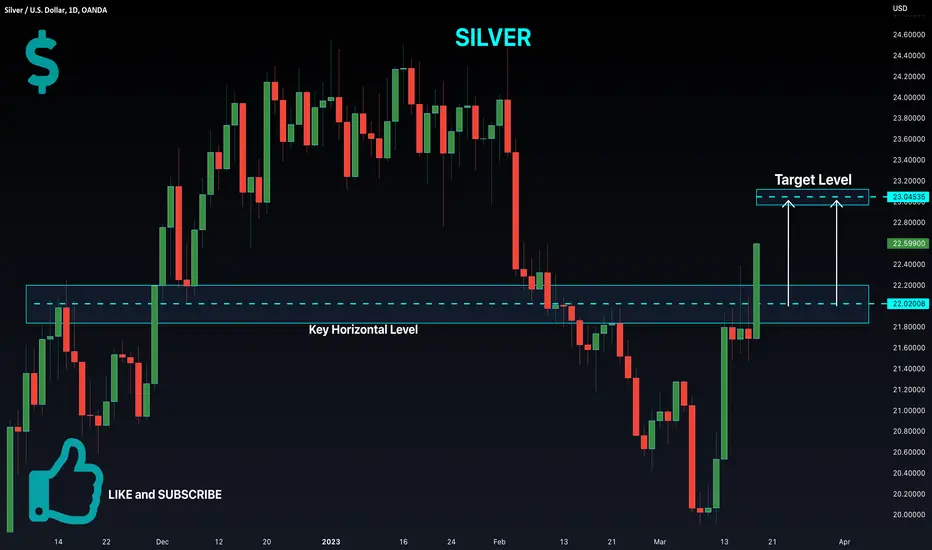
XAGUSD Daily Potential Forecast | 11th April 2023Technical Confluences
1. Silver is currently near last year's high
2. Near-term resistance at 25.31550
3. Near-term Support at 24.29100
4. High-up resistance at 28.13740
Idea
We are looking for price to continue heading towards the near-term resistance at 25.31550.
There might be some struggle to break through the resistance so we are expecting a possible pullback down towards the near-term Support at 24.29100 before continuing it's bullish momentum upwards.
NOT FINANCIAL ADVICE DISCLAIMER
The trading related ideas posted by OlympusLabs are for educational and informational purposes only and should not be considered as financial advice. Trading in financial markets involves a high degree of risk, and individuals should carefully consider their investment objectives, financial situation, and risk tolerance before making any trading decisions based on our ideas.
We are not a licensed financial advisor or professional, and the information we are providing is based on our personal experience and research. We make no guarantees or promises regarding the accuracy, completeness, or reliability of the information provided, and users should do their own research and analysis before making any trades.
Users should be aware that trading involves significant risk, and there is no guarantee of profit. Any trading strategy may result in losses, and individuals should be prepared to accept those risks.
OlympusLabs and its affiliates are not responsible for any losses or damages that may result from the use of our trading related ideas or the information provided on our platform. Users should seek the advice of a licensed financial advisor or professional if they have any doubts or concerns about their investment strategies.
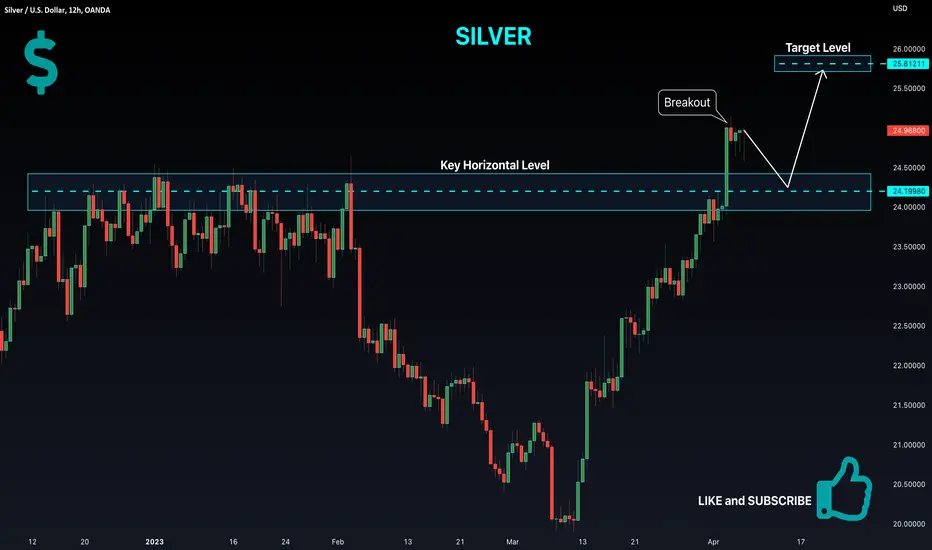
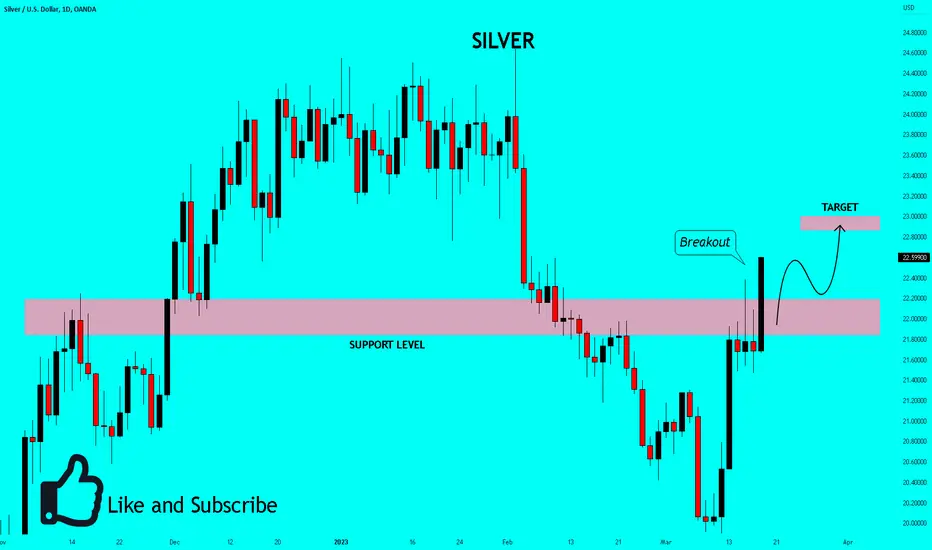
SILVER Breakout Of The Resistance! Buy!
Hello,Traders!
SILVER broke the key
Horizontal level of 24.2$
And the breakout is confirmed
So while we might see some
Pullback the bias is
Firmly bullish
Buy!
Like, comment and subscribe to help us grow!
Check out other forecasts below too!
✅SILVER BULLISH BREAKOUT|LONG🚀
✅SILVER will keep growing
Because it is in the uptrend
And recently broke the
Key level of 24.2$
So we will be expecting
Bullish continuation
LONG🚀
✅Like and subscribe to never miss a new idea!✅

!!! SILVER !!! Back to the 21.50Hi,
The trend-resistance line is working hard in the first days of the week, indicating that we will return to the price of the 50/200 MA line cross
This is just an idea
Take care

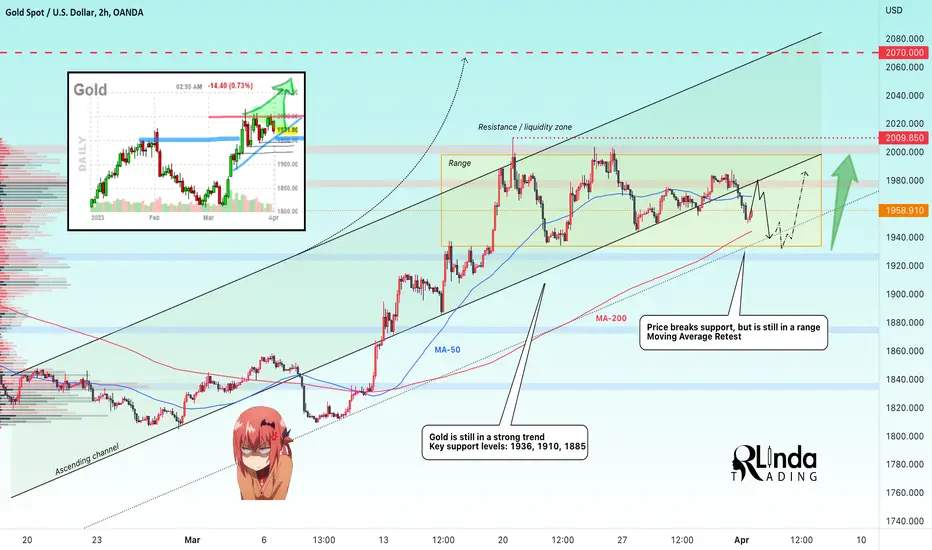
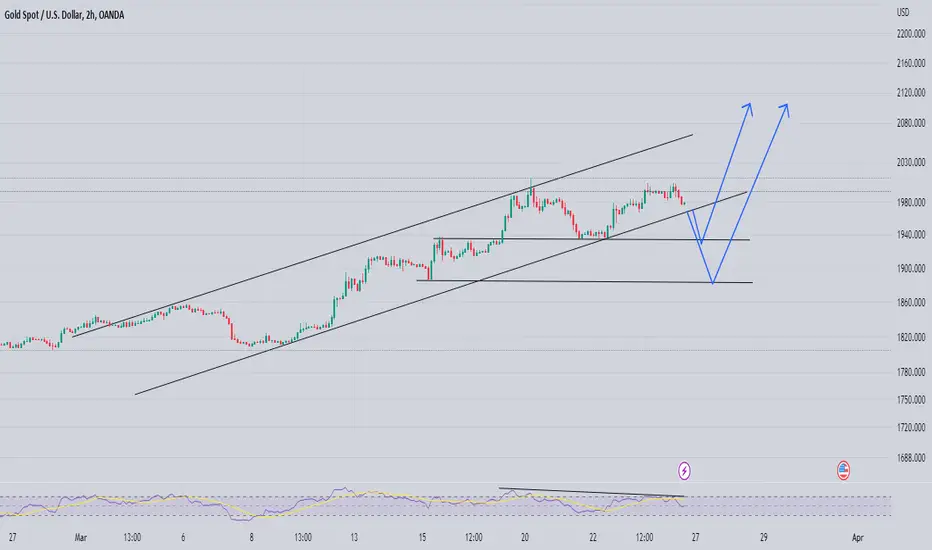
GOLD → Channel support, MA-200 and MA-50 are broken Gold breaks the support of the uptrend channel and renews the local low. The price is forming a sideways range. How might this affect the price?
When channel support is broken, price breaks the 50-hour and 200-hour moving averages on the 1-hour timeframe, descending to a low of 1950. There is a chance that the price will bounce from the SMA on the retest and go to the support of the 1935 range.
At the moment the futures are in the red zone, so it is worth to be careful about the purchases and to consider the sales as a small priority.
I expect that the price will bounce down from the local resistance levels and go towards the support of the 1935 (range support).
Regards R.Linda!
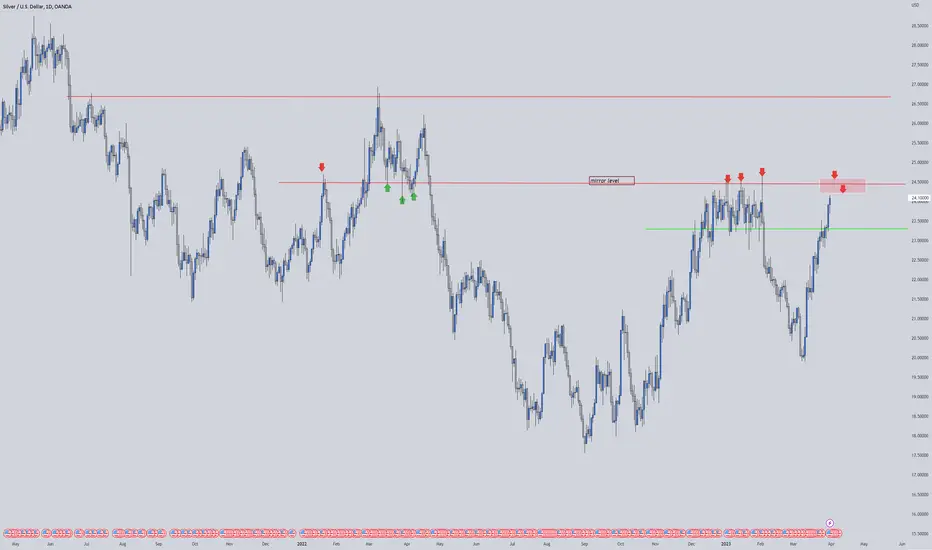
Easy MoneyStrong mirror level 24.50
Rebound or false breakout strategy.
I think it will be possible to enter and exit a couple of times
✅SILVER PREPARING FOR A SHORT🔥
✅SILVER is about to retest a key structure level at 24.4$
Which implies a high likelihood of a move down from resistance
As some market participants will be taking profit from long positions
While others will find this price level to be good for selling
So as usual we will have a chance to ride the wave of a bearish correction
Towards the demand level at 23.4$
SHORT🔥
✅Like and subscribe to never miss a new idea!✅

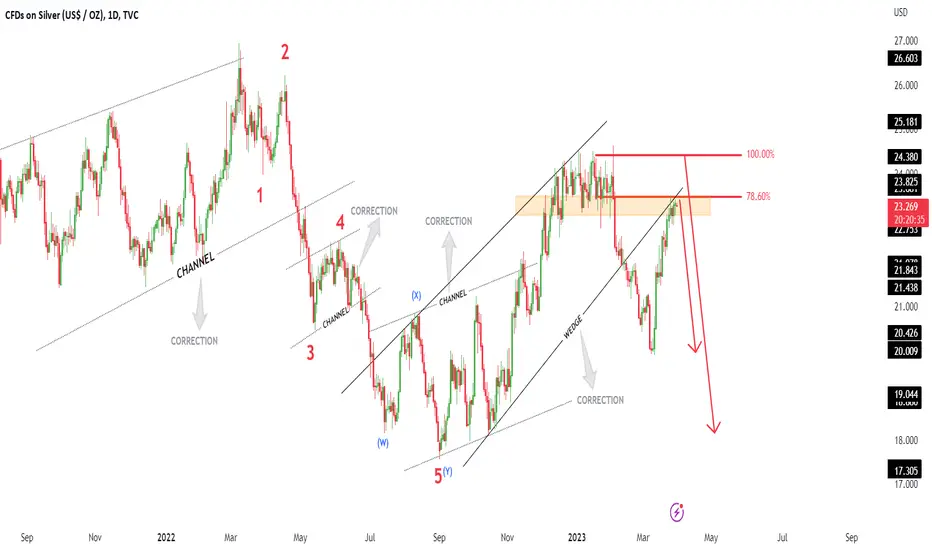
XAGUSD Next MovePair : XAGUSD ( Silver / U.S Dollar )
Description :
Rising Wedge as an Corrective Pattern in Long Time Frame and it has Breakout the Lower Trend Line and Completed the Retracement
Break of Structure
Fibonacci Level - 78.60%
Rejecting from Strong S / R Level
Divergence
Impulse Correction Impulse
Elliot Waves
Silver shows bearish signs with head and shoulders patternThe silver is forming a clear Head and Shoulders pattern with a visible divergence on momentum indicators. Additionally, it has broken the ascending weekly trendline. These are all signs that the price is likely to fall to 22.150, after which it may rebound to 22.68 and retest the breached neckline. The retest point could present a good opportunity to enter a short position, with a potential profit of at least 6200 points.
-------------------------------------------------------------------------
Let me know your thoughts in the comments, and show your support by liking the idea.
Please follow if you're interested in more ideas like this.
Your support is greatly appreciated!

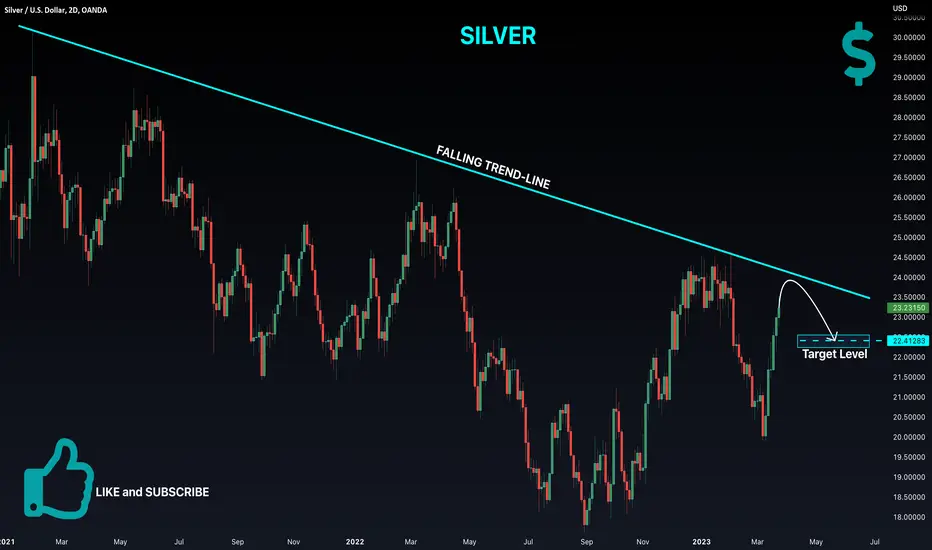
SILVER Falling Resistance Ahead! Sell!
Hello,Traders!
SILVER is trading below a
Long term falling trendline
On the higher timeframes
And after the price retests
The resistance we are likely
To see a pullback towards the
Target below at 22.41
Sell!
Like, comment and subscribe to help us grow!
Check out other forecasts below too!
XAUUSD SHOWING WEAKNESSOver Trend Is bullish but Expecting some Correction before Next Bullish impulse
Forming Ascending Channel in h4 timeframe Incase Of breakout expecting Test Of 1930 to 1935 And If Gold Lost Support Area Then Correction Will Be deeper
✅SILVER THE RESISTANCE NO ONE IS TALKING ABOUT|SHORT🔥
✅SILVER has been ultra-strong
As of late following Gold as
A safe haven metal however,
Trees don't grow to the sky
And so If we zoom out to the
One week TF we will see
A strong falling resistance
That stands in the way of growth
And from where we are very
Likely to see some correction
SHORT🔥
✅Like and Subscribe like a BRO✅
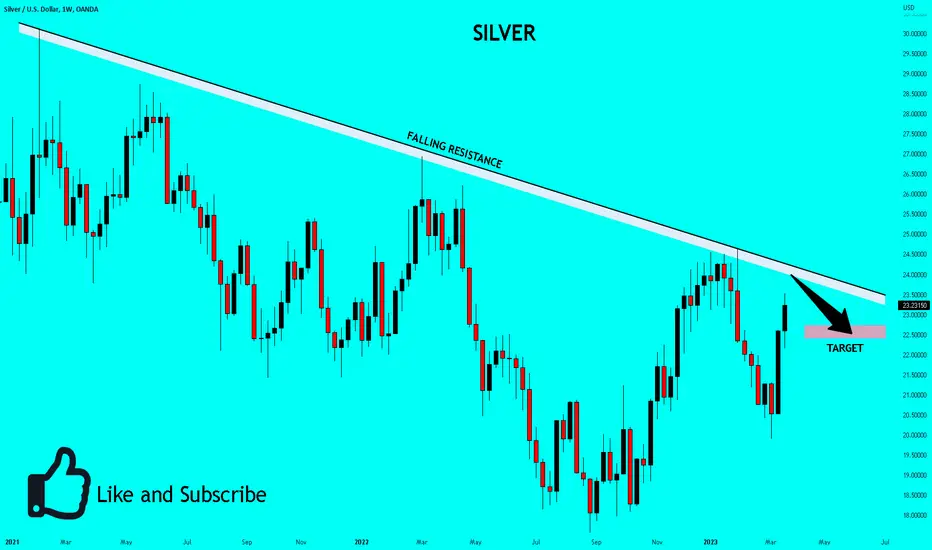
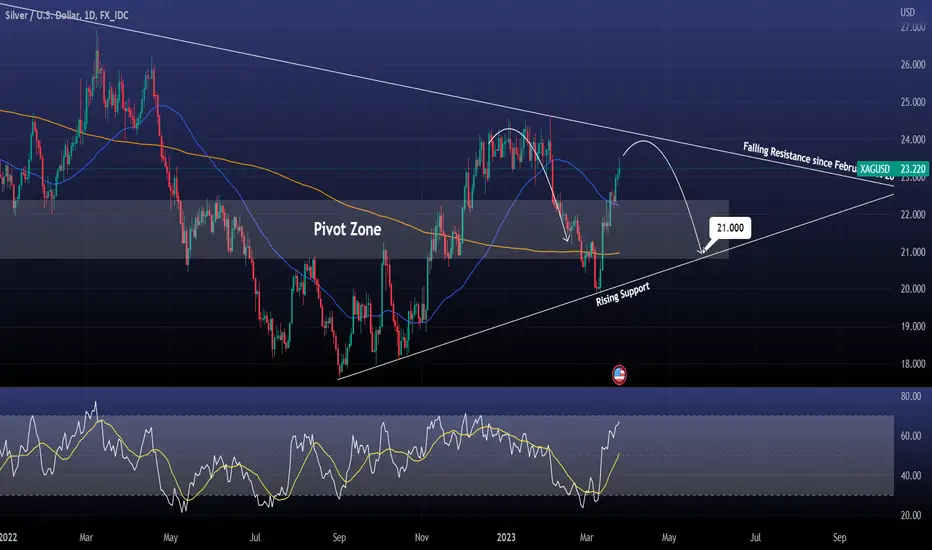
XAGUSD Sell as it approaches the 2021 Falling Resistance.XAGUSD/ Silver is on a 2 week rise after rebounding on the Rising Support.
The price is now approaching the Falling Resistance that started on February 1st 2021.
We expect a correction back to the Rising Support and bottom of the Pivot Zone.
Target 21.000.
Follow us, like the idea and leave a comment below!!
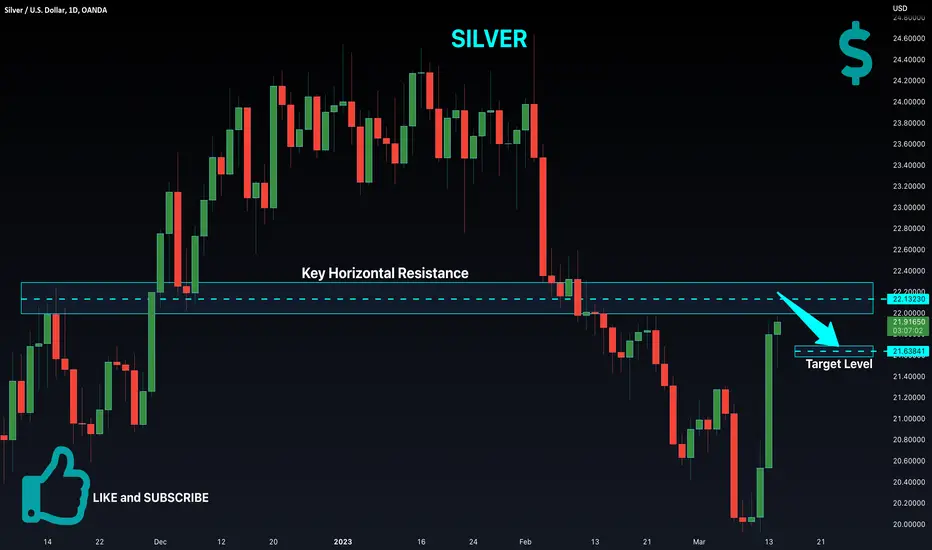
Silver: The Breakout of Head and Shoulders PatternXAGUSD has completed the formation of a head and shoulders pattern with divergence on momentum indicators, and has made an initial break of the neckline. I prefer to wait for confirmation of the breakout before entering a sell position targeting 21.19. However, with the current global crisis in American and European banks, conditions may change at any moment, so it is advisable to enter and exit with caution and strict risk management.
-------------------------------------------------------------------------
Let me know your thoughts in the comments, and show your support by liking the idea.
Please follow if you're interested in more ideas like this.
Your support is greatly appreciated!

✅SILVER STRONG BULLISH SIGNAL|LONG🚀
✅SILVER is going up currently
And the price broke the key structure level
Which is now a support, and after the pullback
And the retest, I think the price will go up
LONG🚀
✅Like and subscribe to never miss a new idea!✅
SILVER Epic Breakout! Buy!
Hello,Traders!
SILVER broke the key
Horizontal level and
The breakout is confirmed
So after some correction
The target above is
Likely to be retested
Buy!
Like, comment and subscribe to boost your trading!
See other ideas below too!
!!! SILVER !!! Here we go !Hi,
After navigating above we will have a slight correction until the green trend line
This is just an idea
Take care

Silver Turning Up For Minimum Three Waves
Silver made strong and impulsive rally since September 2022 till February 2023. A sharp drop in February from 24.50 and break below 22.50 supports suggests that metal is in a higher degree correction. That’s quite strong decline, but due to a five-wave rally earlier, we still see it as part of a complex sharp W-X-Y correction with the support here in the 61,8% - 78,6% Fibonacci retracement and 20-19 area.
We can currently see a nice bounce from the support, but due to sharp leg down previously, we are tracking a minimum three-wave A/1-B/2-C/3 recovery at least up to 22.75 area for wave C or maybe even higher and back to highs for wave 3 of a new five-wave bullish impulse.
Support on intraday dips is at 21.30 followed by 20.60

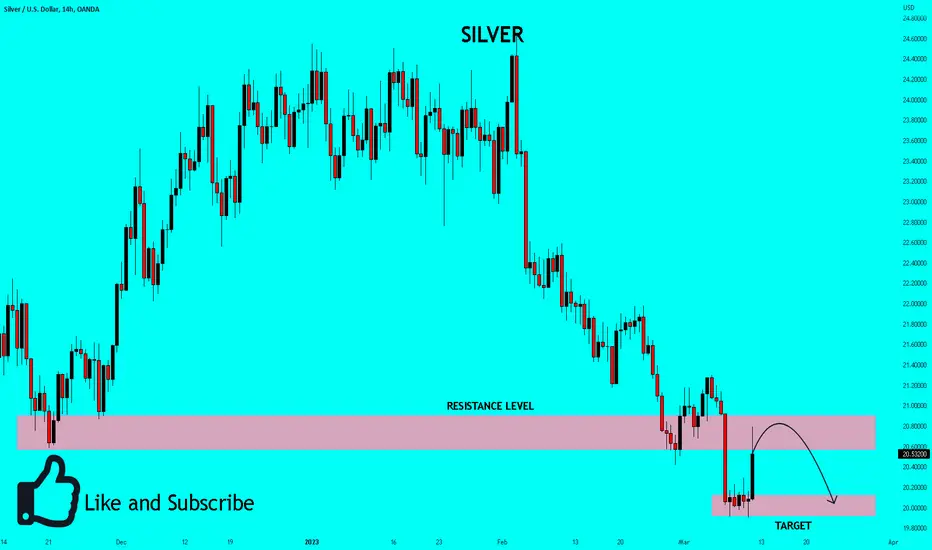
SILVER Strong Resistance Ahead! Sell!
Hello,Traders!
SILVER will hit the key
Horizontal resistance soon
So I think that while the setup
Is risky due to the fundamental
Nature of the moves
We might see a bearish
Reaction and a reteset
Of the target below
Sell!
Like, comment and subscribe to boost your trading!
See other ideas below too!
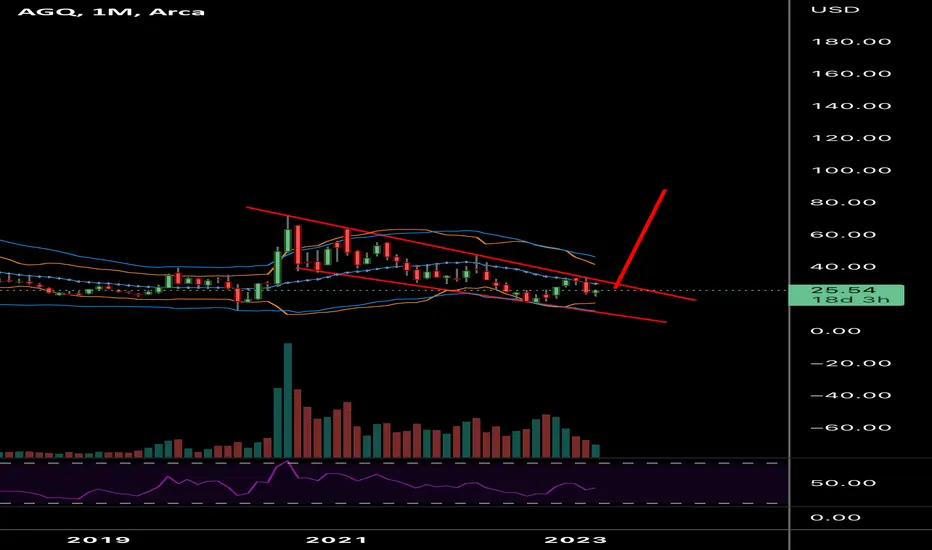
$AGQ $SLV Silver BoomAny good/silver/bitcoin related stocks will be following a similar pattern. Don’t miss the train!
✅SILVER STRONG DOWNTREND|SHORT🔥
✅A broken key structure level
Reinforces our bearish bias on SILVER
And I believe the price is set to move lower
To retest the target below
SHORT🔥
✅Like and subscribe to never miss a new idea!✅
We now wait for NFP!We now wait for the NFP!
Here we have the silver chart in-front of us!
We are currently within the range of lows: 19.800 highs: 20.450, Pattern: Triangle/ Bear flag
If we are to go above key resistance area and above 50EMA + TL resistance I expect first target to be 20.750 areas and then 200 EMA areas which is around next resistance zone of 21.400. However, we are to decline with a strong NFP, I expect 19.500/400 to be your target areas.
Regarding NFP checking the other data as well, see the differential of it and is it at a vast numeric change.
Trade Journal
