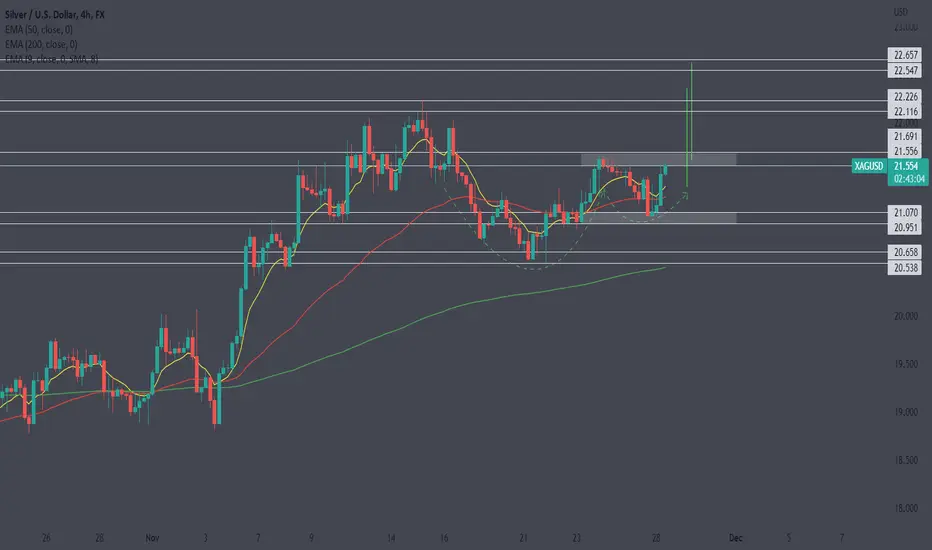
XAGUSD (Silver) Buy possibility Silver, which often follows the direction in gold, rallied sharply into December, with the benchmark futures contract on Comex hitting a seven-month high of $22.94 while spot silver hit a similar milestone with $22.74. Silver is up 5% month-to-date after rising almost 14% in November.
--
Investing.com
XAG
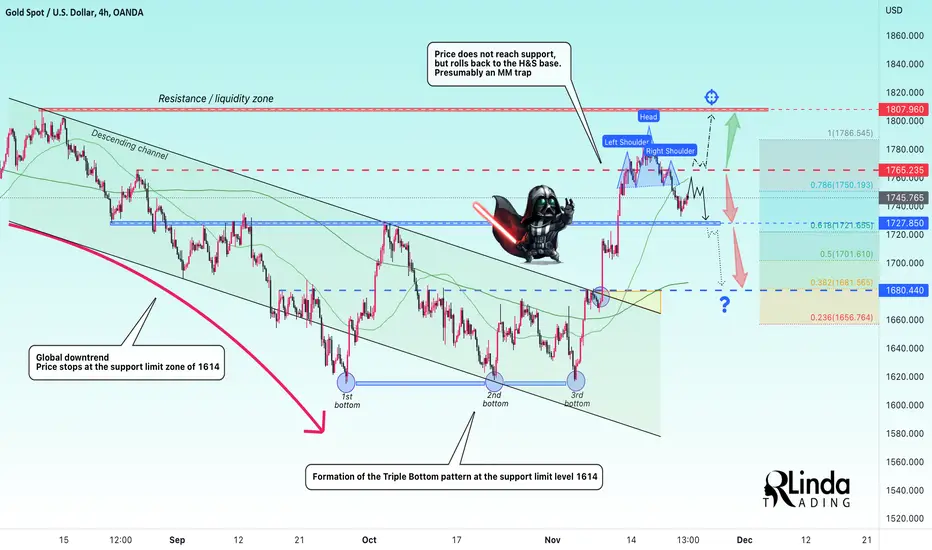
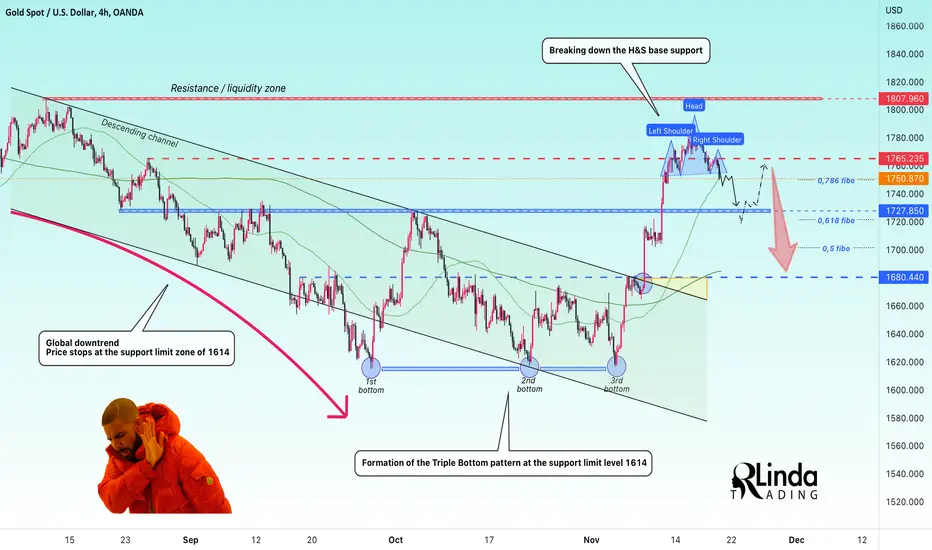
RLinda ! GOLD-> testing of support and Fibo levels 0.618, 0.5Gold is down $43 from yesterday's high. A technical pullback is forming to the key support level of 1765.
Gold is in an uptrend channel. The price is still respecting the range boundaries and pulling back to the important support at 1765. There was a touch last night. Also, slightly above the support of 1765 is the key Fibonacci level of 0.5, which is a strong enough reason to wait for a pullback in the price.
Since the price is near the support zone of the uptrend, I expect price growth in the short term. The short-term target is the resistance of 1807.96. Medium-term potential -1858 and 1869.
Regards R.Linda!

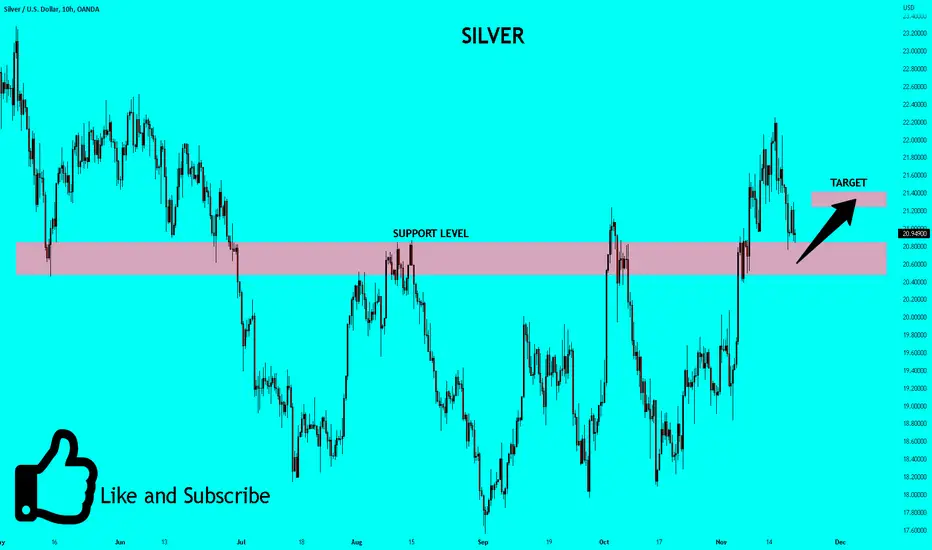
✅SILVER UPDATE|LONG🚀
✅SILVER went down from the
Breakout highs which is normal
But now the price is approaching
A support level from where
I predicted a rebound last time
And I stand by my opinion today
LONG🚀
✅Like and subscribe to never miss a new idea!✅
Silver-Correct analysisTrue analysis. Tast's an update. Based on my analysis for XAGUSD on Jul 27 & Aug 1.
Observe the money management and the stop loss, to know about analysis, follow me and contact me if you have any comments or questions. (I will answer whenever I have time).
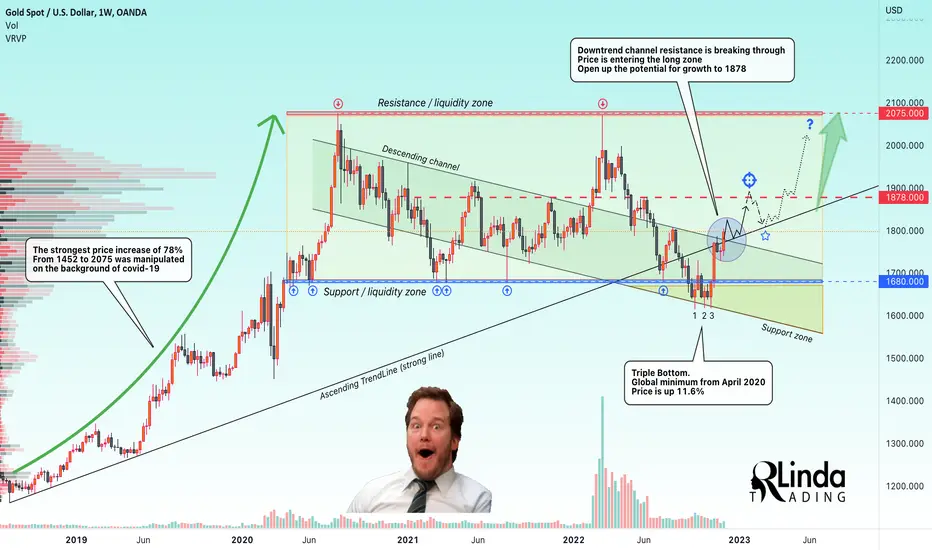
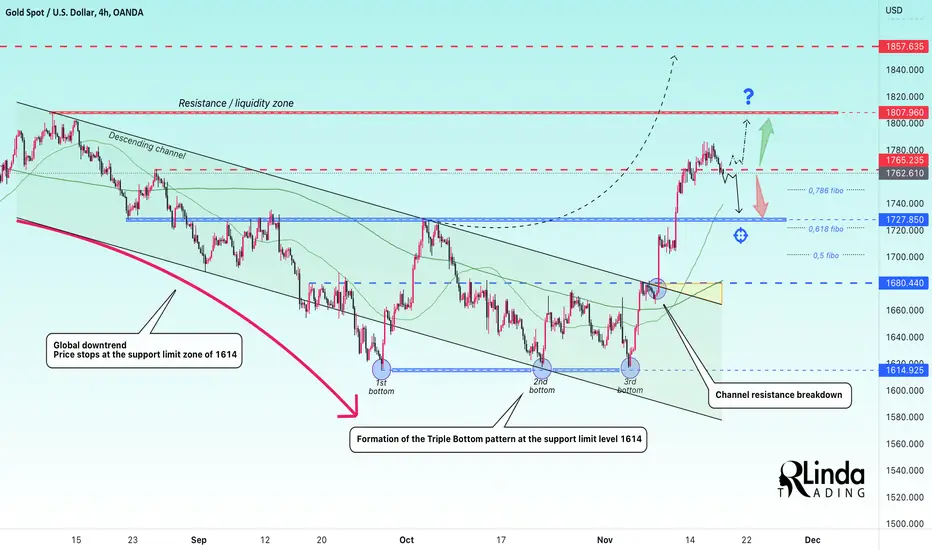
RLinda ! GOLD-> Are the bulls looking to go up to $1878 ?Gold is rising 11.6% from the Triple Bottom pattern that was formed. Earlier I pointed to a pullback from resistance. The technical fall was stopped at 1730, after which the price returned to retest the 1775 zone and the bulls are overcoming the hurdle.
As we saw, the price within the downtrend respected the boundaries of the downtrend price channel. The reversal pattern was formed on the support of the range. What happened?
Since early November, when the third confirmation of the bottom was made, the gold has recovered from the low to almost $1800 (by 11.6%). Following that, gold is breaking up the resistance of the downtrend channel after a two-week retest.
The price is above the uptrend line formed since August 2018. Gold is now in the long zone of the new 1775-1878 range. The trading instrument opens for itself a new upside potential. Important targets: liquidity zone 1850, resistance 1878 and liquidity zone 1900
Regards to R. Linda!
A traders’ week ahead playbook – the calm before the storm We move past US payrolls with only a momentary shake for risky markets - the immediate reaction was to buy USDs, sell Treasuries and equity, however, the market was quick to reverse that flow. When we drill down into wages, revisions and the balance between the Household and Establishment survey, the wash-up is it supports the ‘soft landing’ argument and won’t change the Fed’s course, where a 50bp hike next week and a peak 5%-5.25% fed funds rate is still the firm default position.
Taking a review of the week that was, it’s hard to go past the 37bp decline in US 5yr real rates to 1.12%, with US 2yr Treasury yields falling 18bp to 4.27% – Fed chair Powell had the opportunity to push back on the recent easing of financial conditions in his Brookings speech but refrained from doing so, and it was game on from there, with US real rates driving down the USD 1.5% WoW, and closing firmly below its 200-day MA.
In a world of falling real rates, the JPY reigned supreme gaining 3.6% (vs the USD) and much attention has been placed on BoJ Tamura’s comments around a potential review of BoJ policy – arguably one of the macro thematic’s that needs to be considered for 2023, where a change in BoJ policy stance could have massive implications for Japanese and global bond markets and of course the JPY and JPN225. USDJPY hit the 200-day MA and is getting a real work out from clients – would be looking at modestly lower levels to get long for a tactical bounce.
With limited data to drive this week and no Fed speakers, the market may start to think for itself and look at massaging exposures ahead of the following week – a week which is riddled with tier 1 event risk – the result could easily be traders pairing back USD shorts into the back end of the week – this same factor could see US Treasury yields rise and weigh on equity, and while the technical target remains above 4200 in US500, there are ever greater signs of overbought readings in the market internals.
In G10 FX I am particularly looking at NZDUSD, EURUSD and in the commodity space silver (XAGUSD), all of which have come up on my momentum scan - where price has made a new 40-day high, and the 3-day ROC is in the 75th percentile of its 12-month range. I am looking for further near-term upside in these plays but given this risk of position squaring into the tail of the week these markets are the markets I will be watching.
Watching crude on the open with OPEC leaving output levels unchanged on Sunday – it feels like traders had positioned for this outcome going into the weekend, although there may be some legacy positioning that needs to come out of price on the open - happy to hold Spotcurde shorts for $78
China remains a dominant driver and the good news has been rolling in – through the weekend we’ve heard more news with Shanghai and Hangzhou easing restrictions, with PCR tests no longer needed to visit certain public venues. Given the moves it feels like markets have discounted a lot and new news needs to be far more impactful. Well see, but the set-up in USDCNH interests and a breakthrough in the neckline of the head and shoulder pattern may see further USD selling across G10 FX – one for the radar, while I am watching Chinese/HK equity markets and would be adding to longs in HK50 on a close above 19,200.
Rates Review – we look at what’s priced for the next central bank meeting and the step up in the following meetings
Factors to watch in the week ahead
US – With the Fed now in a blackout period through to the FOMC meeting (15 Dec), the focus is firmly on the data flow – next week’s Nov CPI print is the main game and looms large, but it’s worth noting that this coming week is quiet by way of known event risks – unit Labor cost (8 Dec 00:30 AEDT) is an important data point, but despite an expected decline to 3.1% (from 3.5%) it is unlikely to spur vol across markets. The ISM service report (6 Dec 02:00 AEDT) is eyed at 53.3 (from 54.4), suggesting the service sector is holding up well and further supporting those in the ‘soft landing’ economic camp.
We also get Nov PPI (10 Dec 00:30 AEDT), which is eyed at 5.9% (from 6.7%) and while this could get more of a look this week, unless we see a dramatic miss, I’d argue it is most likely a non-market mover. We also get the University of Michigan's 5-10 inflation expectation no Friday, where a number below 3% would be welcome news to the risk bulls and promote further USD selling.
Australia – while we get the Q3 GDP print on Wed (consensus 6.2% YoY), the highlight of the week is the RBA meeting (Tuesday 14:30 AEDT) – it would be a huge surprise if they didn’t hike by 25bp, and given that outcome is thoroughly priced, the move in the AUD will come from the tone of the statement and whether they are seeing ever clearer evidence that inflation has turned on a sustained basis. We can also marry the tone of the statement with pricing further out the rates curve, where peak/terminal expectations for the cash rate sit at 3.57%, implying another 75bp of hikes by mid-2023 – one can argue that a further 75bp of hikes is too punchy.
China – while headlines on Covid freedoms will likely drive markets, it’s worth noting the China Politburo meeting on Tuesday, where we may get some additional colour on economic policy for the year ahead. On the data docket we get Nov trade data (7 Dec – no set time), CPI/PPI (9 Dec 12:30 AEDT) and Nov credit data (no set date) – CPI is expected to print 1.6% (from 2.1%), so in theory, this offers further scope for the PBoC to lower the prime rate later this month. USDCNH is ominously poised for a deeper correction, as the daily chart shows, with price testing the head and shoulders neckline – an outcome which would support the AUD and NZD. I like Chinese/HK equities higher and see a high probability the HK50 tests its 200-day MA soon.
Canada – We’ve seen the CAD underperform most G10 FX currencies over the past month, notably with some huge moves in CADJPY and NZDCAD. The Bank of Canada (BoC) meet Thursday (02:00 AEDT) and expectations are split between a 25bp or 50bp hike - with 32bp of hikes priced into Canadian rates markets it could be a lively meeting for CAD traders – I’d be taking some of CAD shorts off the table into the meeting, as there are real risks of a 50bp hike
UK – while we look at UK CPI and the BoE meeting in the following week, this week is pretty quiet on the UK data front, where it’s mostly tier 2 releases that shouldn’t dive too much flow in GBP – we do get the BoE’s inflation attitudes survey (9 Dec 20:30 EDT) which could offer some insights on inflation trends - but on the whole, it’s a week where the GBPUSD will respond to external factors and broad market sentiment
Eurozone – Another region where the data is unlikely to impact too intently – we do see 11 ECB speakers, with President Lagarde due to speak on Monday (12:40 AEDT). The market prices a 50bp hike at the Dec ECB meeting, but if the ECB is looking at 75bp then this is the week to guide expectations
The week that matters – this week will be about getting exposures in check and reacting to any landmines that fall in our path – looking at the following week it honestly doesn’t get any more potent – how’s this for event risk and a very lively 3 days in markets? We’ll cover it later in the week, but it doesn’t get bigger than this and could shape much of Q1 23.
• US CPI – 14 Dec 00:30 AEDT – this is the big event risk…when we look at implied volatility the CPI report is the defining risk event this year.
• UK CPI – 14 Dec 18:00 AEDT
• FOMC meeting (50bp hike expected) – 15 Dec 06:00 AEDT
• SNB (50bp hike expected) – 15 Dec 19:30 AEDT
• BoE meeting (50bp hike expected) – 15 Dec 23:00 AEDT
• ECB meeting (50bp hike expected) – 16 Dec 00:15 AEDT
• BoJ – 20 Dec
Good luck all....

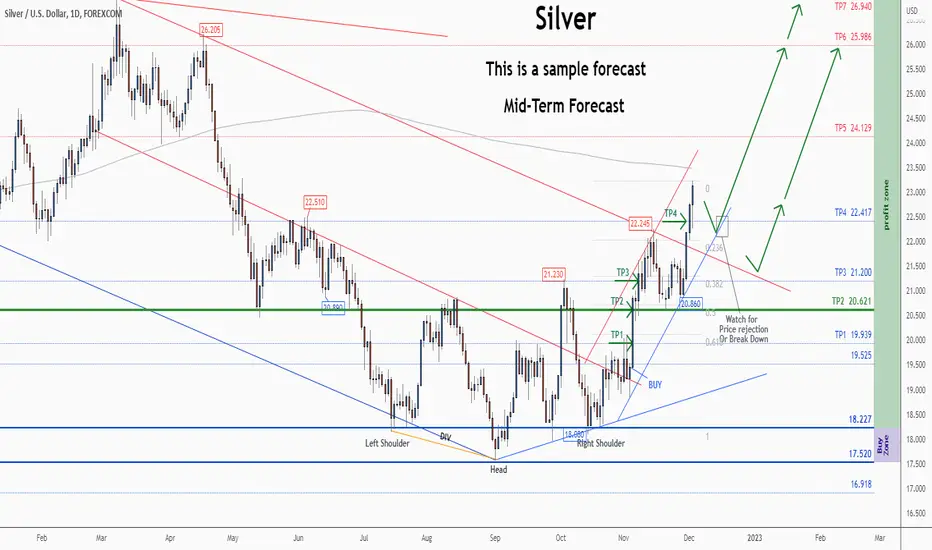
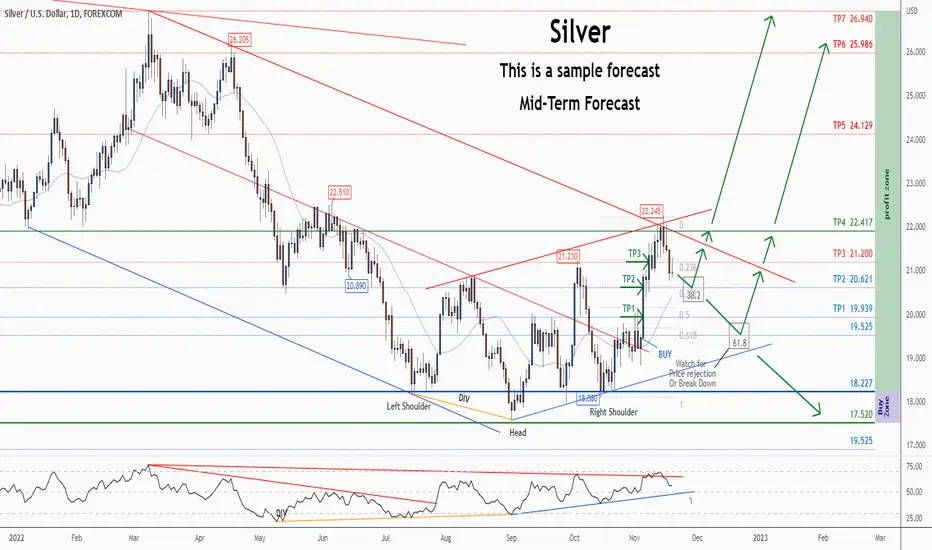
💡SILVER (XAGUSD) - Weekly Technical Analysis UpdateMidterm forecast:
20.621 is a major support, while this level is not broken, the Midterm wave will be uptrend.
We will close our open trades, if the Midterm level 20.621 is broken.
Technical analysis:
While the RSI uptrend #1 is not broken, bullish wave in price would continue.
A trough is formed in daily chart at 20.860 on 11/28/2022, so more gains to resistance(s) 24.129, 25.986, 26.940 and more heights is expected.
Price is above WEMA21, if price drops more, this line can act as dynamic support against more losses.
Relative strength index ( RSI ) is 71.
Take Profits:
19.939
20.621
21.200
22.417
24.129
25.986
26.940
28.304
29.850
37.500
44.200
49.800
60.000
❤️ If you find this helpful and want more FREE forecasts in TradingView
. . . . . Please show your support back,
. . . . . . . . Hit the 👍 LIKE button,
. . . . . . . . . . Drop some feedback below in the comment!
❤️ Your support is very much 🙏 appreciated!❤️
💎 Want us to help you become a better Forex / Crypto trader?
Now, It's your turn!
Be sure to leave a comment; let us know how you see this opportunity and forecast.
Trade well, ❤️
ForecastCity English Support Team ❤️
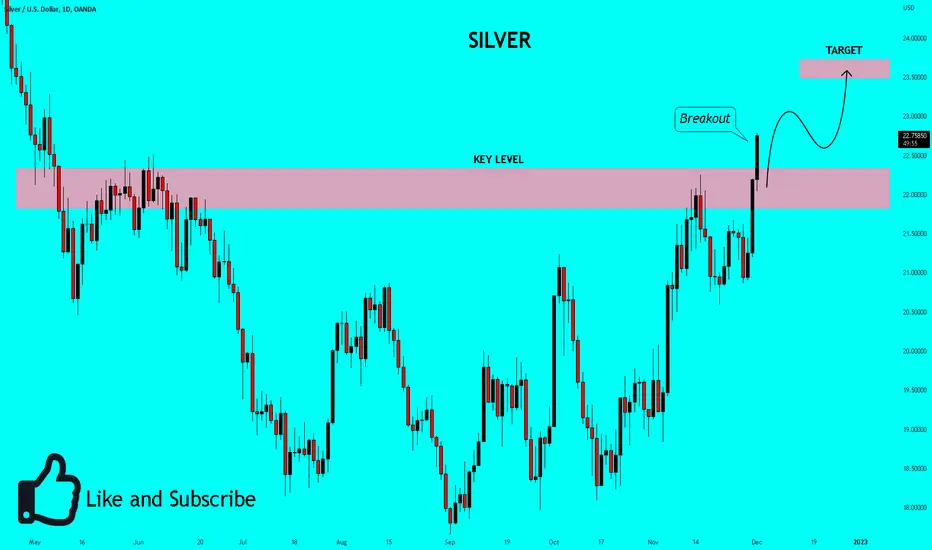
SILVER Will Keep Growing! Buy!
Hello,Traders!
SILVER is trading in an uptrend
And the price broke a strong resistance
Which is now a support so after some
Consolidation I belive that we will see
A further move up
Buy!
Like, comment and subscribe to boost your trading!
See other ideas below too!
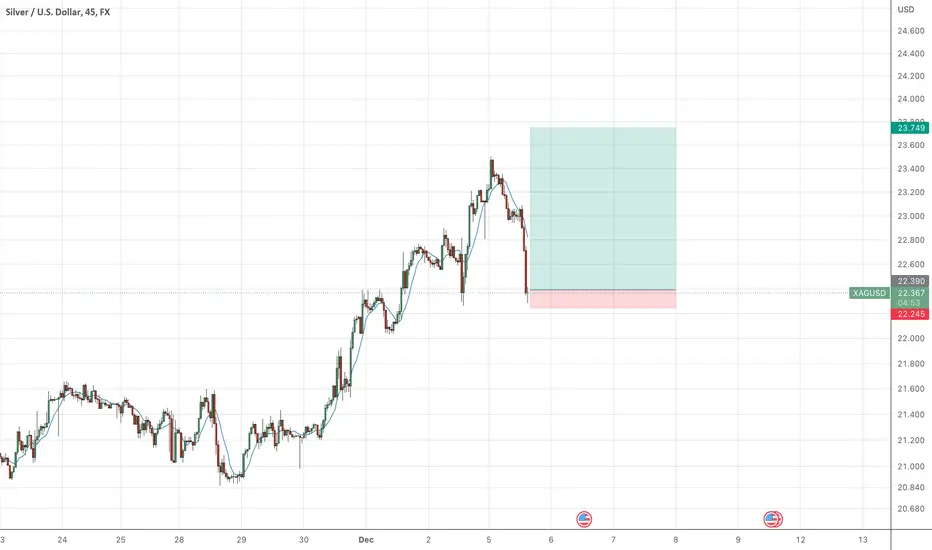
Silver - Up, Up and Away!Silver - Up, Up and Away!
Double bottom - been loving the long side of silver, any pull back is an opportunity towards 23 half areas imo and be careful as we still have nfp but even if get a pull back on nfp I am dripping in further silver and other pairs.
Best,
TJ

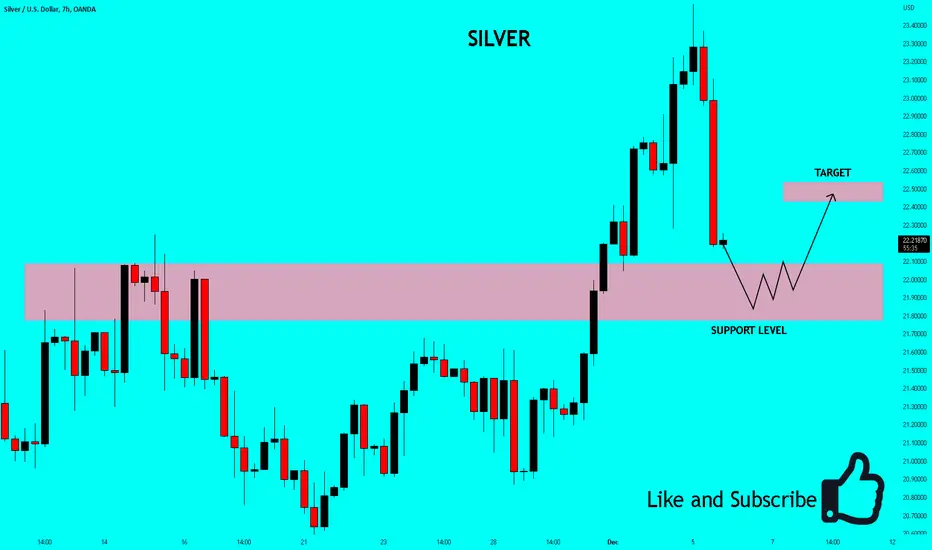
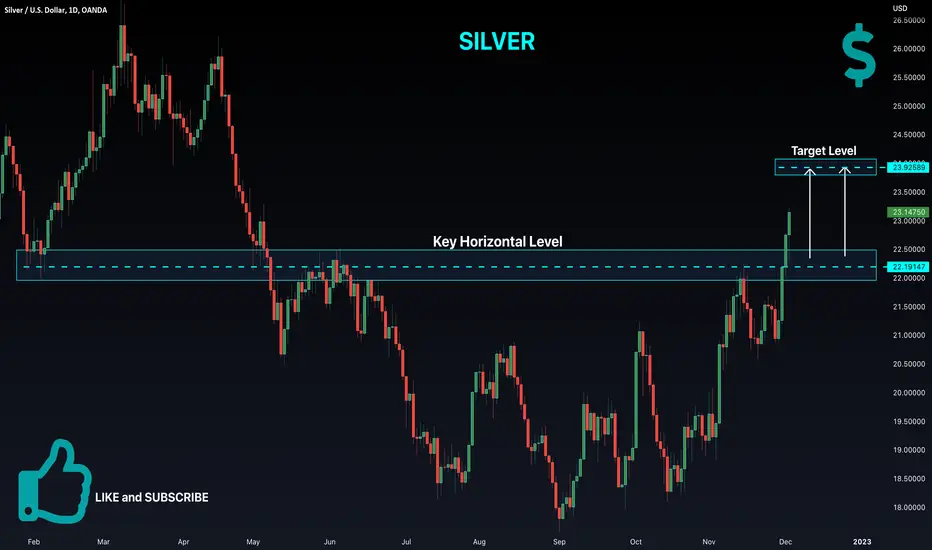
✅SILVER WILL GO UP|LONG🚀
✅A broken key structure level
Reinforces our bullish bias on SILVER
And I believe the price is set to move higher
To retest the target above
LONG🚀
✅Like and subscribe to never miss a new idea!✅
$XAG Silver - Opportunity! $XAG Silver - Opportunity!
Cup & Handle pattern - Great opportunity to take on...
Break below 21 areas this pattern will no longer be valid.
P.S Don't forget to trade your OWN trade plan.
TJ
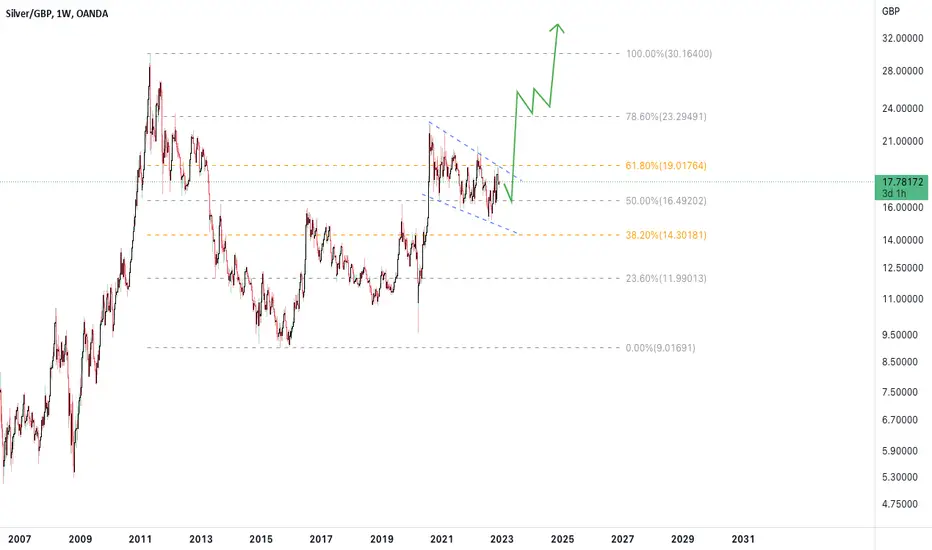
XAGGBP All pointing in one direction You are aware that the silver paper market is a fraud. The exchanges and computers are under JP Morgan's supervision, so when they deem it appropriate, the price will rise. Silver is undervalued and is manipulated, as we all know.
Physical premiums will certainly skyrocket. If you don't hold on to your silver, it belongs to someone else. Similar to cryptocurrency, keep yourself secure.
UK is about to collapse, and unfortunately the pound died with the queen. There is a system in place that aims to reduce economic freedom. Your money will first be destroyed. Keep gold and silver on hand to safeguard your wealth. They have endured throughout time.
Silver : $100 $200 $500 ? be ready
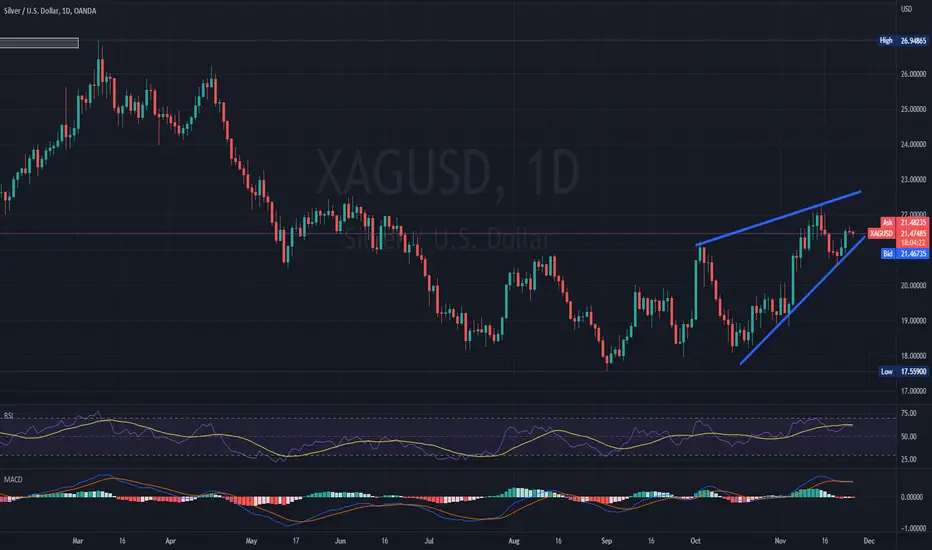
SILVER BULLISH PATTERN EMERGINGXAGUSD is in the process of formatting a rising wedge pattern on the daily graph which might give a bullish momentum for the instrument in the next couple of days. The weakening of the dollar is also making investments in precious metals more desirable for the investors.
RSI indicator is strongly confirming the outlook, being above the 50 neutral line, the confirmation of MACD is weaker, with the histogram still below the 0 value, but still rising.
If this trend continues, the price of the instrument might try to reach levels of 21.725, but on the other hand, if the trend reverses, the price might test its previous support at 21.333
Risk Disclosure: Trading Foreign Exchange (Forex) and Contracts of Difference (CFD's) carries a high level of risk. By registering and signing up, any client affirms their understanding of their own personal accountability for all transactions performed within their account and recognizes the risks associated with trading on such markets and on such sites. Furthermore, one understands that the company carries zero influence over transactions, markets, and trading signals, therefore, cannot be held liable nor guarantee any profits or losses.
RLinda ! GOLD-> Weekly candles in the bullish zoneGold is trading in a range between support 1727 and resistance 1765. A little short of the key support, the price pulls back to the base line of the H&S pattern. So, what is it and what to expect next?
(Chart 1. Weekly timeframe. Bullish strength manifestation and price moves into the long zone )
The pattern base line is about to be tested and after the retest, the price might go back to the support at 1727.85. By opening the weekly chart of the gold, we can see that the strong trendline, which was confirmed 7 times before (on the weekly chart), has been broken up! Now the price is in the long zone and there is a huge upside potential.
The new week is forming a bar with a long tail from the bottom after touching the line, which might indicate a bullish sentiment.
Weekly RSI reverses and trades above the neutral line
Weekly MACD is forming a sliding line crossover, while the chart has moved into the green zone
(Chart 2. Daily timeframe. Technical analysis)
Daily timeframe. Price is testing the underlying support zone, while the macd and rsi are in bullish zones. The price can go up to 1800, but it is important for the price to break through the level of 1765 on the local timeframe and to take the upper ground, if that is the case, our target will be the resistance of 1807.
Regards R.Linda!
Analysis XAGUSD : 📅 11/21/2022XAGUSD analysis:
Due to the weakness in the continuation of the rise and the breakdown of the sideways price floor
and the formation of a downward trend, we can expect a correction to the ceiling of the trend and move towards the downward targets
.
.
price: 21.09000
sl: 21.45000
tp: 20.05500
.
👤 Alireza hajighasem : @alirezahajighasem
.
.
📅 11/21/2022

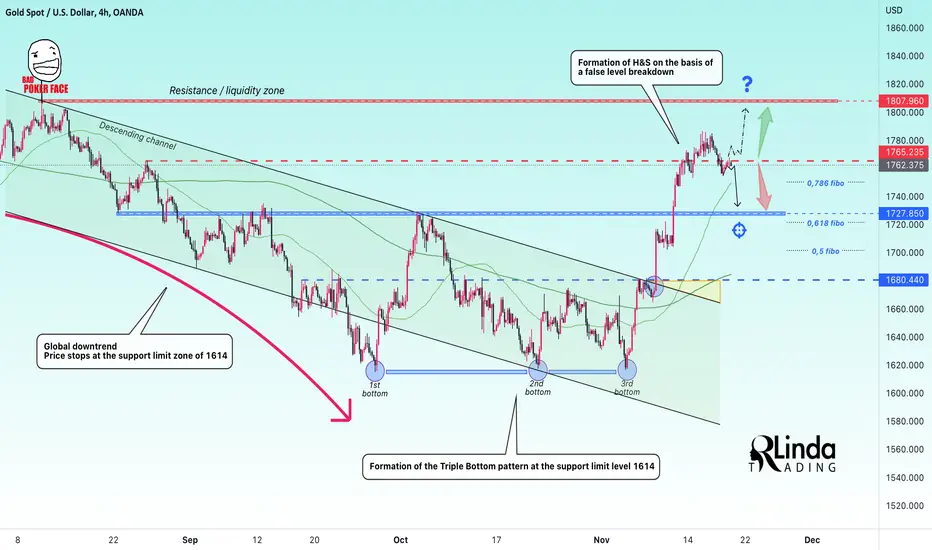
RLinda ! GOLD-> The appearance of bearish signalsGold is testing the trendline resistance formed since September 1, 2022. The price has not reached the daily MA-200, at the same time a false break of the upside resistance, horizontal resistance of 1765.575 and a bullish signal from the Gartley pattern is formed.
(Chart 1. Daily timeframe)
Gold closed Friday's afternoon candlestick in its lows, which can be interpreted as an incomplete move that might continue. Therefore, it looks like the price will get weaker. At the same time, gold's fall was helped by a stronger dollar and rising 10-year government bond yields (10-year U.S. bond yields rose 5 basis points to 3.821%. )
The drop came as the dollar rose after an early weakening, making the precious metal more expensive for international buyers. The ICE dollar index rose 0.25 basis points last time out.
Nevertheless, gold remains near a three-month high as investors count on the Federal Reserve not to raise interest rates.
(Chart 2. Daily Timeframe. Bullish Signal Formation using the "Bat Pattern" as an example)
Technical Analysis:
Gold continues to experience pressure from the resistance in the form of the daily MA-200, the price is in an upward range.
The price makes a false break of the strong resistance zone and forms a decline, also a bullish signal is indicated by the presence of a bearish Gartley "Bat" pattern
The daily Gartley pattern is a pullback to 0.889 (ideally 0.886) from the XA movement. A signal for a bullish move.
Daily RSI gives a bearish signal, the price indicator on the chart also coincides with it
The daily MACD tends to the crossover point of the sliders, at the same time the chart fades after the green spike, indicating a corrective movement.
(Chart 3. 4-hour timeframe XAUUSD. Formation of the pattern H&S)
On the above chart we also see a false break-through of the resistance 1765.575 and at the same time a strong bearish pattern "Head & Shoulders" is confirmed. I expect that from the session opening there can be a small pullback to the previously broken support of the pattern with the subsequent fall towards the support level of 1727.85
Sincerely R. Linda
✅SILVER WILL GO UP|LONG🚀
✅SILVER is going down to retest a horizontal support
Which makes me locally bullish biased
And I think that we will see a rebound
And a move up from the level
Towards the target above
LONG🚀
✅Like and subscribe to never miss a new idea!✅
💡SILVER (XAGUSD) - Weekly Technical Analysis UpdateMidterm forecast:
While the price is above the support 17.520, resumption of uptrend is expected.
We make sure when the resistance at 22.417 breaks.
If the support at 17.520 is broken, the short-term forecast -resumption of uptrend- will be invalid.
Technical analysis:
While the RSI uptrend #1 is not broken, bullish wave in price would continue.
A peak is formed in daily chart at 22.245 on 11/15/2022, so more losses to support(s) 20.621, 19.939, 19.525 and minimum to Major Support (17.520) is expected.
Price is above WEMA21, if price drops more, this line can act as dynamic support against more losses.
Relative strength index (RSI) is 56.
Take Profits:
19.939
20.621
21.200
22.417
24.129
25.986
26.940
28.304
29.850
37.500
44.200
49.800
60.000
❤️ If you find this helpful and want more FREE forecasts in TradingView
. . . . . Please show your support back,
. . . . . . . . Hit the 👍 LIKE button,
. . . . . . . . . . Drop some feedback below in the comment!
❤️ Your support is very much 🙏 appreciated!❤️
💎 Want us to help you become a better Forex / Crypto trader?
Now, It's your turn!
Be sure to leave a comment; let us know how you see this opportunity and forecast.
Trade well, ❤️
ForecastCity English Support Team ❤️
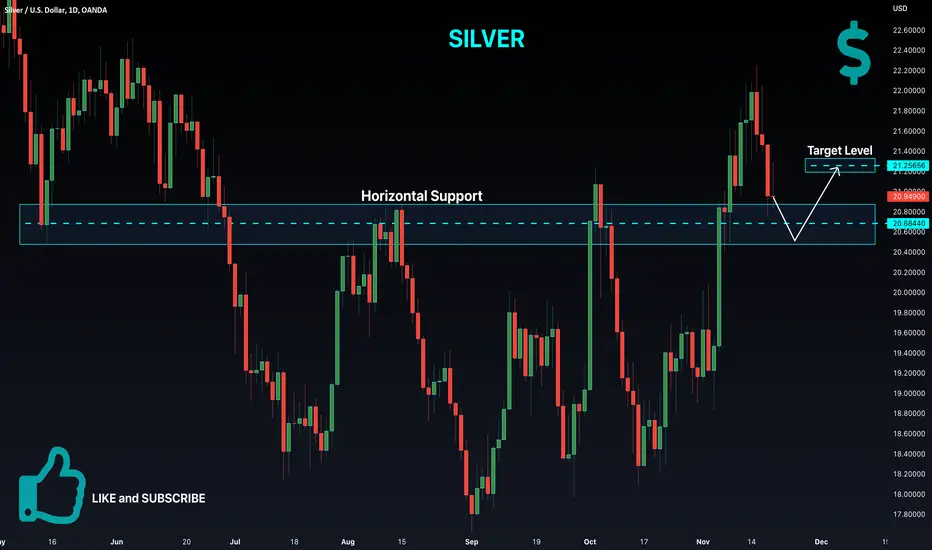
SILVER Support Ahead! Buy!
Hello,Traders!
SILVER is making a bearish
Correction towards the key
Horizontal level which is now
A support, from where
I will be expecting a rebound
And a retest of the target above
Buy!
Like, comment and subscribe to boost your trading!
See other ideas below too!
RLinda ! GOLD-> Distribution→Accumulation→... What's next? Gold has been surprising lately with its strong gains, renewing its August 16 high to 1786.545, which is almost 10% since early November, but a technical pullback is forming at the moment, which at the same time shows interesting things that could excite both bulls and bears.
(Chart 1. Daily timeframe of the XAUUSD chart)
On the one hand, the futures are experiencing, U.S. economic data showing a decline in inflation, which gives the Fed an opportunity to slow tightening, which should help gold.
On the other hand, the metal's price is affected by the Fed's caution, which does not want to change the tone of its message based on any one piece of economic material
Gold lost 15% from its March peak after the Fed began tightening monetary policy, but it has risen nearly 10% since early November as markets began to assess a slower pace of rate hikes.
(Chart2: Daily DXY Timeframe Technical Analysis)
The DXY dollar index fell, making bullion cheaper for overseas buyers. However, the currency was still aiming for weekly gains as the Fed's tough stance put the brakes on the pullback caused by softer inflation data last week.
But at the same time there is no strong pullback after the decline in the index, the price is forming a consolidation with locally lower daily highs. Price tends to test the daily MA-200.
Daily RSI is trading in the red zone below the neutral line
The daily MACD is signaling a strong bearish bias.
(Chart3: Daily Gold Timeframe Technical Analysis)
The daily gold chart indicates a false breakout of resistance at 1765.575, but at the same time price is returning to retest the level from below.
Price tries to test the daily MA-200, but it has to break through the resistance zone of 1765-1770 before it can advance to 1807.
Daily RSI is showing a bearish signal
Daily MACD is showing a bullish slowdown. Price is going into a consolidation phase.
(Chart4. Lower timeframe. Formation of bearish pattern) .
On the 30 minute chart, price exits the upward price channel after a false breakdown of resistance 1765.575. The price from distributive movement moves into consolidation phase.
Also, the right shoulder pattern "Head and Shoulders" starts to form, signaling us about a possible drop in price, in case of breakdown of the pattern support.
Market sentiment is doubtful and in this case a logical outcome will be to see a pullback to the nearest support - 1726.795
Regards R. Linda!
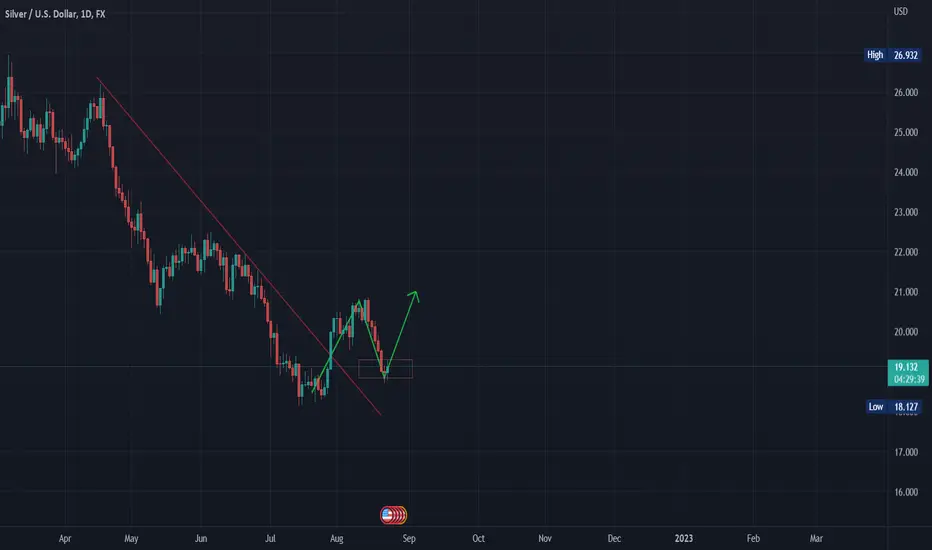
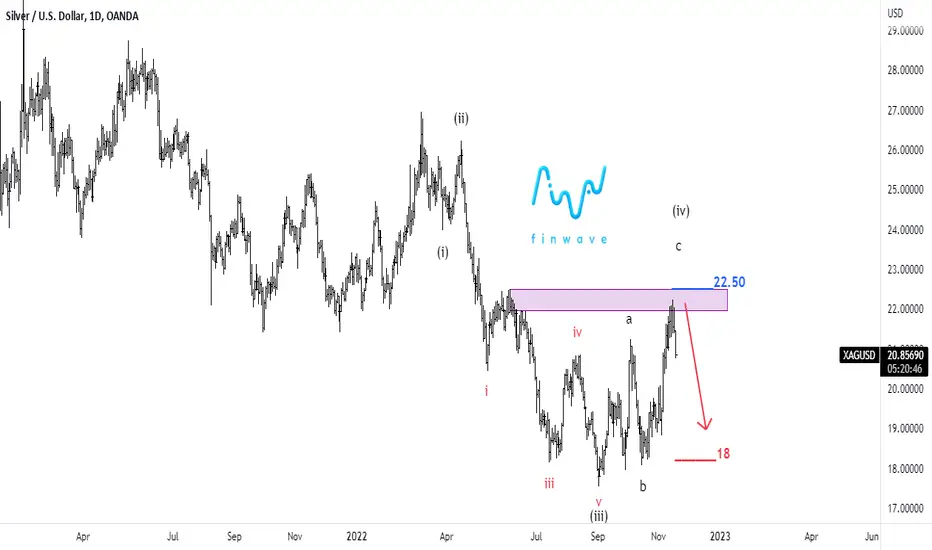
Financial Wave. SilverOur view on silver remains the same. We assumed that the price would turn down from $22-22.5. The first downside target in wave (v) is $18. A rise above $22.50 cancels this scenario.
RLinda ! GOLD-> False breakdown. The beginning of a correction? GOLD advances to a price high of 1786.545 on Tuesday, up nearly 10.5% overall from the bottom. The price makes a new high on August 16, 2022.
(Chart1. Daily Timeframe. Technical Analysis)
On the global chart, price makes a false breakout of the 1765.575 level and today price is updating the low of the last 3 days.
The price did not reach about 18 dollars to the resistance of the daily MA-200. Gold enters the range of 1765.5-1726.8 and it has a downside potential of 2.2%.
Daily RSI is forming a bearish signal and it's signaling the beginning of a down-correction.
Daily MACD is still bullish
On the hourly chart, a consolidation is forming under the level of 1765.23 after a false breakdown. The important zones ahead are as 0.786 FIBO and 0.618 FIBO, the latter is under the support of 1727.85. I expect that if this maneuver is not false and the price forms the first step for a technical pullback, the fall of the price can reach the 1727.85 zone and test the key Fibonacci level, which is at 1721.65
Regards R. Linda
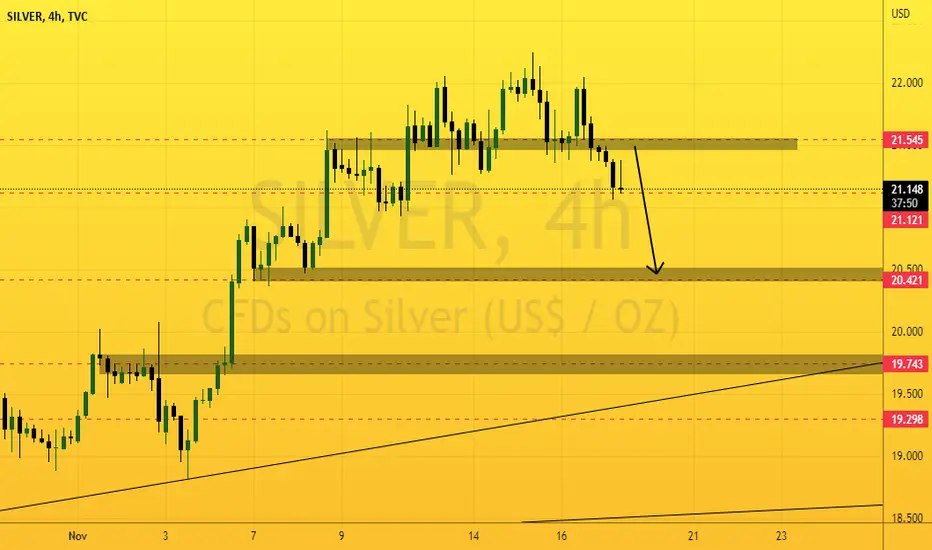
Silver is under selling pressure.Silver on the 4-hour timeframe is still facing a very difficult resistance, as it did not close above 22 until it tested this resistance three times and it did not succeed, so we expect silver to fall from these prices towards 20.42 areas, and then to 19.74 areas.
.
.
.
The four golden rules of trading
1 Don't be greedy
2 Always use stop loss
3 Never add other positions to the losing positions
4 Use a suitable lot for your account