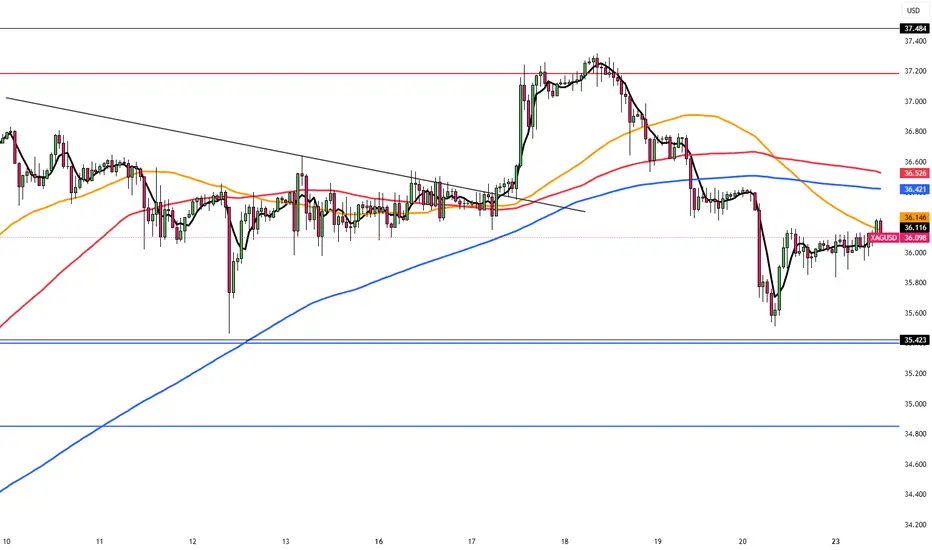
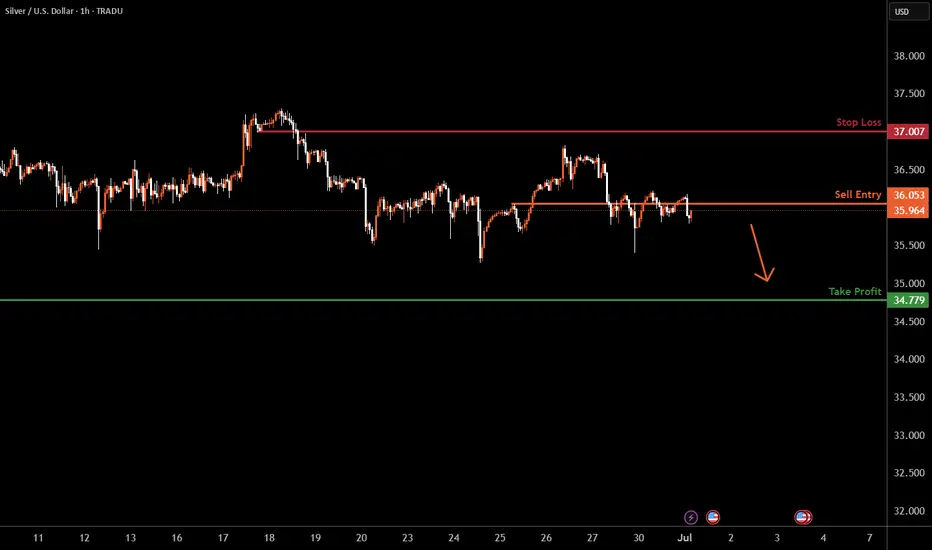
XAGUSD H1 I Bearish Drop Based on the H1 chart analysis, we can see that the price is approaching our sell entry at 36.05, a pullback resistance
Our take profit will be at 34.77, a pullback support.
The stop loss will be placed at 37.00, a pullback resistance.
High Risk Investment Warning
Trading Forex/CFDs on margin carries a high level of risk and may not be suitable for all investors. Leverage can work against you.
Stratos Markets Limited (tradu.com ):
CFDs are complex instruments and come with a high risk of losing money rapidly due to leverage. 63% of retail investor accounts lose money when trading CFDs with this provider. You should consider whether you understand how CFDs work and whether you can afford to take the high risk of losing your money.
Stratos Europe Ltd (tradu.com ):
CFDs are complex instruments and come with a high risk of losing money rapidly due to leverage. 63% of retail investor accounts lose money when trading CFDs with this provider. You should consider whether you understand how CFDs work and whether you can afford to take the high risk of losing your money.
Stratos Global LLC (tradu.com ):
Losses can exceed deposits.
Please be advised that the information presented on TradingView is provided to Tradu (‘Company’, ‘we’) by a third-party provider (‘TFA Global Pte Ltd’). Please be reminded that you are solely responsible for the trading decisions on your account. There is a very high degree of risk involved in trading. Any information and/or content is intended entirely for research, educational and informational purposes only and does not constitute investment or consultation advice or investment strategy. The information is not tailored to the investment needs of any specific person and therefore does not involve a consideration of any of the investment objectives, financial situation or needs of any viewer that may receive it. Kindly also note that past performance is not a reliable indicator of future results. Actual results may differ materially from those anticipated in forward-looking or past performance statements. We assume no liability as to the accuracy or completeness of any of the information and/or content provided herein and the Company cannot be held responsible for any omission, mistake nor for any loss or damage including without limitation to any loss of profit which may arise from reliance on any information supplied by TFA Global Pte Ltd.
The speaker(s) is neither an employee, agent nor representative of Tradu and is therefore acting independently. The opinions given are their own, constitute general market commentary, and do not constitute the opinion or advice of Tradu or any form of personal or investment advice. Tradu neither endorses nor guarantees offerings of third-party speakers, nor is Tradu responsible for the content, veracity or opinions of third-party speakers, presenters or participants.
XAG USD (Silver / US Dollar)
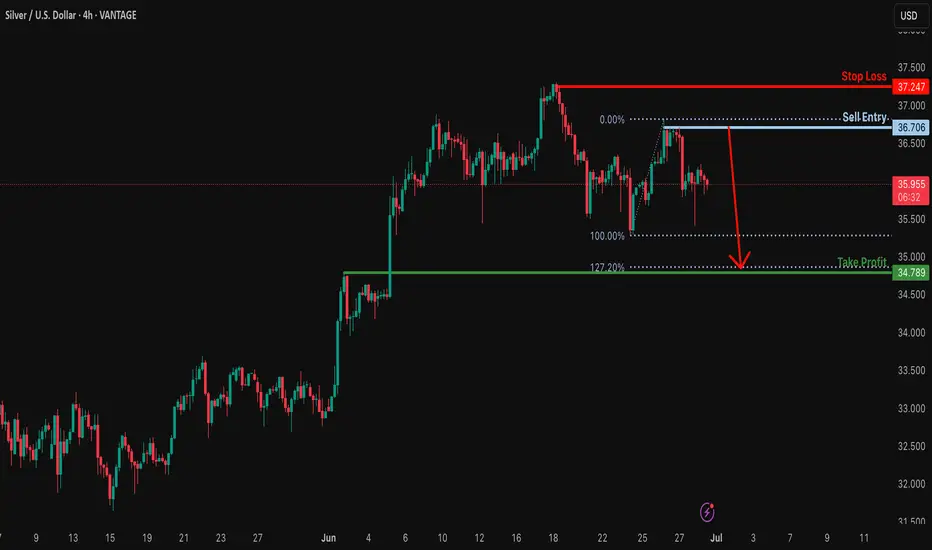
Bearish drop off pullback resistance?XAG/USD is rising towards the resistance level which is a pullback resistance and could drop from this level to our take proft.
Entry: 36.70
Why we like it:
There is a pullback resitance.
Stop loss: 37.24
Why we like it:
There is a pullback resistance level.
Take profit: 34.78
Why we like it:
There is a pullback support level that lines up with the 127.2% Fibonacci extension.
Enjoying your TradingView experience? Review us!
Please be advised that the information presented on TradingView is provided to Vantage (‘Vantage Global Limited’, ‘we’) by a third-party provider (‘Everest Fortune Group’). Please be reminded that you are solely responsible for the trading decisions on your account. There is a very high degree of risk involved in trading. Any information and/or content is intended entirely for research, educational and informational purposes only and does not constitute investment or consultation advice or investment strategy. The information is not tailored to the investment needs of any specific person and therefore does not involve a consideration of any of the investment objectives, financial situation or needs of any viewer that may receive it. Kindly also note that past performance is not a reliable indicator of future results. Actual results may differ materially from those anticipated in forward-looking or past performance statements. We assume no liability as to the accuracy or completeness of any of the information and/or content provided herein and the Company cannot be held responsible for any omission, mistake nor for any loss or damage including without limitation to any loss of profit which may arise from reliance on any information supplied by Everest Fortune Group.
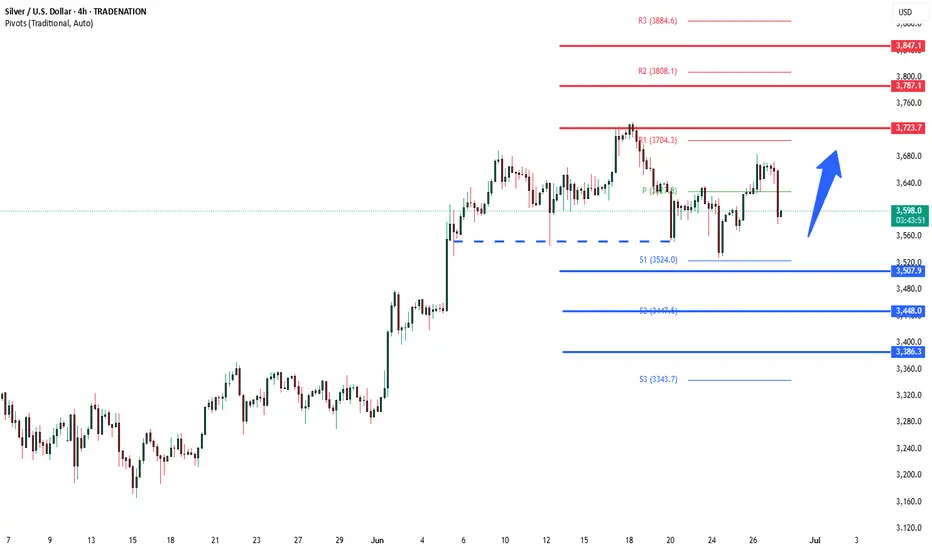
Silver sideways consolidation support at 3500Silver – Technical Analysis
The Silver price action continues to exhibit a bullish sentiment, underpinned by a prevailing rising trend. However, recent intraday moves indicate a corrective pullback, reflecting short-term consolidation within the broader uptrend.
Key Technical Levels:
Support:
3,500 – Primary support and previous consolidation zone; critical for maintaining bullish structure.
3,450 – Secondary support; potential downside target if 3,500 fails.
3,390 – Key lower support; aligns with a broader demand area.
Resistance:
3,720 – Immediate upside resistance; first target on a bullish bounce.
3,790 – Intermediate resistance; aligns with recent swing highs.
3,850 – Long-term resistance target; marks the upper boundary of the current bullish channel.
Scenario Analysis:
Bullish Continuation (Base Case):
A bounce from the 3,500 level would affirm the corrective pullback as temporary, with potential for a bullish continuation targeting 3,720, followed by 3,790 and 3,850 over a longer timeframe.
Bearish Reversal (Alternative Scenario):
A daily close below 3,500 would undermine the current bullish outlook and signal a deeper retracement, with downside risk toward 3,450 and potentially 3,390, where structural support may stabilize price.
Conclusion:
Silver remains structurally bullish, with the current pullback offering a potential entry point within the trend. The 3,500 level is the key pivot—holding above it supports further upside continuation, while a breakdown below would raise the risk of a deeper correction. Traders should watch for price action confirmation at this level to validate the next directional move.
This communication is for informational purposes only and should not be viewed as any form of recommendation as to a particular course of action or as investment advice. It is not intended as an offer or solicitation for the purchase or sale of any financial instrument or as an official confirmation of any transaction. Opinions, estimates and assumptions expressed herein are made as of the date of this communication and are subject to change without notice. This communication has been prepared based upon information, including market prices, data and other information, believed to be reliable; however, Trade Nation does not warrant its completeness or accuracy. All market prices and market data contained in or attached to this communication are indicative and subject to change without notice.

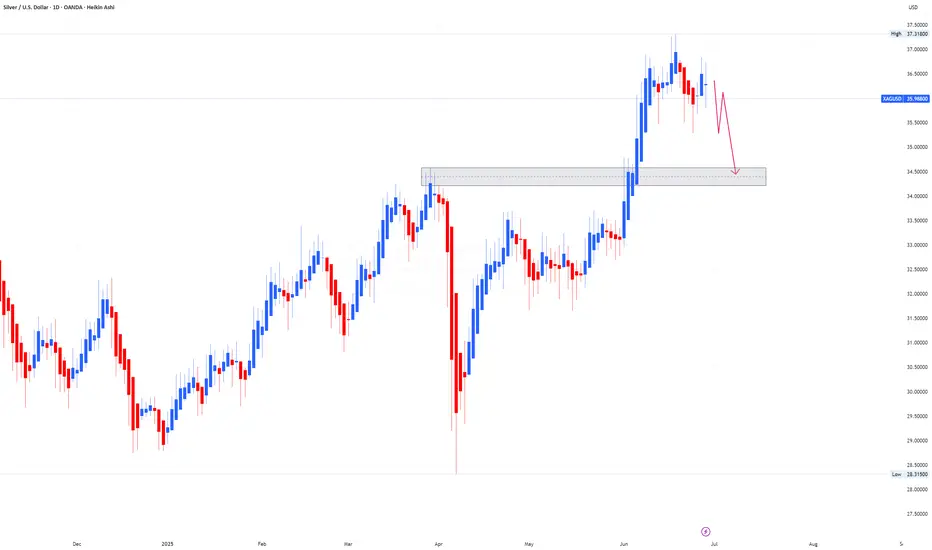
XAGUSD – Bullish Setup for a Move Toward 40 1. What happened recently
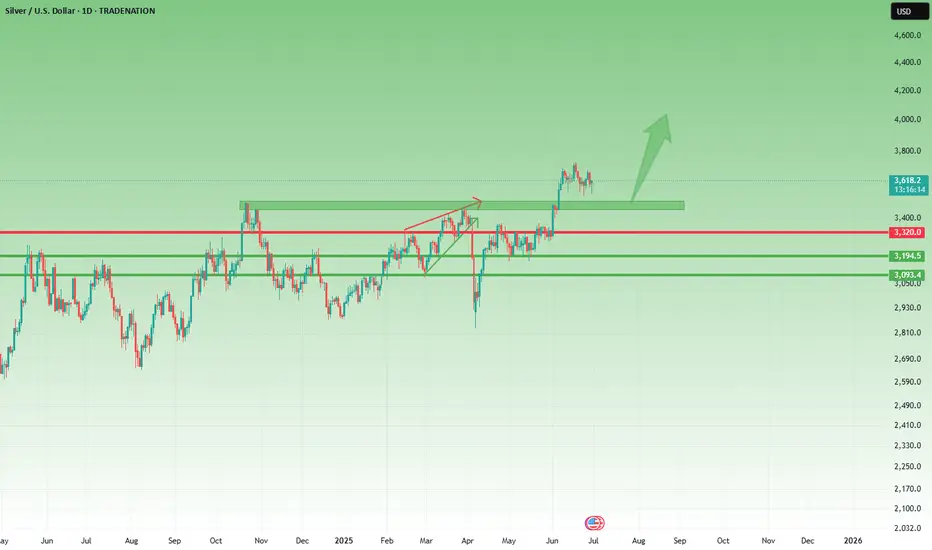
After the massive selloff in early April, Silver (XAGUSD) reversed aggressively — gaining nearly 10,000 pips and breaking into multi-decade highs near 38. That kind of move is not noise. It’s power.
The month of June brought consolidation, with price slowly correcting and stabilizing. But this doesn’t look like distribution — it looks like new accumulation.
2. The key question
Is Silver building a base for the next breakout, or has the rally run out of steam?
3. Why I expect another leg up
- 35.00 is now acting as a solid support — tested, respected
- The correction has been shallow, typical for a bull rectangle structure
- Momentum remains on the buyers’ side — no major breakdown signs
- If buyers step in strongly, the next target is clearly the 40.00 psychological level
- This is a textbook bullish continuation setup.
4. Trading plan
Swing traders should watch the 35.00–35.20 zone for buying opportunities.
The risk/reward is attractive — with a potential for +5000 pips on a move toward 40, while keeping stops under the base.
Buy the dips — not the breakouts.
5. Final thoughts 🚀
Silver is shining again. The trend is up, the structure supports further gains, and the chart is offering a clean setup. Until 35 fails, the bias remains bullish.
Disclosure: I am part of TradeNation's Influencer program and receive a monthly fee for using their TradingView charts in my analyses and educational articles.
silver head and shoulder pattern price breakout in first week of june then sideways entire month
during same time gold was selling off below $3430 resistance and fed was very hawkish on stagflation
if buyers stopped buying and seller come in then price can breakdown then neckline of pattern

Gold | Oil | Dollar | Silver | Natural Gas Price Forecast.Gold | Oil | Dollar | Silver | Natural Gas Price Forecast.
NYMEX:NG1! COMEX:GC1! AMEX:UNG COMEX:SI1!

"SILVER (XAGUSD) July Breakdown = Trend Reversal SetupSilver’s explosive rally may be running out of steam — the July setup is screaming SELL.
📌 Using Vinnie’s Trading Cheat Code System, here’s the case:
✅ CC SELL confirmed near the 37.30 zone
✅ RSI Overbought printed — classic blow-off top conditions
✅ MACD rolling over + weakening momentum
✅ Price rejected cleanly from the top of trend channel
🎯 Bearish targets:
34.60 – first reaction zone / channel midpoint
32.80 – channel base and high-volume node
This is a prime setup for a mean reversion trade or trend reversal, depending on how July opens. Looking to build shorts into rallies.
🧠 Powered by:
Confirm Alerts
CC MACD Screener
RSI OB/OS Zones
Cheat Code Trend Indicator
Watch for continued weakness below 35.80 to confirm momentum shift.
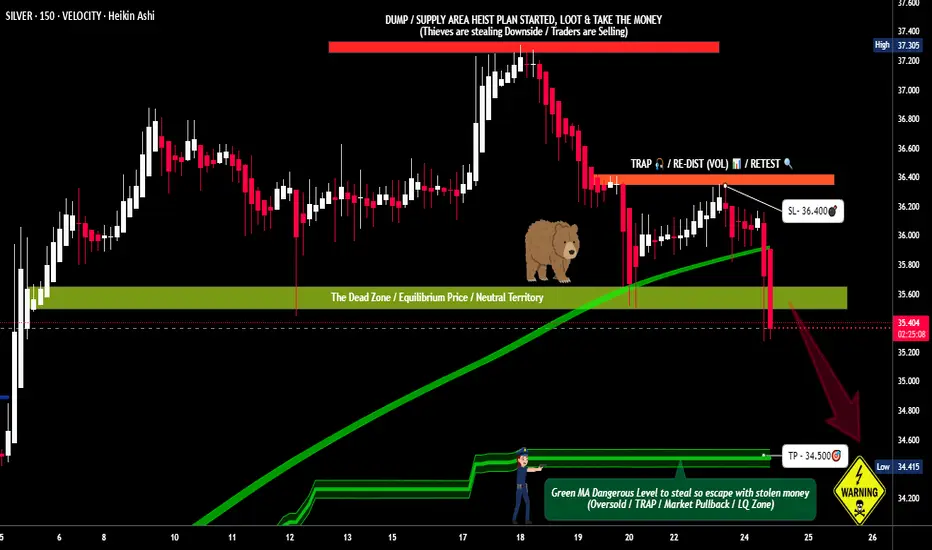
"The Vault is Open!" - Time to Steal Silver Pips🔥 XAG/USD SILVER HEIST: Bearish Raid in Progress! (Short Setup) 🔥
🦹♂️ ATTENTION SILVER BANDITS!
To the Metals Mercenaries & Risk-Takers! 💰🔪
Using our 🔥Thief Trading Tactics🔥, we're executing a bearish raid on XAG/USD - this is not advice, just a strategic robbery plan for traders who play to win.
📉 THE SILVER VAULT BREAK-IN (SHORT ENTRY PLAN)
🎯 Loot Zone: 34.500 (or escape earlier if bulls fight back)
💣 High-Stakes Play: Perfect pullback to steal pips
👮♂️ Cop Trap: Where bulls get liquidated
🔪 ENTRY RULES:
"Vault Breach Confirmed!" - Strike at pullback to nearest swing high/low (15-30min TF)
Sell Limit Orders for optimal risk/reward
Aggressive? Enter at market but watch gold correlation
📌 SET ALERTS! Don't miss the rejection
🚨 STOP LOSS (Escape Plan):
Thief SL at 36.400 (Key swing level)
⚠️ Warning: "Ignore this SL? Enjoy donating to bulls."
🎯 TARGETS:
Main Take-Profit: 34.500
Scalpers: Ride the NY session momentum
🔍 WHY THIS HEIST WORKS
✅ Industrial demand slowing
✅ Dollar strength crushing metals
✅ ETF outflows accelerating
✅ Technical rejection at key level
🚨 RISK WARNING
Avoid FOMC/NFP periods (Silver loves volatility)
Trailing stops = your escape plan
💎 BOOST THIS HEIST!
👍 Smash Like to fund our next raid!
🔁 Share to build our thief army!
🤑 See you at 34.500, bandits!
⚖️ DISCLAIMER: Hypothetical scenario. Trade at your own risk.
#XAGUSD #SilverTrading #Commodities #ThiefTrading
💬 COMMENT: "Short already - or waiting for better entry?"* 👇🔥
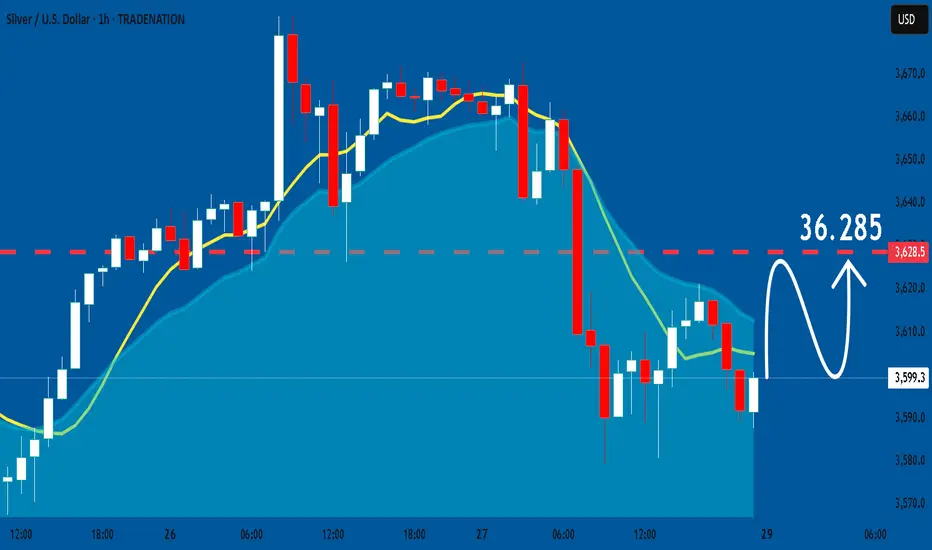
SILVER Sellers In Panic! BUY!
My dear friends,
Please, find my technical outlook for SILVER below:
The price is coiling around a solid key level - 35.993
Bias -Bullish
Technical Indicators: Pivot Points Low anticipates a potential price reversal.
Super trend shows a clear buy, giving a perfect indicators' convergence.
Goal - 36.378
About Used Indicators:
The pivot point itself is simply the average of the high, low and closing prices from the previous trading day.
Disclosure: I am part of Trade Nation's Influencer program and receive a monthly fee for using their TradingView charts in my analysis.
———————————
WISH YOU ALL LUCK
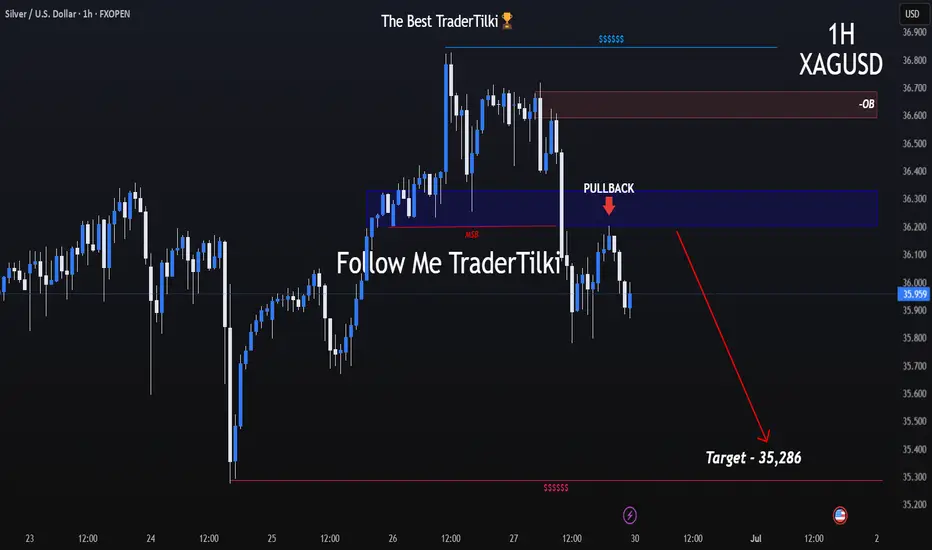
Is the Uptrend Over? Critical Break on the Silver 1-Hour ChartHey everyone,
After the upward trend structure on XAGUSD broke down, the support level was breached, followed by a pullback. Because of this, my target level is 35.286.💬
Also, keep a close eye on key economic data releases on the fundamental side, as they could significantly influence your strategy.
I meticulously prepare these analyses for you, and I sincerely appreciate your support through likes. Every like from you is my biggest motivation to continue sharing my analyses.
I’m truly grateful for each of you—love to all my followers💙💙💙
SILVER: Bulls Will Push
The price of SILVER will most likely increase soon enough, due to the demand beginning to exceed supply which we can see by looking at the chart of the pair.
Disclosure: I am part of Trade Nation's Influencer program and receive a monthly fee for using their TradingView charts in my analysis.
❤️ Please, support our work with like & comment! ❤️
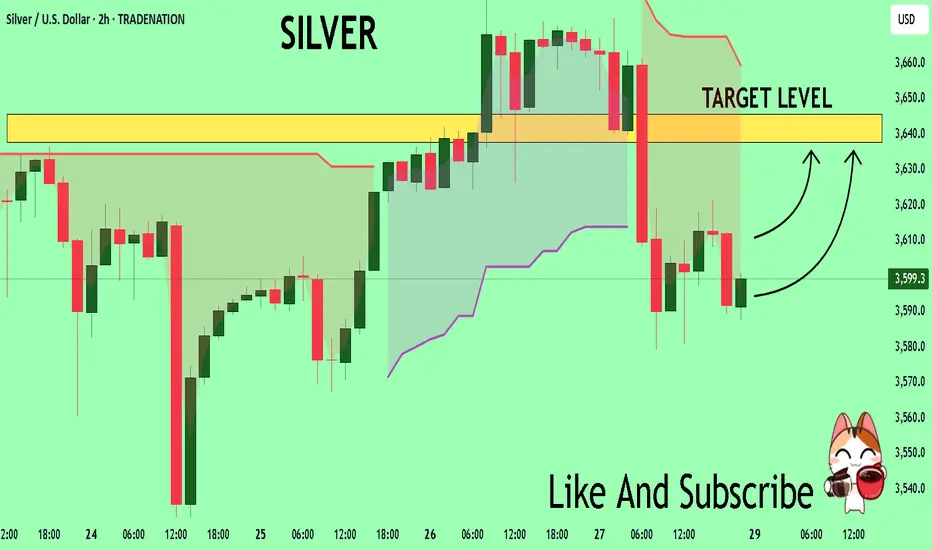
Silver consolidation supported at 3500Silver – Technical Analysis
The Silver price action continues to exhibit a bullish sentiment, underpinned by a prevailing rising trend. However, recent intraday moves indicate a corrective pullback, reflecting short-term consolidation within the broader uptrend.
Key Technical Levels:
Support:
3,500 – Primary support and previous consolidation zone; critical for maintaining bullish structure.
3,450 – Secondary support; potential downside target if 3,500 fails.
3,390 – Key lower support; aligns with a broader demand area.
Resistance:
3,720 – Immediate upside resistance; first target on a bullish bounce.
3,790 – Intermediate resistance; aligns with recent swing highs.
3,850 – Long-term resistance target; marks the upper boundary of the current bullish channel.
Scenario Analysis:
Bullish Continuation (Base Case):
A bounce from the 3,500 level would affirm the corrective pullback as temporary, with potential for a bullish continuation targeting 3,720, followed by 3,790 and 3,850 over a longer timeframe.
Bearish Reversal (Alternative Scenario):
A daily close below 3,500 would undermine the current bullish outlook and signal a deeper retracement, with downside risk toward 3,450 and potentially 3,390, where structural support may stabilize price.
Conclusion:
Silver remains structurally bullish, with the current pullback offering a potential entry point within the trend. The 3,500 level is the key pivot—holding above it supports further upside continuation, while a breakdown below would raise the risk of a deeper correction. Traders should watch for price action confirmation at this level to validate the next directional move.
This communication is for informational purposes only and should not be viewed as any form of recommendation as to a particular course of action or as investment advice. It is not intended as an offer or solicitation for the purchase or sale of any financial instrument or as an official confirmation of any transaction. Opinions, estimates and assumptions expressed herein are made as of the date of this communication and are subject to change without notice. This communication has been prepared based upon information, including market prices, data and other information, believed to be reliable; however, Trade Nation does not warrant its completeness or accuracy. All market prices and market data contained in or attached to this communication are indicative and subject to change without notice.
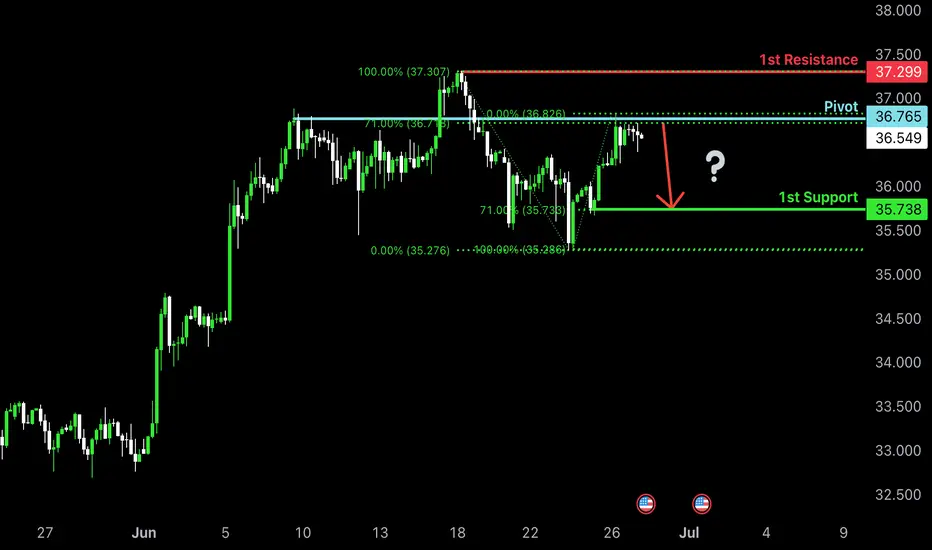
XAGUSD | 26.06.2025SELL 36.6000 | STOP 37.0000 | TAKE 36.2000 | Probable downward price movement in the local structure of the upper range near the level of 37.0000.
Bearish reversal off pullback resistance?The Silver (XAG/USD) is re4acting off the pivot which has been identified as a pullback resistance and could drop to the 1st suport.
Pivot: 36.76
1st Support: 35.73
1st Resistance: 37.29
Risk Warning:
Trading Forex and CFDs carries a high level of risk to your capital and you should only trade with money you can afford to lose. Trading Forex and CFDs may not be suitable for all investors, so please ensure that you fully understand the risks involved and seek independent advice if necessary.
Disclaimer:
The above opinions given constitute general market commentary, and do not constitute the opinion or advice of IC Markets or any form of personal or investment advice.
Any opinions, news, research, analyses, prices, other information, or links to third-party sites contained on this website are provided on an "as-is" basis, are intended only to be informative, is not an advice nor a recommendation, nor research, or a record of our trading prices, or an offer of, or solicitation for a transaction in any financial instrument and thus should not be treated as such. The information provided does not involve any specific investment objectives, financial situation and needs of any specific person who may receive it. Please be aware, that past performance is not a reliable indicator of future performance and/or results. Past Performance or Forward-looking scenarios based upon the reasonable beliefs of the third-party provider are not a guarantee of future performance. Actual results may differ materially from those anticipated in forward-looking or past performance statements. IC Markets makes no representation or warranty and assumes no liability as to the accuracy or completeness of the information provided, nor any loss arising from any investment based on a recommendation, forecast or any information supplied by any third-party.
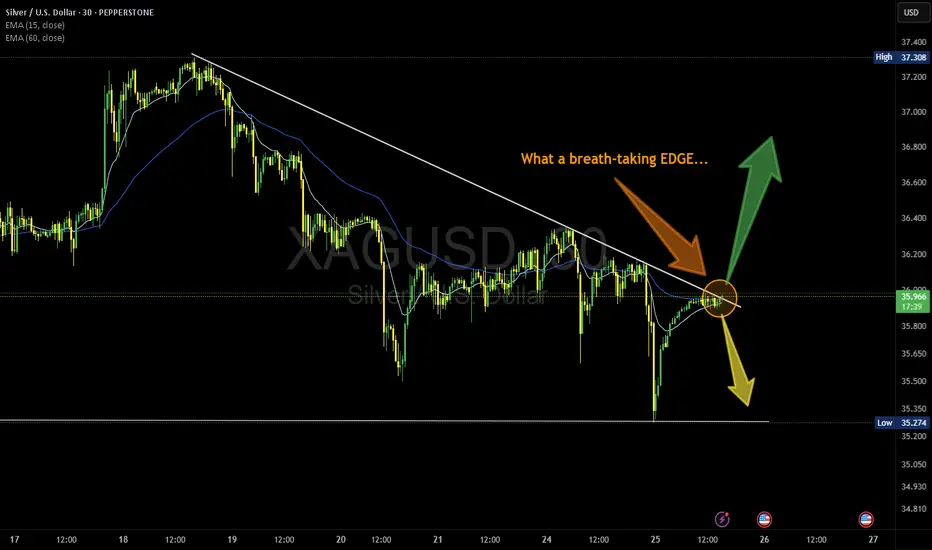
Silver - M30What a breath-taking EDGE...
Wait for confirmation then enter...
Please Manage Your Risk.
#Silver #XAGUSD #Forex #chart #Edge #MJTrading
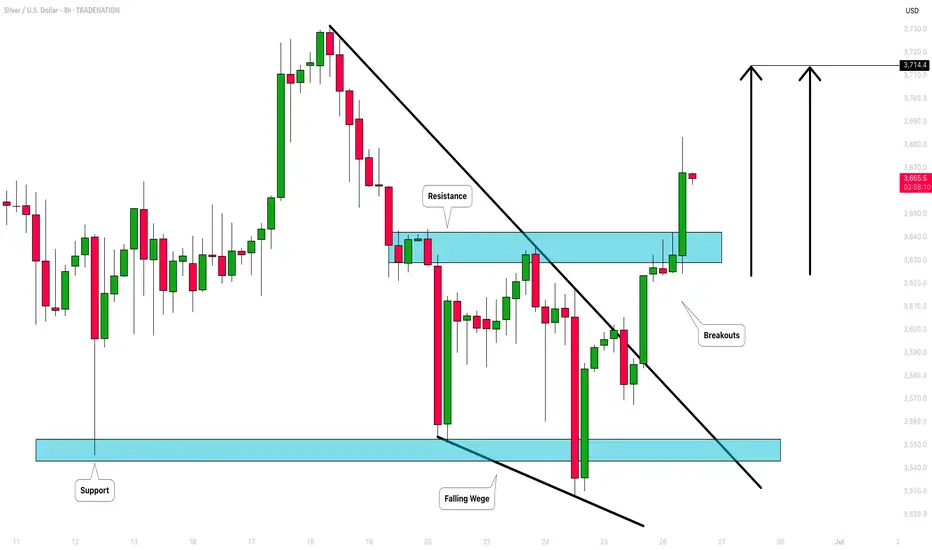
SILVER (XAGUSD): Buyers Show Strength
Silver is going to rise more, following a strong bullish sentiment this morning.
The price violated a strong falling trend line and an intraday horizontal resistance.
These 2 breakouts indicate a strong buying pressure.
The price may grow more today and reach 37.14 level.
❤️Please, support my work with like, thank you!❤️
I am part of Trade Nation's Influencer program and receive a monthly fee for using their TradingView charts in my analysis.
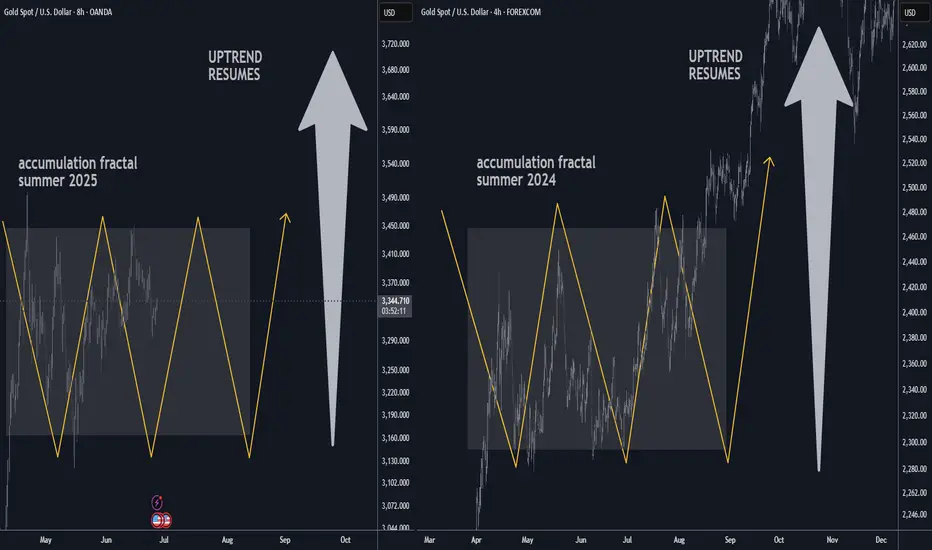
GOLD H4 Accumulation Fractal Target is 4 000 USD 🏆 Gold Market Mid-Term Update
📉 Gold Pullback: XAU/USD drifted below $3,350, falling to around $3,325–$3,330 amid easing Middle East tensions and a firmer U.S. dollar.
🤝 Ceasefire Effect: De-escalation in Israel-Iran hostilities reduced safe-haven demand, capping gold’s upside.
💵 Fed & USD Dynamics: Fed Chair Powell reaffirmed that policymakers aren’t in a rush to cut rates. A softer dollar provided some support, but intraday USD strength weighed on gold.
📊 Technical Watch: Gold remains in a bearish short-term structure below the 200-period SMA. Resistance lies near $3,368–$3,370; support cluster begins around $3,300, with potential slide to $3,245–$3,200 if broken.
🔮 Forecast Updates:
• Citi Research flagged that gold may have peaked and could undergo further softening in Q3-2025.
• WSJ notes gold posting weekly gains, with futures steadying at $3,339/oz.
• Another WSJ report suggests potential for new highs later this year—forecasting an average of $3,210/oz in 2025, a 35% increase.
⚠️ Market Split: Opinions are fragmented—Wall Street sees mixed short-term direction, while Main Street maintains a bullish stance ahead of key U.S. data (GDP, PCE, jobless claims).
🏠 Central Bank Demand: Sustained demand from central banks reinforces gold’s structural support.
🔮 Live Price Snapshot: Futures are up ~0.2%, trading at $3,339.20/oz today.
📊 Technical Outlook Update
🏆 Bull Market Overview
▪️ A pullback is currently unfolding
▪️ Heavy resistance seen at $3,500
▪️ Possible re-accumulation underway
▪️ Scenario mirrors summer 2024
▪️ Accumulation before breakout
▪️ Downside protected around $3,150
▪️ Short-term range trading in progress
▪️ Bulls maintain strategic upper hand
⭐️ Recommended Strategy
▪️ Buy dips within the range
▪️ Look for entries near $3,150 S/R zone
▪️ Long-term bullish target of $4K remains intact
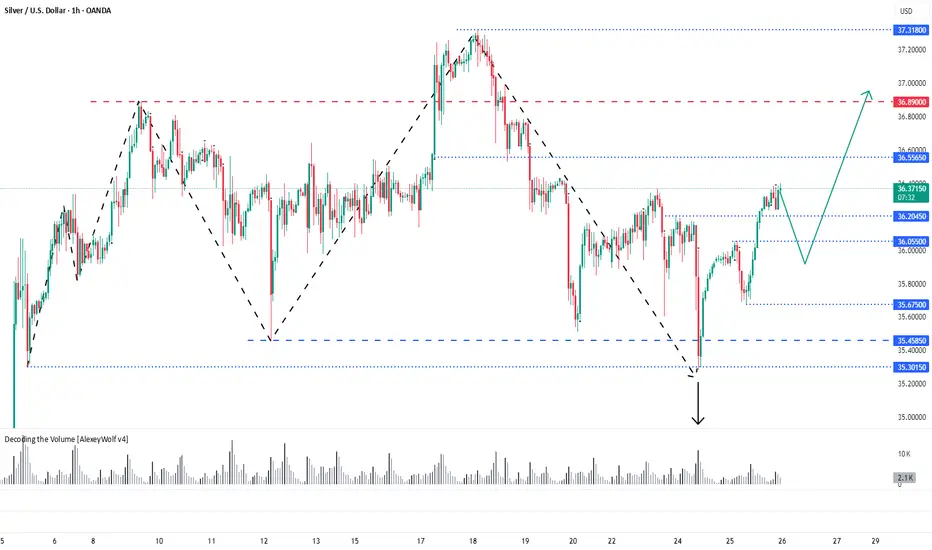
Silver - overview with Initiative AnalysisHey traders and investors!
Hourly Timeframe
📍 Context
The hourly chart is in a sideways range.
Currently, the buyer has the initiative, potential target 36.55.
📊 Key Actions
The 35.30 level on the hourly timeframe has worked well. This level marks the correction extreme within the dominant buyer initiative (i.e., an initiative where the correction is less than 50%).
A seller attack bar (IKC) targeting the lower boundary of the sideways range was absorbed by the buyer, and this absorption led to a renewed buyer. Targets visible on the chart - Hourly and daily timeframe: 36.55 and 36.89
Daily Timeframe
📍 Context
Currently, the buyer has the initiative, potential target 36.89.
📊 Key Actions
On the daily timeframe, there was also a seller IKC bar attacking the lower boundary of the buyer's initiative, which was bought back by the buyer.
🎯 Trade Idea
Potential buying patterns can now be monitored at: 36.20, 36.05, 35.67, 35.458
With targets set at: 36.55, 36.89, 37.32.
This analysis is based on the Initiative Analysis concept (IA).
Wishing you profitable trades!
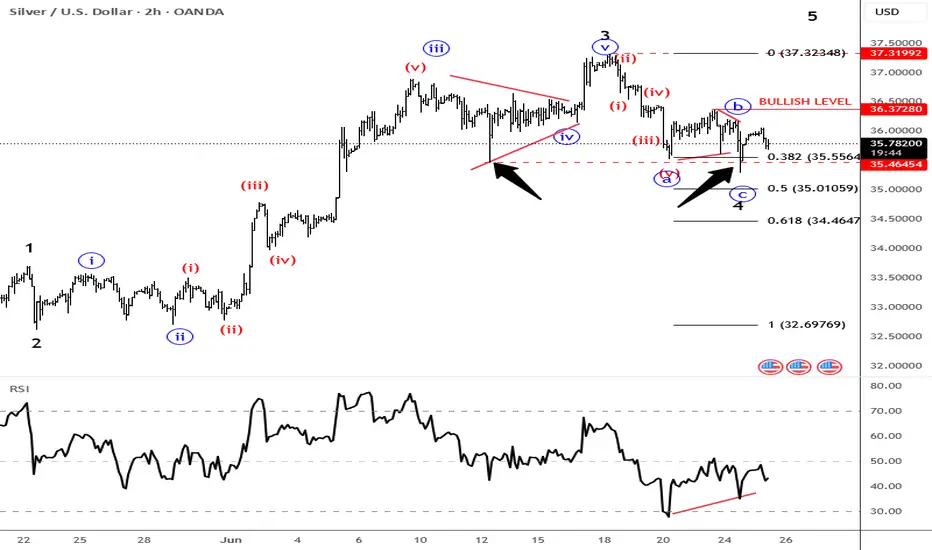
Silver Looking For A Support Of wave 4 at 36.37Silver retested the lows of the week and even broke slightly below the spike from June 12, where the market previously found support at 35.46. We highlighted that as a key area for potential stabilization, especially since there were likely a lot of stops, just below it. So it's no surprise that the market turned around from there and is now trying to stabilize. I’m starting to think the a-b-c drop could already be finished in wave 4.
A daily close above 36.37 would confirm a continuation higher.
We can also see some RSI divergence between waves A and C, which further suggests that silver may be coming down into strong support.
Silver Outperforms Gold, Eyes $36Silver climbed back toward $36, bouncing from over two-week lows on falling Treasury yields and a softer dollar. While the Israel-Iran ceasefire remains shaky, Fed Chair Powell said “many paths are possible,” hinting at a flexible rate stance depending on job market data.
Strong industrial demand and tight supply continue to support silver, which is up nearly 9% in June, far outpacing gold’s modest gains.
Resistance is seen at 37.50, while support holds at 35.40.
Silver Steady at $36 as Rate Cut Bets RiseSilver steadied around $36.10 during the Asian session, paring earlier losses after the geopolitical jolt. While the ceasefire cooled nerves, markets remain alert after Iran’s limited strike on a US base. Fed commentary also weighed in: Bowman and Waller leaned dovish, though Powell’s tone remains cautious ahead of his testimony.
The first resistance is seen at 37.50, while the support starts at 35.40.
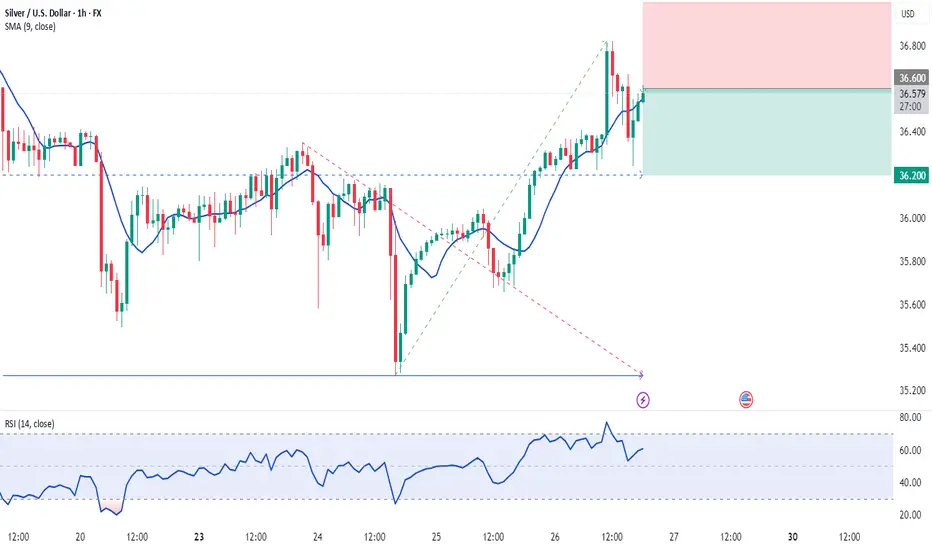
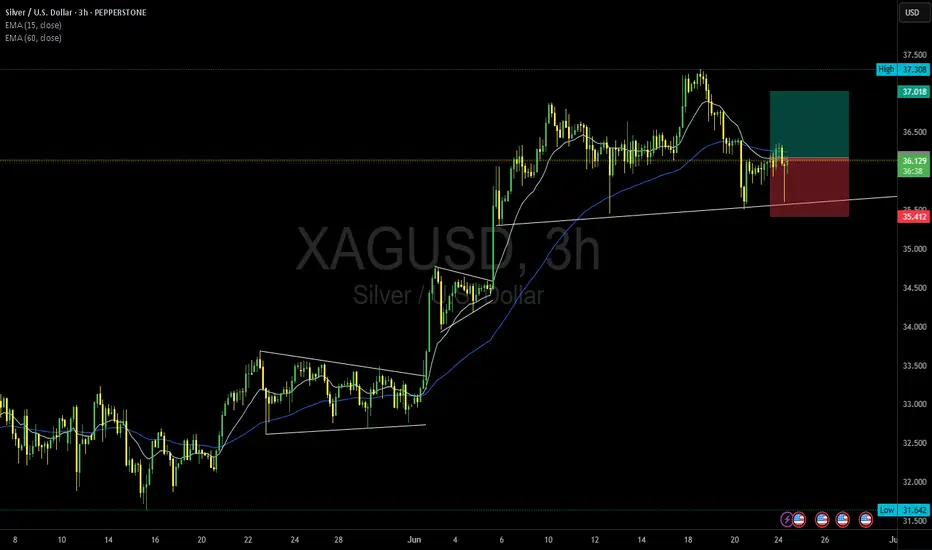
XAGUSD - Buy for RR1XAGUSD – Positioning for a Continuation Push 🚀
Silver's recent structure shows bulls defending the 35.5 region with conviction. After a healthy consolidation, price has reclaimed short-term momentum, eyeing a return to previous highs.
I'm entering long from 36.147, expecting bullish continuation toward the next key resistance level.
Entry: 36.147
Take Profit (TP): 37.0
Stop Loss (SL): 35.4
RR:1
Let’s see how price action unfolds — I’ll be watching closely for momentum confirmation.
#XAGUSD #SILVER #MJTRADING #FOREX #SIGNALS
Safe-Haven Flows Lift Silver Near $36.10Silver (XAG/USD) rose near $36.10 on Monday, snapping a three-day losing streak as rising Middle East tensions increased safe-haven demand. The gain followed US airstrikes on three Iranian nuclear sites Sunday. Iran vowed to respond, while Trump warned any retaliation would be met with greater force.
Escalation risks continue to support silver. Additionally, Fed Governor Waller signaled a possible rate cut as early as July. Dovish Fed comments and lower rates tend to increase silver demand by making it more affordable globally.
The first resistance is seen at 37.50, while the support starts at 35.40.