XAG/USD (Silver) Monthly Analysis – Major Resistance Test Incomi🔍 XAG/USD (Silver) Monthly Analysis – Major Resistance Test Incoming 💥🪙
📊 Overview:
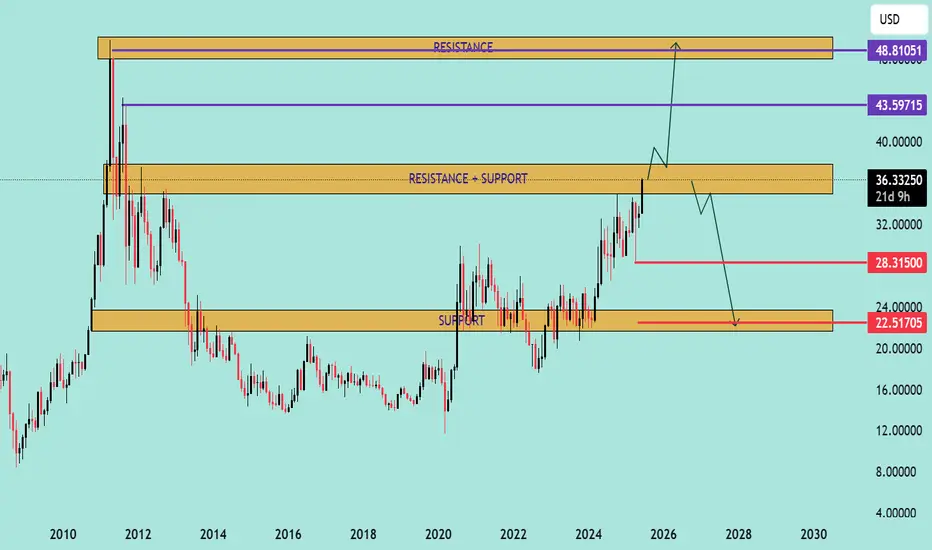
This monthly chart of XAG/USD (Silver vs. US Dollar) reveals a critical technical juncture, where price action is testing a multi-year resistance-turned-support zone around $36.27. The chart is structured with major zones of support and resistance, and it includes a potential bullish extension followed by a bearish correction scenario.
📌 Key Technical Levels:
🟧 Support Zone: $22.50 – $24.00
🟨 Resistance-Turned-Support Zone: $34.00 – $36.50
🟪 Major Resistance: $43.60 – $48.80
🔼 Bullish Scenario (Preferred Path):
Current Price: ~$36.27 is at the upper edge of a crucial S/R flip zone.
📈 A breakout above this zone could propel silver toward the next resistance target at $43.60, with a potential full extension to $48.80.
✨ Momentum and historical breakout behavior from this region suggest strong buying interest if breached convincingly.
🔽 Bearish Scenario (Rejection Path):
🔄 If silver faces rejection at the $36.27 zone, it may retrace towards:
🟥 $28.31 minor support (intermediate target),
🔻 followed by a deeper correction to the $22.50–$24.00 support zone.
🔁 This would complete a classic retest of broken support, allowing accumulation before any further long-term rally.
🧠 Strategic Notes:
⚠️ Macro-driven: Silver is highly sensitive to inflation, Fed policy, and industrial demand.
📅 Long-term chart suggests cyclical behavior, with consolidation phases followed by aggressive trends.
📌 Traders should monitor weekly closes around $36.27 to confirm breakout or rejection.
✅ Conclusion:
Silver is at a make-or-break zone 🧨. A breakout may lead to a multi-year high, but failure here opens the door for a healthy pullback. The next few candles will be decisive for long-term positioning.
📉 Watch for rejection wicks at resistance
📈 Monitor volume on breakout attempts
📊 Plan for both outcomes: breakout or retest
Xagusdanalizi
XAG/USD Rejection Looming at Key Resistance – Bearish Reversal 🔍 Chart Analysis – XAG/USD
1. Trend & EMAs:
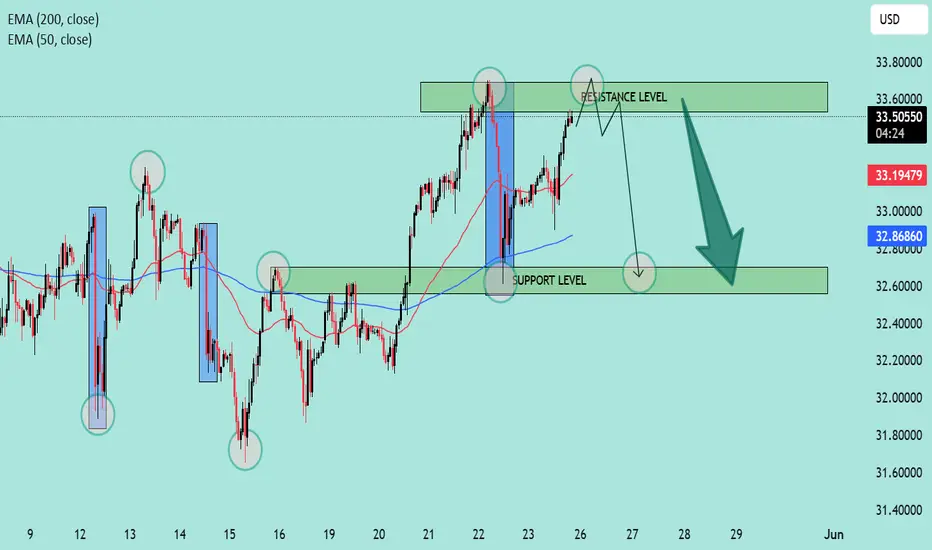
The chart shows two key exponential moving averages:
📈 EMA 50 (Red): 33.1940
📉 EMA 200 (Blue): 32.8684
Price is currently above both EMAs, indicating a short-term bullish trend, but a possible bearish rejection is forming near resistance.
2. Key Zones:
🟥 Resistance Zone: 33.45 – 33.60
Price has repeatedly tested this zone and reversed, suggesting strong selling pressure.
Multiple wicks into this zone show buyer exhaustion.
🟩 Support Zone: 32.60 – 32.85
Strong demand observed here with consistent bounces.
The EMA 200 also aligns with this support, reinforcing its strength.
3. Price Behavior & Pattern:
🧱 Repetitive Bearish Drops: Marked by blue rectangles, suggesting a pattern of sharp sell-offs after touching resistance.
🔁 Potential Double Top Pattern forming near the resistance zone, a classic bearish reversal signal.
🧭 The projected path suggests:
A short-term retest of the resistance.
Followed by a pullback toward the support zone around 32.60.
Breakdown below support could open further downside potential.
📌 Summary:
⚠️ Short-Term Outlook: Bearish bias if resistance holds.
📍 Key Level to Watch: 33.60 (breakout) and 32.60 (breakdown).
🔄 Trade Plan:
Consider short entries near 33.45–33.60 resistance zone with stops above 33.65.
Target around 32.65–32.60 support zone.
📊 Indicators in Play:
EMA confluence supports trend analysis.
Price structure and rejection patterns suggest likely mean reversion to support.
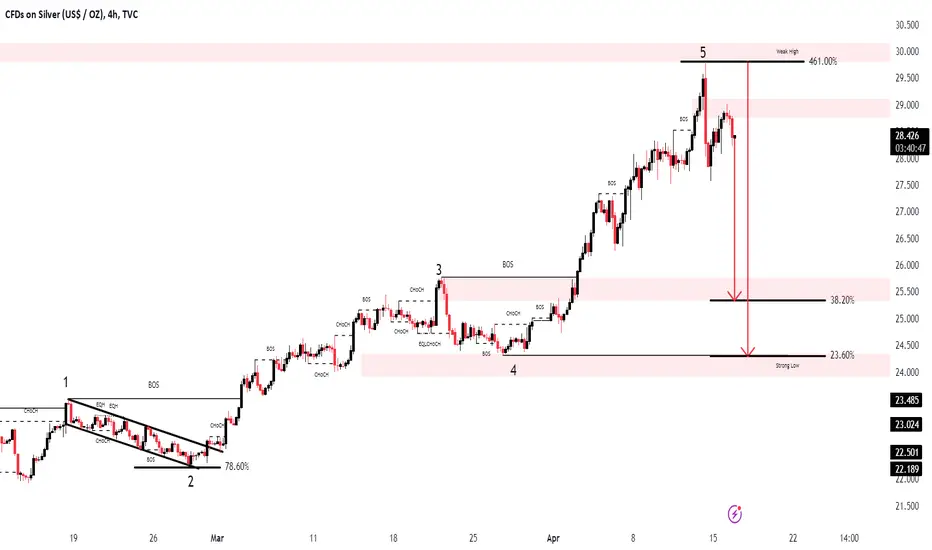
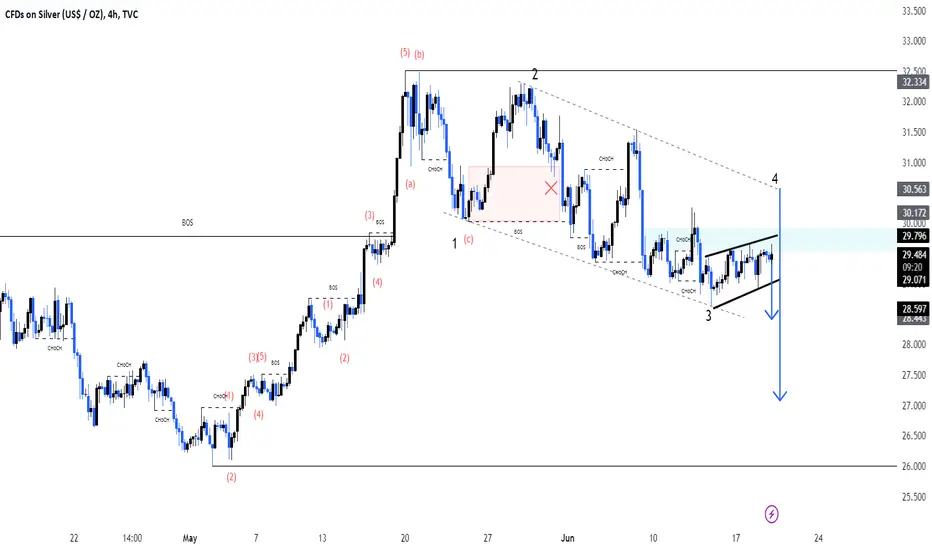
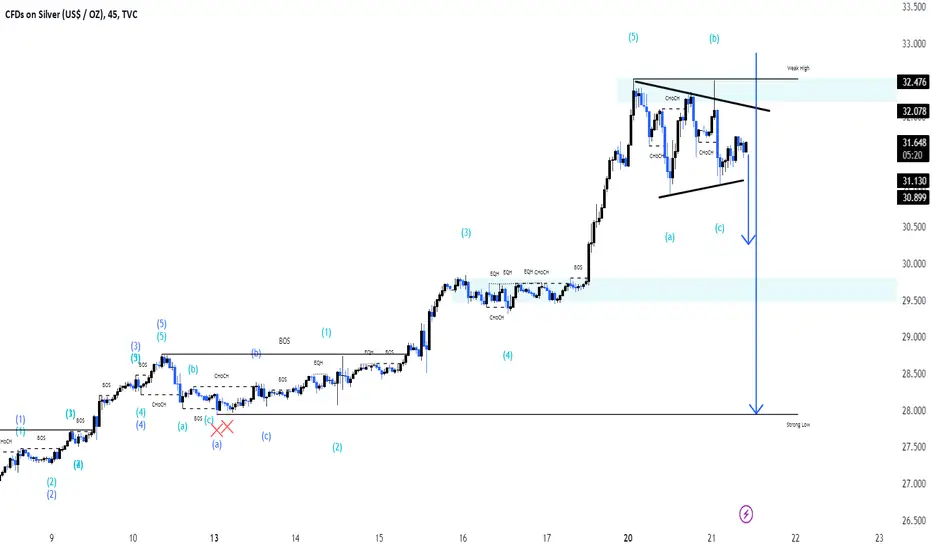
SilverXAGUSD ( Silver / U.S Dollar )
Completed " 12345 " Impulsive Waves
Break of Structure
RSI - Divergence
Change of Characteristics
Bearish Channel as an Corrective Pattern in Short Time Frame

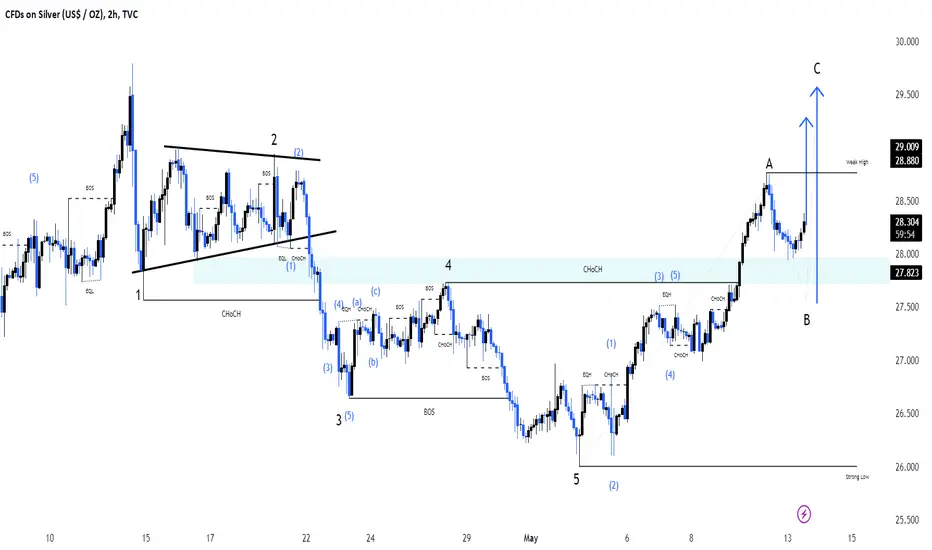
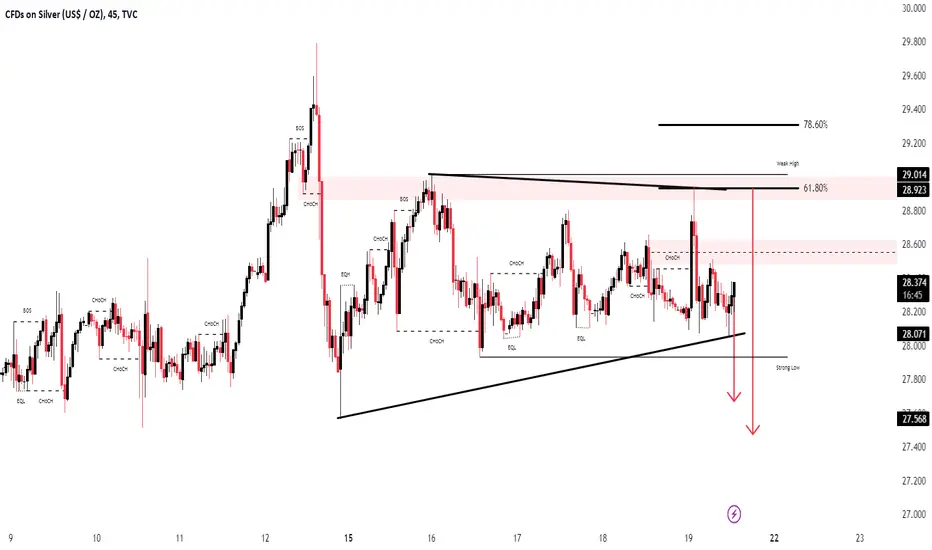
XAGUSDPair : XAGUSD ( Silver / U.S Dollar )
Description :
Completed " 1234 " Impulsive Waves
Break of Structure
Fibonacci Level - 61.80% / 78.60%
RSI - Divergence
Bullish Channel as an Corrective pattern in Short Time Frame
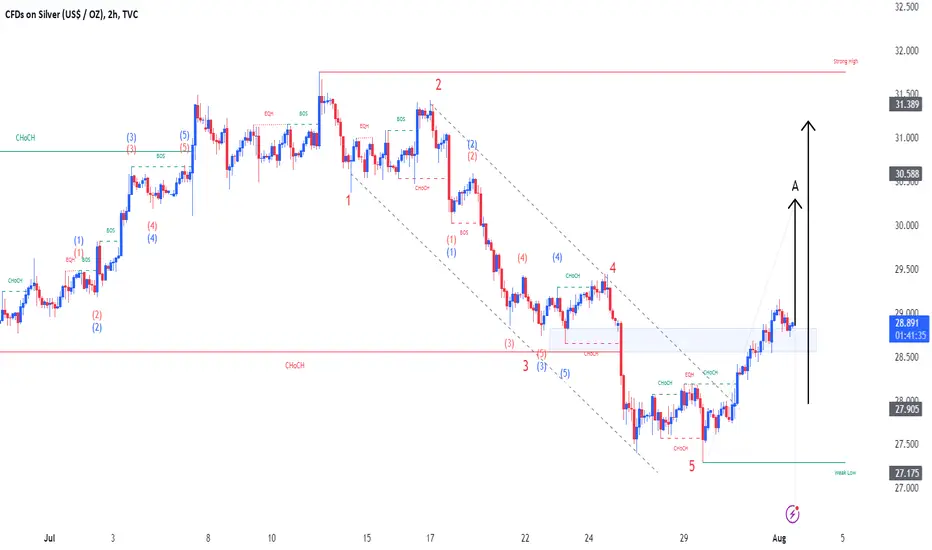
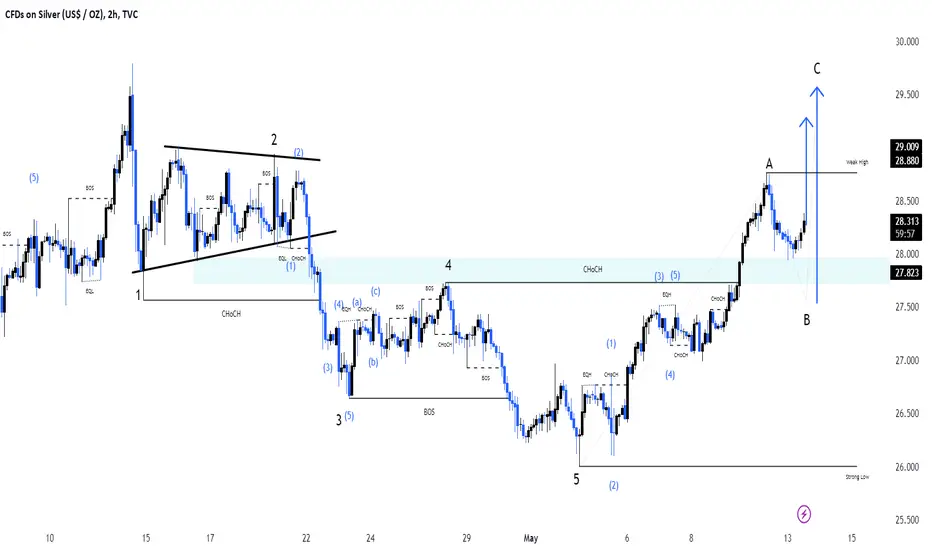
XAGUSDPair : XAGUSD ( Silver / U.S Dollar )
Description :
Completed " 12345 " Impulsive Waves and " ABC " Corrective Waves
Break of Structure
RSI - Divergence
Demand Zone
Fibonacci Level - 61.80%
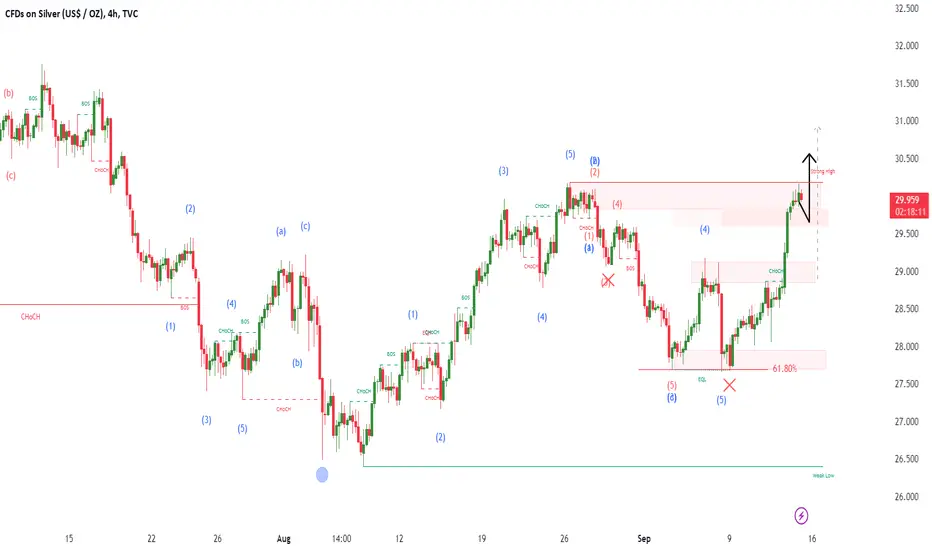
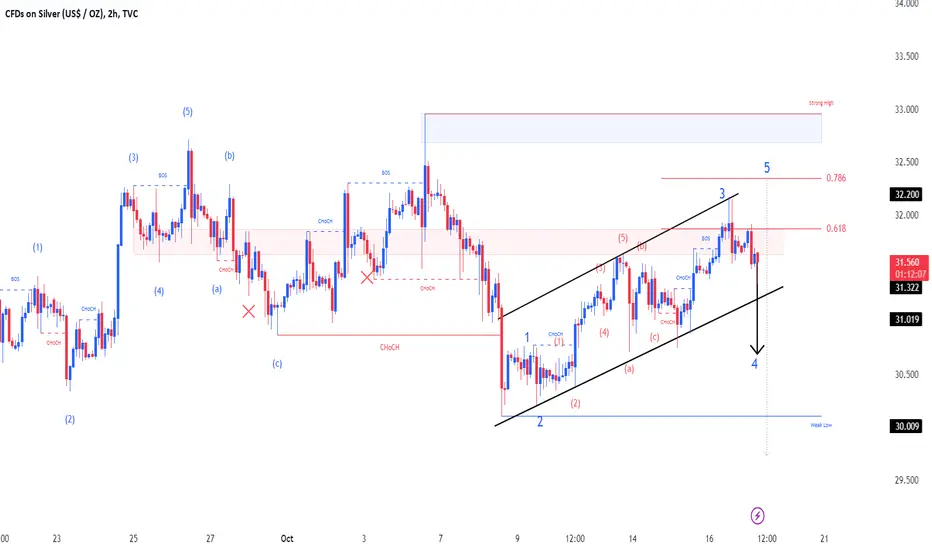
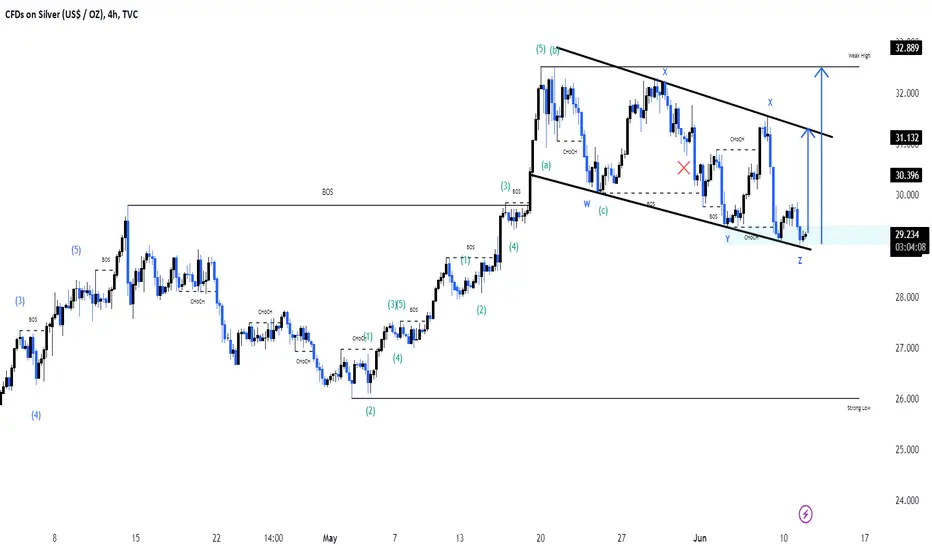
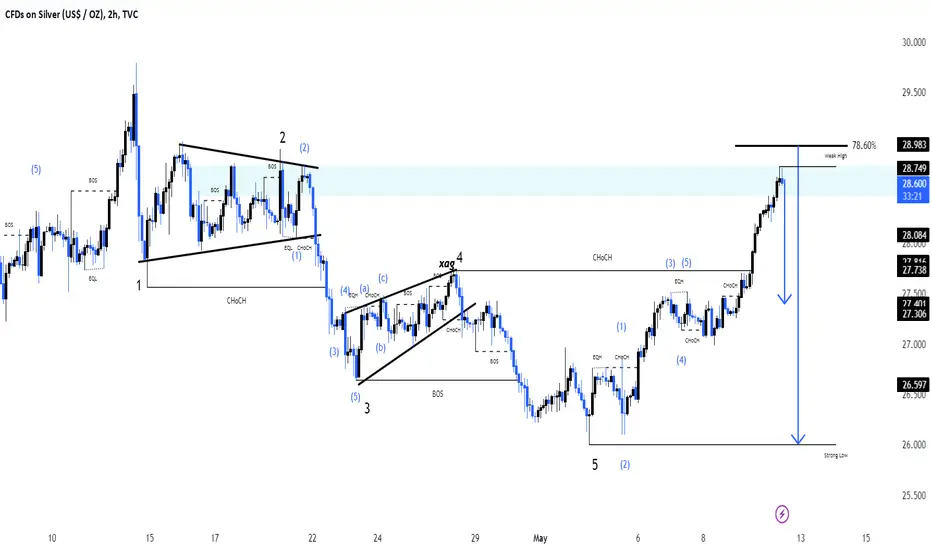
SilverPair : XAGUSD ( Silver / U.S Dollar )
Description :
Completed " 12345 " Impulsive Waves and " A - wxyx " Corrective Waves
Break of Structure
CHoCH
Bullish Channel as an Corrective Pattern in Short Time Frame
RSI - Divergence

XAGUSD/SILVER 1H Sell Limit ProjectionHowever, the fading of some positive triggers, such as near-term Fed rate cut bets and a pause in the central bank's buying, negatively impacted precious metal prices, including silver. As a result, silver prices have dropped 10.53% in the last nine sessions.

XAGUSDPair : XAGUSD ( Silver / U.S Dollar )
Description :
Bullish Channel as an Corrective Pattern in Short Time Frame
Completed " 12345 " Impulsive Waves
Break of Structure and Retracement
CHoCH
Bearish Channel as Correction in Long Time Frame with the Breakout of Upper Trend Line
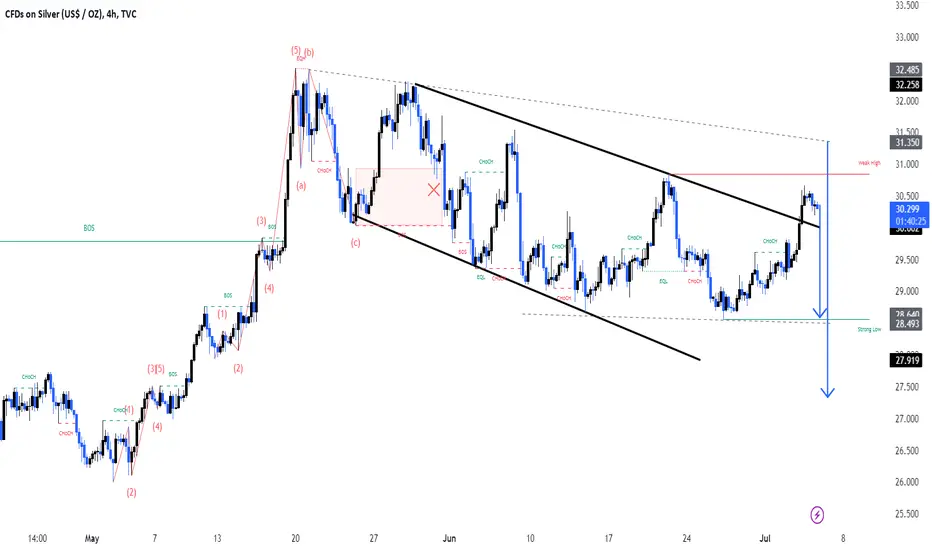
XAGUSDPair : XAGUSD ( Silver / U.S Dollar )
Description :
Completed " 12345 " Impulsive Waves
RSI - Divergence
Break of Structure and Retracement
Resistance Level
Bearish Channel as an Corrective Pattern in Short Time Frame
XAGUSDPair : XAGUSD ( Silver / U.S Dollar )
Description :
Impulse Correction
Break of Structure
Completed " 12345 " Impulsive Waves and " ABC " Corrective Waves
RSI - Divergence
Bearish Channel as an Corrective Pattern in Short Time Frame

XAGUSDPair : XAGUSD ( Silver / U.S Dollar )
Description :
Impulse Correction
Break of Structure
Completed " 12345 " Impulsive Waves and " ABC " Corrective Waves
RSI - Divergence
Bearish Channel as an Corrective Pattern in Short Time Frame
XAGUSDPair : XAGUSD ( Silver / U.S Dollar )
Description :
Completed " 12345 " Impulsive Waves
Break of Structure
RSI - Divergence
Bullish Channel as an Corrective Pattern in Short Time Frame
S / R Level
XAGUSD Pair : XAGUSD ( Silver / U.S Dollar )
Description :
Bearish Channel as an Corrective Pattern in Short Frame
RSI - Divergence
Break of Structure
Completed " 1234 " Impulsive Waves
S / R Level
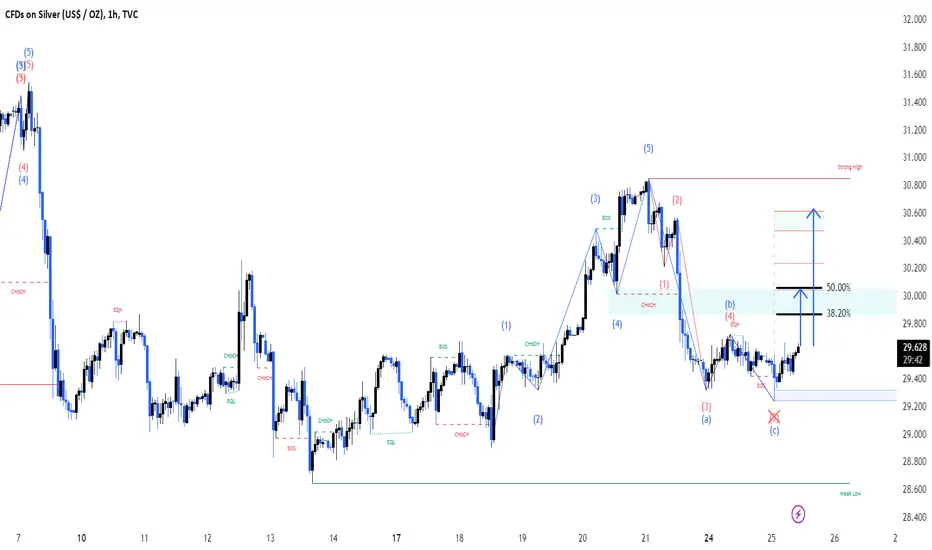
XAGUSDPair : XAGUSD ( Silver / U.S Dollar )
Description :
Falling Wedge as an Corrective Pattern in Short Time Frame and Rejection from Lower Trend Line
Break of Structure
RSI - Divergence
Demand Zone
Fibonacci Level - 50.00%
SilverPair : XAGUSD ( Silver / U.S Dollar )
Description :
Bearish Channel as an Corrective Pattern in Short Time Frame
RSI - Divergence
Break of Structure
Completed " 12345 " Impulsive Waves
Resistance Level

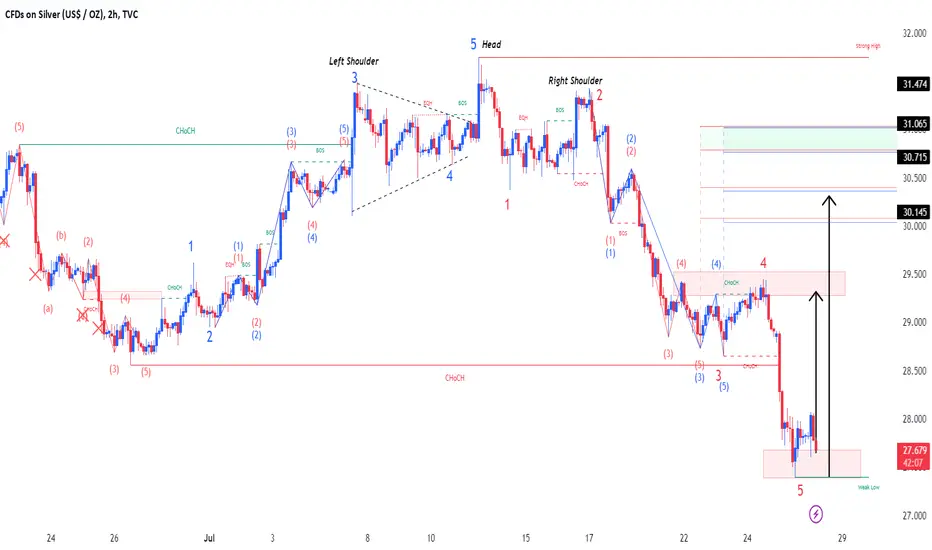
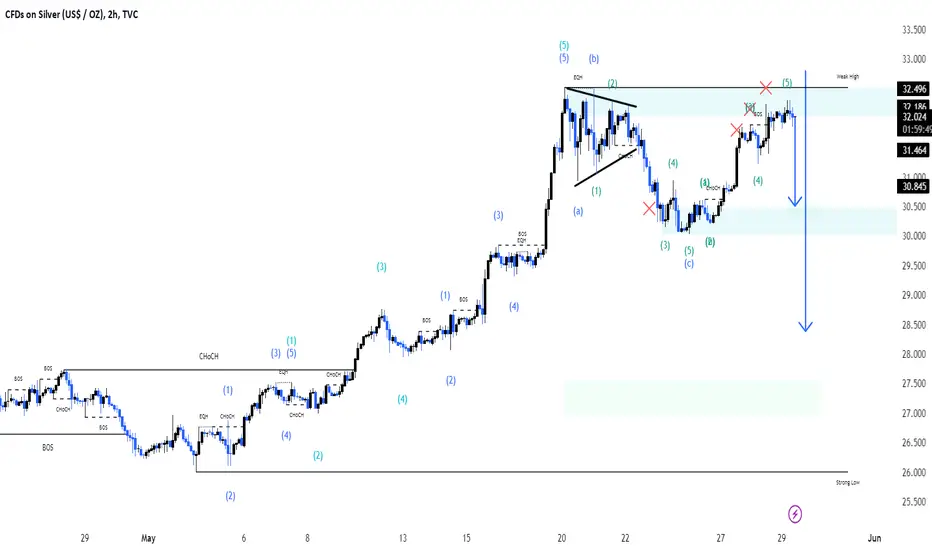
XAGUSDPair : XAGUSD ( Silver / U.S Dollar )
Description :
Double Top as an Corrective Pattern in Short Time Frame
Resistance Level
Break of Structure
RSI - Divergence
Completed " 12345 " Impulsive Waves
XAGUSDPair : XAGUSD ( Silver / U.S Dollar )
Description :
Completed " 12345 " Impulsive Waves
Break of Structure
RSI - Divergence
Bullish Channel as an Corrective Pattern in Short Time Frame
Consolidation Phase
XAGUSDPair : XAGUSD ( Silver / U.S Dollar )
Description :
Completed " 12345 " Impulsive Waves and " AB " Corrective Waves
Break of Structure
RSI - Divergence
Fibonacci Level - 78.60%
Demand Zone
XAGUSDPair : XAGUSD ( Silver / U.S Dollar )
Description :
Completed " 12345 " Impulsive Waves and " AB " Corrective Waves
Break of Structure
RSI - Divergence
Fibonacci Level - 78.60%
Demand Zone
XAGUSDPair : XAGUSD ( Silver / U.S Dollar )
Description :
Completed " 12345 " Impulsive Waves and " A " Corrective Waves
RSI - Divergence
Break of Structure
Fibonacci Level - 78.60%
Resistance Level
XAGUSDPair : XAGUSD ( Silver / U.S Dollar )
Description :
Bullish Channel as an Corrective Pattern in Short Time Frame
Break of Structure and Retracement
RSI - Divergence
Consolidation Phase
Completed " 1234 " Impulsive Waves

XAGUSD Pair : XAGUSD ( Silver / U.S Dollar )
Description :
Symmetrical Triangle as an Corrective Pattern in Short Time Frame
Break of Structure
RSI - Divergence
Fibonacci Level - 61.80%
Impulse Correction
XAGUSDPair : XAGUSD ( Silver / U.S Dollar )
Description :
Completed Impulsive Waves " 12345 "
Rising Wedge as an Corrective Pattern in Short Time Frame
Rejection from Resistance
Break of Structure and Retracement
Fibonacci Level - 461.8