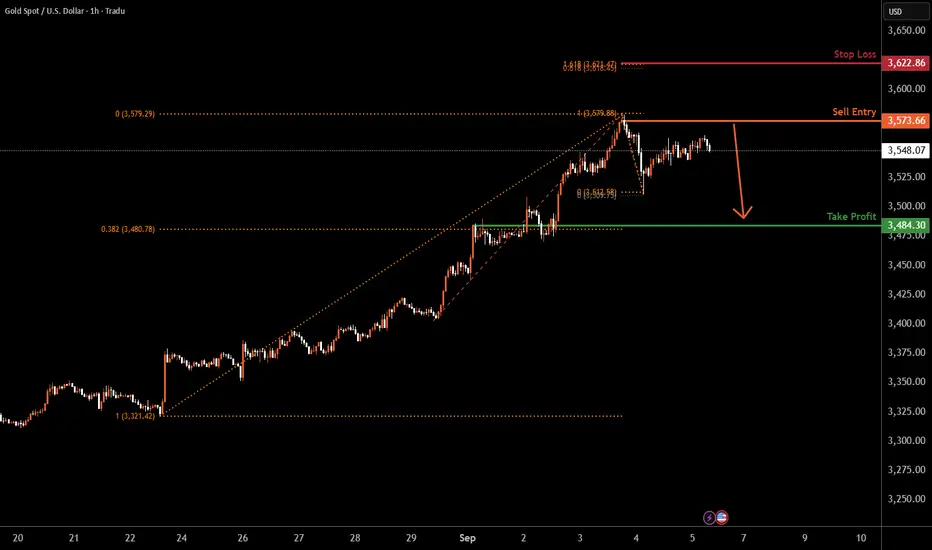
GOLD H1 | Bearish reversal off swing high resistanceBased on the H1 chart analysis, we could see the price rise to the sell entry at 3,573.66, which is a pullback resistance and could reverse from this level to the downside.
Stop loss is at 3,573.66, which is a swing high resistance.
Take profit is at 3,484.30, which is a pullback support that lines up with the 38.2% Fibonacci retracement.
High Risk Investment Warning
Trading Forex/CFDs on margin carries a high level of risk and may not be suitable for all investors. Leverage can work against you.
Stratos Markets Limited (tradu.com ):
CFDs are complex instruments and come with a high risk of losing money rapidly due to leverage. 65% of retail investor accounts lose money when trading CFDs with this provider. You should consider whether you understand how CFDs work and whether you can afford to take the high risk of losing your money.
Stratos Europe Ltd (tradu.com ):
CFDs are complex instruments and come with a high risk of losing money rapidly due to leverage. 66% of retail investor accounts lose money when trading CFDs with this provider. You should consider whether you understand how CFDs work and whether you can afford to take the high risk of losing your money.
Stratos Global LLC (tradu.com ):
Losses can exceed deposits.
Please be advised that the information presented on TradingView is provided to Tradu (‘Company’, ‘we’) by a third-party provider (‘TFA Global Pte Ltd’). Please be reminded that you are solely responsible for the trading decisions on your account. There is a very high degree of risk involved in trading. Any information and/or content is intended entirely for research, educational and informational purposes only and does not constitute investment or consultation advice or investment strategy. The information is not tailored to the investment needs of any specific person and therefore does not involve a consideration of any of the investment objectives, financial situation or needs of any viewer that may receive it. Kindly also note that past performance is not a reliable indicator of future results. Actual results may differ materially from those anticipated in forward-looking or past performance statements. We assume no liability as to the accuracy or completeness of any of the information and/or content provided herein and the Company cannot be held responsible for any omission, mistake nor for any loss or damage including without limitation to any loss of profit which may arise from reliance on any information supplied by TFA Global Pte Ltd.
The speaker(s) is neither an employee, agent nor representative of Tradu and is therefore acting independently. The opinions given are their own, constitute general market commentary, and do not constitute the opinion or advice of Tradu or any form of personal or investment advice. Tradu neither endorses nor guarantees offerings of third-party speakers, nor is Tradu responsible for the content, veracity or opinions of third-party speakers, presenters or participants.
Xau-usd
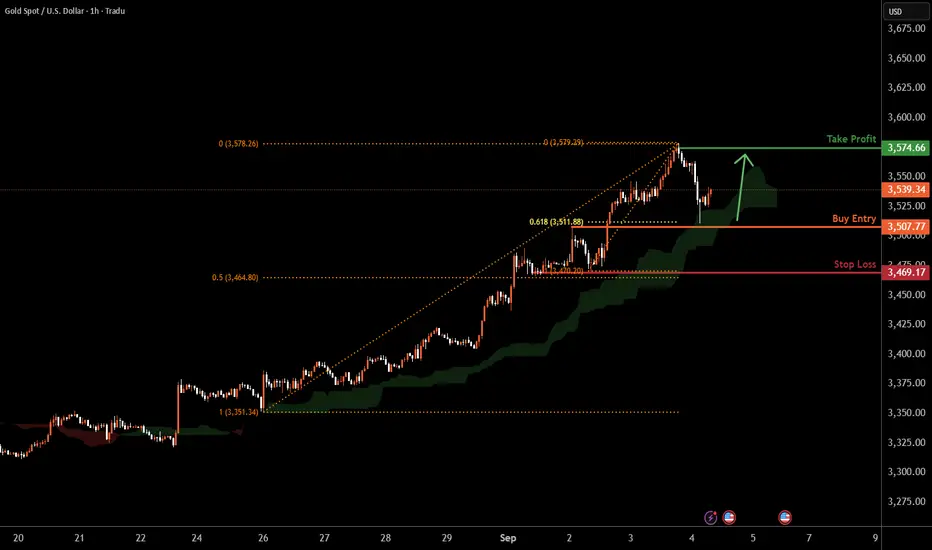
XAUUSD H1 | Bullish continuationThe Gold (XAU/USD) is falling towards the buy entry which is a pullback support that aligns with the 61.8% Fibonacci retracement and could bounce from this level to the take profit.
Buy entry is at 3,507.77, which is a pullback support that lines up with the 61.8% Fibonacci retracement.
Stop loss is at 3,469.17, whichis a pullback support that aligns with the 50% Fibnacci retracement.
Tak eprofit is at 3,574.66, whichis a swing high reisstance.
High Risk Investment Warning
Trading Forex/CFDs on margin carries a high level of risk and may not be suitable for all investors. Leverage can work against you.
Stratos Markets Limited (tradu.com ):
CFDs are complex instruments and come with a high risk of losing money rapidly due to leverage. 65% of retail investor accounts lose money when trading CFDs with this provider. You should consider whether you understand how CFDs work and whether you can afford to take the high risk of losing your money.
Stratos Europe Ltd (tradu.com ):
CFDs are complex instruments and come with a high risk of losing money rapidly due to leverage. 66% of retail investor accounts lose money when trading CFDs with this provider. You should consider whether you understand how CFDs work and whether you can afford to take the high risk of losing your money.
Stratos Global LLC (tradu.com ):
Losses can exceed deposits.
Please be advised that the information presented on TradingView is provided to Tradu (‘Company’, ‘we’) by a third-party provider (‘TFA Global Pte Ltd’). Please be reminded that you are solely responsible for the trading decisions on your account. There is a very high degree of risk involved in trading. Any information and/or content is intended entirely for research, educational and informational purposes only and does not constitute investment or consultation advice or investment strategy. The information is not tailored to the investment needs of any specific person and therefore does not involve a consideration of any of the investment objectives, financial situation or needs of any viewer that may receive it. Kindly also note that past performance is not a reliable indicator of future results. Actual results may differ materially from those anticipated in forward-looking or past performance statements. We assume no liability as to the accuracy or completeness of any of the information and/or content provided herein and the Company cannot be held responsible for any omission, mistake nor for any loss or damage including without limitation to any loss of profit which may arise from reliance on any information supplied by TFA Global Pte Ltd.
The speaker(s) is neither an employee, agent nor representative of Tradu and is therefore acting independently. The opinions given are their own, constitute general market commentary, and do not constitute the opinion or advice of Tradu or any form of personal or investment advice. Tradu neither endorses nor guarantees offerings of third-party speakers, nor is Tradu responsible for the content, veracity or opinions of third-party speakers, presenters or participants.
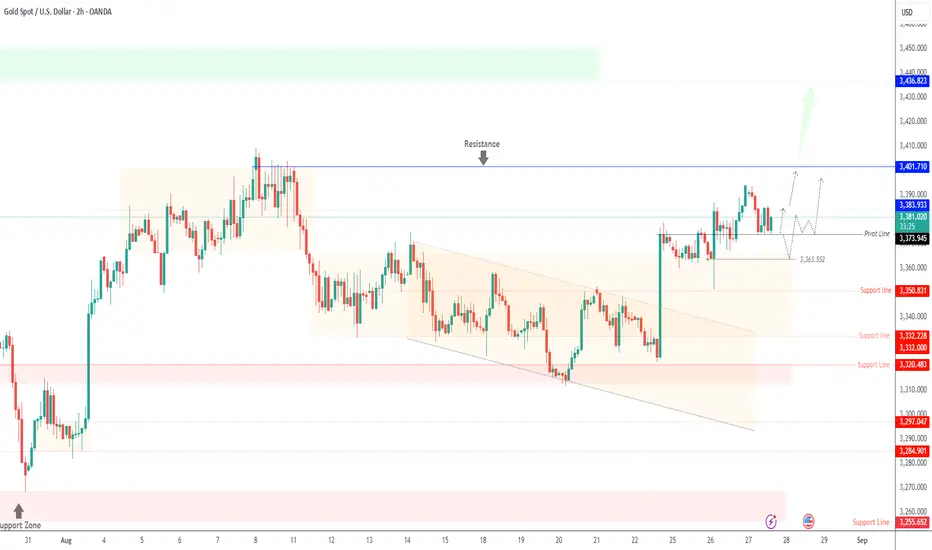
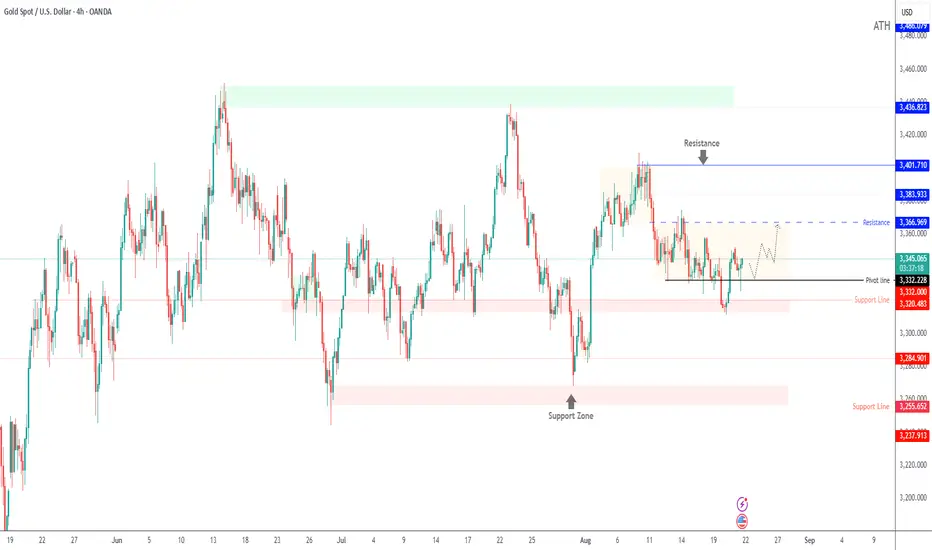
XAUUSD Holds Above Pivot — Bulls Target $3,401 NextGold – Live Update
Bullish Trend Holds Above Pivot
Gold reached our projected target around 3,392 as mentioned in the previous idea.
Currently, the price is trading above the 3,374 pivot line, maintaining bullish momentum.
🔹 Technical Outlook
✅ As long as price holds above 3,374, the bullish trend should continue toward 3,384 → 3,401 → 3,412.
⚠️ A move below 3,374 would trigger a correction to 3,363, with deeper downside toward 3,350.
🔹 Key Levels
Pivot: 3,374
Resistance: 3,384 – 3,401 – 3,412
Support: 3,363 – 3,350
✅ Summary:
Gold continues to respect bullish momentum above the pivot. Watch 3,374 as the decision zone — holding above favors continuation higher, while a break below shifts focus to 3,363 and 3,350.
previous idea:
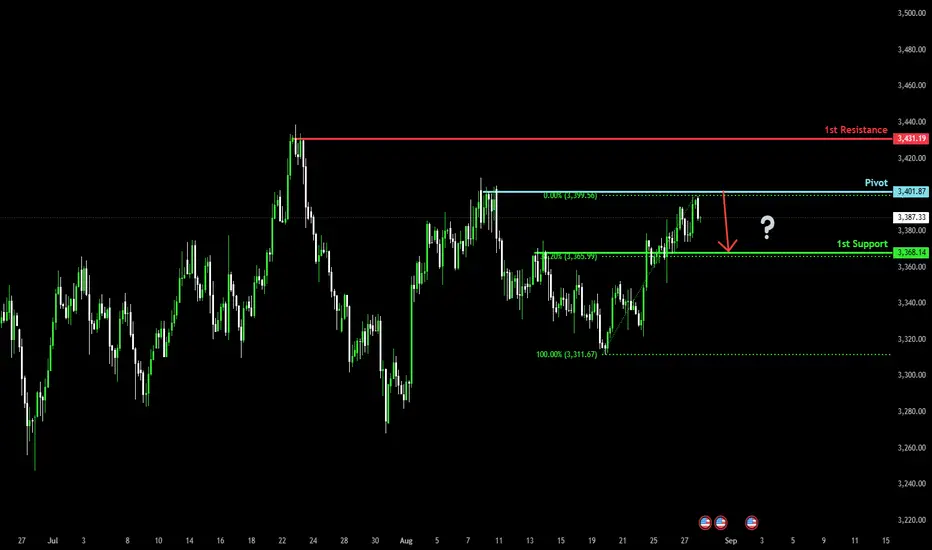
Could the Gold drop from here?The price has rejected off the pivot which is a swing high resistance and could drop to the 1st support.
Pivot: 3,41.87
1st Support: 3,368.14
1st Resistance: 3,431.19
Risk Warning:
Trading Forex and CFDs carries a high level of risk to your capital and you should only trade with money you can afford to lose. Trading Forex and CFDs may not be suitable for all investors, so please ensure that you fully understand the risks involved and seek independent advice if necessary.
Disclaimer:
The above opinions given constitute general market commentary, and do not constitute the opinion or advice of IC Markets or any form of personal or investment advice.
Any opinions, news, research, analyses, prices, other information, or links to third-party sites contained on this website are provided on an "as-is" basis, are intended only to be informative, is not an advice nor a recommendation, nor research, or a record of our trading prices, or an offer of, or solicitation for a transaction in any financial instrument and thus should not be treated as such. The information provided does not involve any specific investment objectives, financial situation and needs of any specific person who may receive it. Please be aware, that past performance is not a reliable indicator of future performance and/or results. Past Performance or Forward-looking scenarios based upon the reasonable beliefs of the third-party provider are not a guarantee of future performance. Actual results may differ materially from those anticipated in forward-looking or past performance statements. IC Markets makes no representation or warranty and assumes no liability as to the accuracy or completeness of the information provided, nor any loss arising from any investment based on a recommendation, forecast or any information supplied by any third-party.
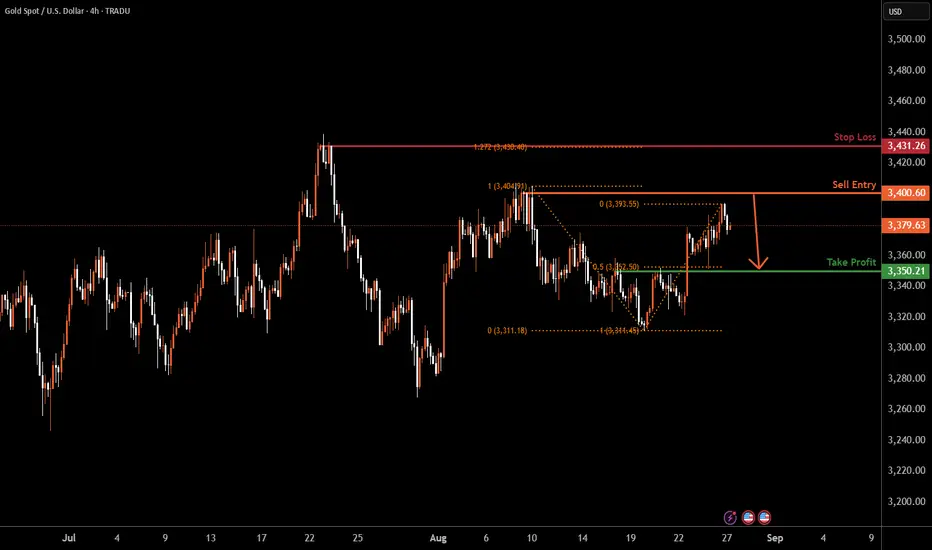
GOLD H4 | earish Reversal Setup at Swing High ResistanceBased on the H4 chart analysis, we could see the price rise to the sell entry at 3,400.60, which is a swing high resistance and could reverse from this level to the downside.
Stop loss is at 3,431.26, which is a swing high resistance that aligns with the 127.2% Fibonacci extension.
Take profit is at 3,350.21, which is a pullback support that lines up with the 50% FIbonacci retracment.
High Risk Investment Warning
Trading Forex/CFDs on margin carries a high level of risk and may not be suitable for all investors. Leverage can work against you.
Stratos Markets Limited (tradu.com ):
CFDs are complex instruments and come with a high risk of losing money rapidly due to leverage. 65% of retail investor accounts lose money when trading CFDs with this provider. You should consider whether you understand how CFDs work and whether you can afford to take the high risk of losing your money.
Stratos Europe Ltd (tradu.com ):
CFDs are complex instruments and come with a high risk of losing money rapidly due to leverage. 66% of retail investor accounts lose money when trading CFDs with this provider. You should consider whether you understand how CFDs work and whether you can afford to take the high risk of losing your money.
Stratos Global LLC (tradu.com ):
Losses can exceed deposits.
Please be advised that the information presented on TradingView is provided to Tradu (‘Company’, ‘we’) by a third-party provider (‘TFA Global Pte Ltd’). Please be reminded that you are solely responsible for the trading decisions on your account. There is a very high degree of risk involved in trading. Any information and/or content is intended entirely for research, educational and informational purposes only and does not constitute investment or consultation advice or investment strategy. The information is not tailored to the investment needs of any specific person and therefore does not involve a consideration of any of the investment objectives, financial situation or needs of any viewer that may receive it. Kindly also note that past performance is not a reliable indicator of future results. Actual results may differ materially from those anticipated in forward-looking or past performance statements. We assume no liability as to the accuracy or completeness of any of the information and/or content provided herein and the Company cannot be held responsible for any omission, mistake nor for any loss or damage including without limitation to any loss of profit which may arise from reliance on any information supplied by TFA Global Pte Ltd.
The speaker(s) is neither an employee, agent nor representative of Tradu and is therefore acting independently. The opinions given are their own, constitute general market commentary, and do not constitute the opinion or advice of Tradu or any form of personal or investment advice. Tradu neither endorses nor guarantees offerings of third-party speakers, nor is Tradu responsible for the content, veracity or opinions of third-party speakers, presenters or participants.
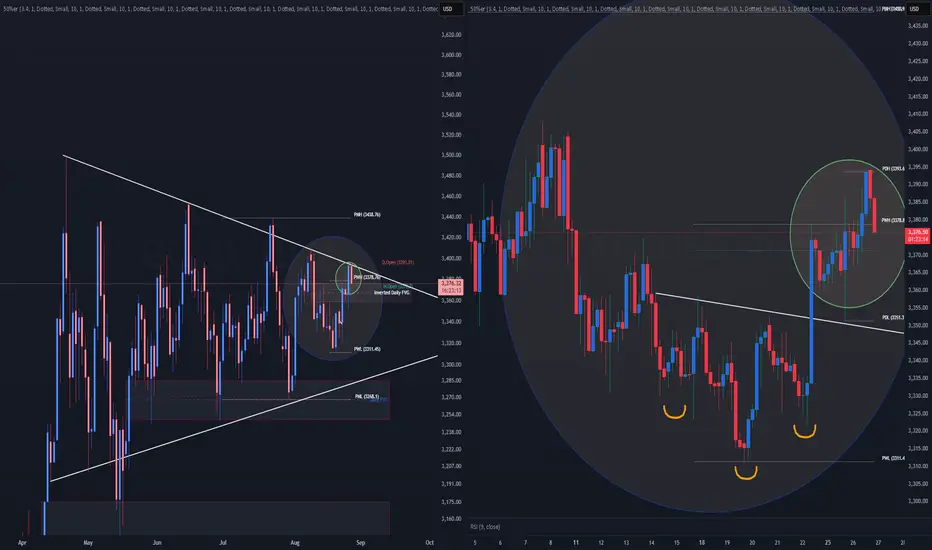
XAUUSD - Daily and 4hr | Charts are bullish Daily:
Gold is back in the upper range of this consolidation zone. You can see the high of the range is 3440, and the low is 3250 roughly.
Gold is clearly making a bullish pennant pattern. When gold reached the top trend line, we expected a breakout. Once again, we are finding resistance. (as of now)
4-Hour
Inverted Head and Shoulders - Simple trading
Gold broke out of an inverted head and shoulders pattern and just hit the target at 3395. Gold is now finding resistance and failing to find support.
Bulls:
Gold is pulling back into an Inverted FVG on the Daily. If the price is bullish, then we should reject the gap with ease. (Gap is from 3360-3376) Gold is on the brink of a daily breakout or another rejection back down to support.
Bears:
If Gold continues to fall with clean displacement through support. We can say the news from last week was false, and gold is still trending bearish. expect a fall back down to 3320
Gold Supported by Rate-Cut Expectations, Data in SpotlightGold (XAUUSD) – Overview
Supported by Fed Cut Bets and Softer Data Outlook
Gold remains well-supported as futures markets are now pricing in two 25bps Fed rate cuts by December. Fed Chair Jerome Powell has signaled rising risks to the labor market, even amid elevated inflation, suggesting the Fed may need to adjust its restrictive stance.
This dovish bias continues to weigh on U.S. Treasury yields and supports gold. The upcoming U.S. GDP growth and PCE inflation data will be critical — softer readings could reinforce expectations of rate cuts and push gold higher.
🔹 Technical Outlook
Gold is attempting to stabilize in the bullish zone.
Stability above 3,366 keeps the upside open toward 3,383 and 3,401.
If price stabilizes below 3,366, a correction toward 3,357 – 3,350 is likely.
A confirmed break below 3,350 would shift bias bearish and expose deeper levels.
🔹 Key Levels
Resistance: 3,383 – 3,401
Support: 3,357 – 3,350 – 3,343
✅ Summary:
Gold is consolidating near its pivot with Fed policy expectations providing a bullish backdrop. Holding above 3,366 favors further upside, while a break below 3,350 would signal weakness and invite a deeper correction.
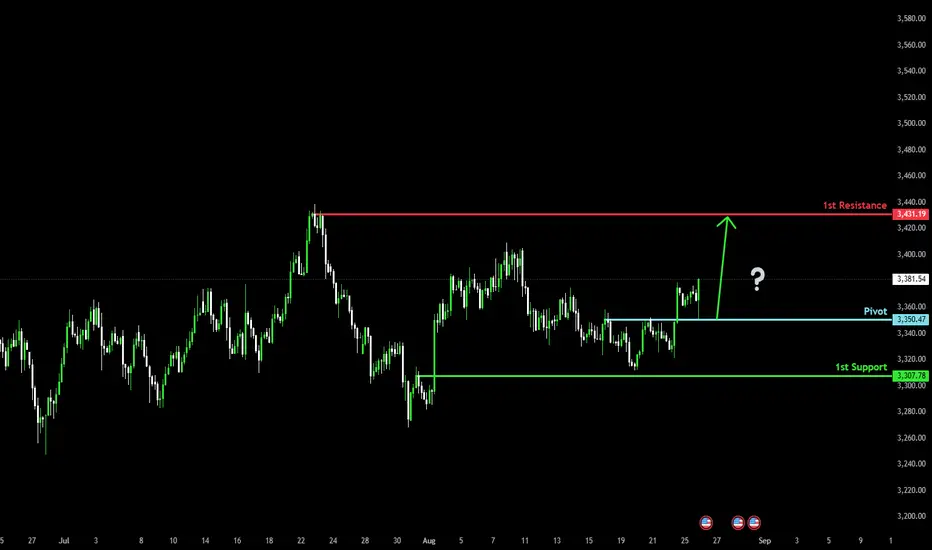
Bullish bounce off?The Gold (XAU?USD) has bounced off the pivot, which has been identified as a pullback support and could potentially rise to the swing high resistance.
Pivot: 3,350.47
1st Support: 3,307.78
1st Resistance: 3,431.19
Risk Warning:
Trading Forex and CFDs carries a high level of risk to your capital and you should only trade with money you can afford to lose. Trading Forex and CFDs may not be suitable for all investors, so please ensure that you fully understand the risks involved and seek independent advice if necessary.
Disclaimer:
The above opinions given constitute general market commentary, and do not constitute the opinion or advice of IC Markets or any form of personal or investment advice.
Any opinions, news, research, analyses, prices, other information, or links to third-party sites contained on this website are provided on an "as-is" basis, are intended only to be informative, is not an advice nor a recommendation, nor research, or a record of our trading prices, or an offer of, or solicitation for a transaction in any financial instrument and thus should not be treated as such. The information provided does not involve any specific investment objectives, financial situation and needs of any specific person who may receive it. Please be aware, that past performance is not a reliable indicator of future performance and/or results. Past Performance or Forward-looking scenarios based upon the reasonable beliefs of the third-party provider are not a guarantee of future performance. Actual results may differ materially from those anticipated in forward-looking or past performance statements. IC Markets makes no representation or warranty and assumes no liability as to the accuracy or completeness of the information provided, nor any loss arising from any investment based on a recommendation, forecast or any information supplied by any third-party.
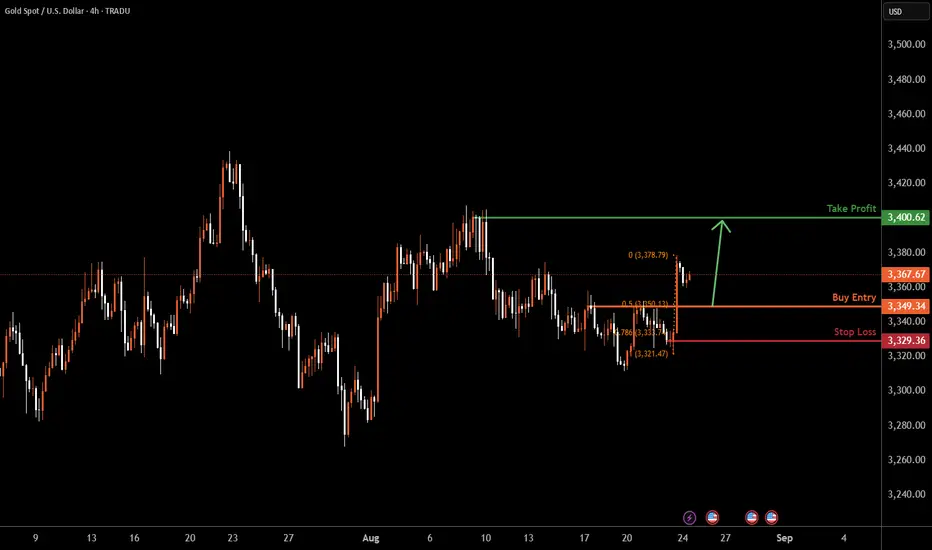
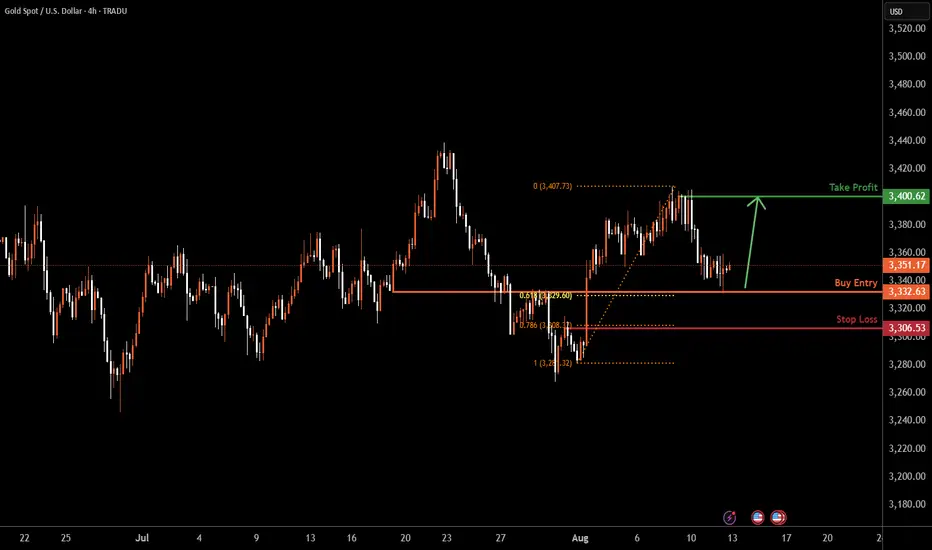
GOLD H4 | Bullish bounceXAU/USD is falling towards the buy entry at 3,349.35, which is a pullback support that aligns with the 50% Fibonacci retracement and could bounce from this level to the upside.
Stop loss is at 3,329.36, which is a pullback support.
Take profit is at 3,400.62, which is a swing high resistance.
High Risk Investment Warning
Trading Forex/CFDs on margin carries a high level of risk and may not be suitable for all investors. Leverage can work against you.
Stratos Markets Limited (tradu.com ):
CFDs are complex instruments and come with a high risk of losing money rapidly due to leverage. 65% of retail investor accounts lose money when trading CFDs with this provider. You should consider whether you understand how CFDs work and whether you can afford to take the high risk of losing your money.
Stratos Europe Ltd (tradu.com ):
CFDs are complex instruments and come with a high risk of losing money rapidly due to leverage. 66% of retail investor accounts lose money when trading CFDs with this provider. You should consider whether you understand how CFDs work and whether you can afford to take the high risk of losing your money.
Stratos Global LLC (tradu.com ):
Losses can exceed deposits.
Please be advised that the information presented on TradingView is provided to Tradu (‘Company’, ‘we’) by a third-party provider (‘TFA Global Pte Ltd’). Please be reminded that you are solely responsible for the trading decisions on your account. There is a very high degree of risk involved in trading. Any information and/or content is intended entirely for research, educational and informational purposes only and does not constitute investment or consultation advice or investment strategy. The information is not tailored to the investment needs of any specific person and therefore does not involve a consideration of any of the investment objectives, financial situation or needs of any viewer that may receive it. Kindly also note that past performance is not a reliable indicator of future results. Actual results may differ materially from those anticipated in forward-looking or past performance statements. We assume no liability as to the accuracy or completeness of any of the information and/or content provided herein and the Company cannot be held responsible for any omission, mistake nor for any loss or damage including without limitation to any loss of profit which may arise from reliance on any information supplied by TFA Global Pte Ltd.
The speaker(s) is neither an employee, agent nor representative of Tradu and is therefore acting independently. The opinions given are their own, constitute general market commentary, and do not constitute the opinion or advice of Tradu or any form of personal or investment advice. Tradu neither endorses nor guarantees offerings of third
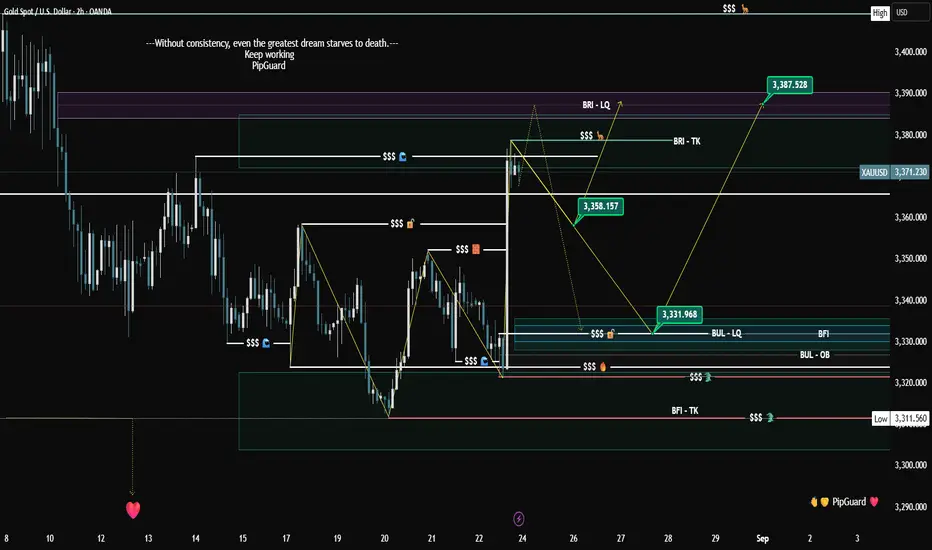
GOLD IN THE CROSSHAIRS WITH PIPGUARDGOLD IN THE CROSSHAIRS WITH PIPGUARD
Hello there, my colleagues, welcome back!
👉 From today on, I will always use this layout. If you like it, let me know by leaving a boost and a comment with your opinion!
ANALYSIS
Hello everyone, my colleagues, how are you? I hope all is well. I hope it was a great summer for all of you, that you enjoyed your days off and holidays, and that you spent time with family and friends ❤️.
Let's pick up where we left off and see what the markets are telling us. I'll start again with gold: a peculiar summer, made of stalls, endless sideways movements, and a lot of uncertainty basically like a tired marriage.
After Friday's weekly close, the price decided to shoot up over 400 pips and close beautifully above $3,370.
So what happens on Monday? Two options:
A sideways phase, the usual liquidity war where the little guys always get screwed.
A clean retracement, with two interesting points: 3,360 (the closest) and 3,330 (the nastier one, and I admit... the one I like the most).
The key level is 3,365 : now support, but if it breaks, it becomes resistance, worse than your boss coming back from vacation pissed off. Second support at 3,325/20.
I'm waiting for a nice retracement to re-enter long at a decent price. But one thing is for sure: the bullish target is 3,385 .
NEWS
✅ Powell continues to work his magic: the Fed kept selling smoke and mirrors about rate cuts and inflation. The result? The dollar remains strong, and gold is just watching.
✅ Central banks are gobbling up gold like there's no tomorrow: they are on track to buy over 1,000 tons in 2025. Four years in a row like this, not even a junkie on methadone.
✅ 95% of reserve managers plan to increase their gold holdings: practically everyone. When even the white-collars decide they want more gold, you know the carousel is about to start.
SECRETS
Here come the real gems, the ones that stink of shady deals and under-the-table agreements:
🔓 The "Mar-a-Lago Accord": according to a Fed analysis, there's an $863 billion gap between the book and real value of US gold. And the Treasury is thinking of using it to set up a BTC fund with a million coins, just for kicks.
🔓 95% of reserve managers no longer trust the dollar: everyone is buying gold. Anyone who isn't is an idiot.
GREETINGS
Remember to leave a GREETING 🚀 or a COMMENT
Talk to you soon,
PipGuard
Article published by PipGuard™ on the TradingView® platform
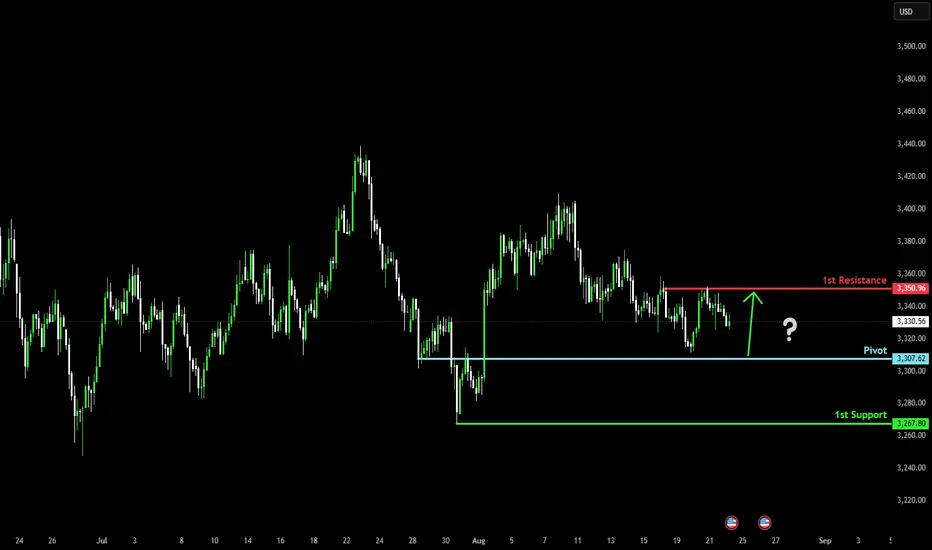
Bullish bounce?The Gold (XAU/USD) is falling towards the pivot and could bounce to the 1st resistance, which acts as a pullback resistance.
Pivot: 3,307.62
1st Support: 3,267.80
1st Resistance: 3,350.96
Risk Warning:
Trading Forex and CFDs carries a high level of risk to your capital and you should only trade with money you can afford to lose. Trading Forex and CFDs may not be suitable for all investors, so please ensure that you fully understand the risks involved and seek independent advice if necessary.
Disclaimer:
The above opinions given constitute general market commentary, and do not constitute the opinion or advice of IC Markets or any form of personal or investment advice.
Any opinions, news, research, analyses, prices, other information, or links to third-party sites contained on this website are provided on an "as-is" basis, are intended only to be informative, is not an advice nor a recommendation, nor research, or a record of our trading prices, or an offer of, or solicitation for a transaction in any financial instrument and thus should not be treated as such. The information provided does not involve any specific investment objectives, financial situation and needs of any specific person who may receive it. Please be aware, that past performance is not a reliable indicator of future performance and/or results. Past Performance or Forward-looking scenarios based upon the reasonable beliefs of the third-party provider are not a guarantee of future performance. Actual results may differ materially from those anticipated in forward-looking or past performance statements. IC Markets makes no representation or warranty and assumes no liability as to the accuracy or completeness of the information provided, nor any loss arising from any investment based on a recommendation, forecast or any information supplied by any third-party.
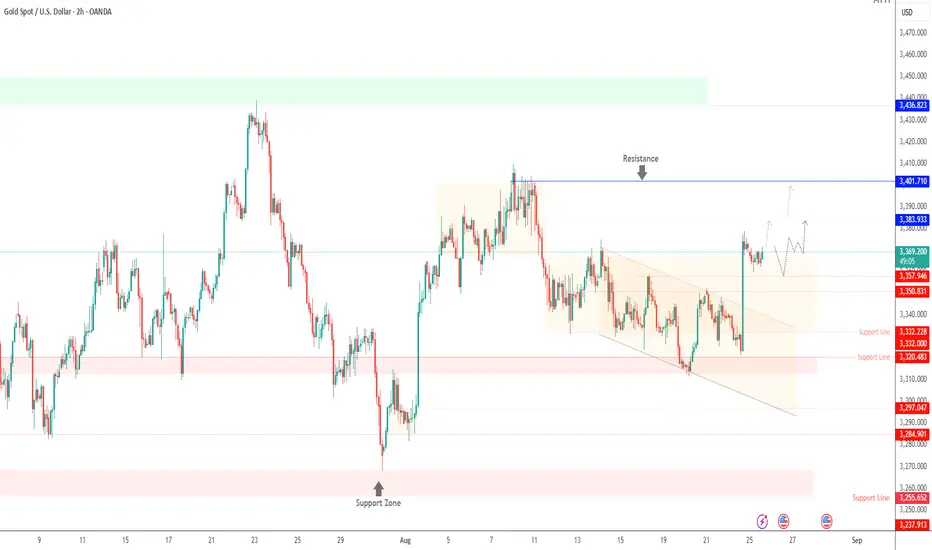
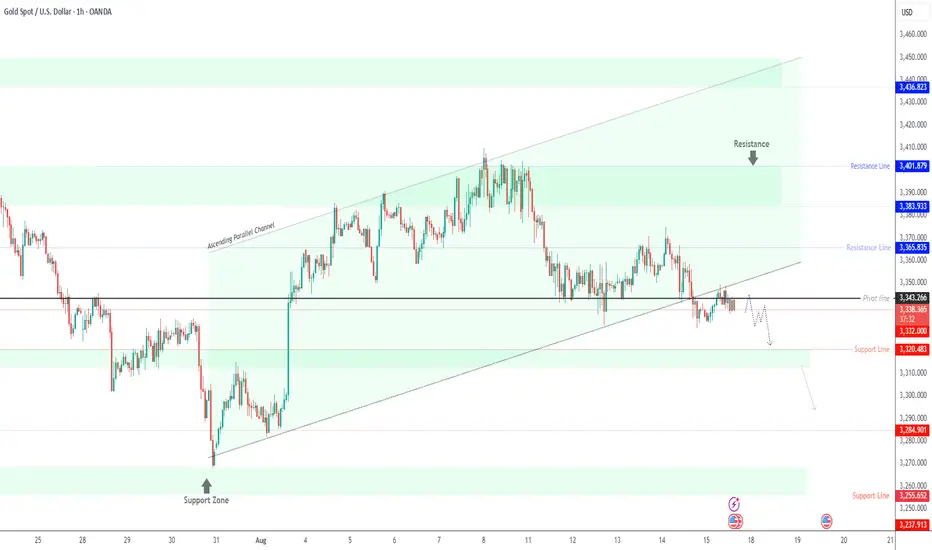
Gold Price Analysis – Dollar Strength vs Safe-Haven DemandGOLD (XAUUSD) – Technical Outlook
A stronger U.S. dollar is weighing on gold, as it makes dollar-denominated commodities more expensive for international buyers and competes with gold’s safe-haven appeal.
Gold is currently trading around 3341, holding just above the pivot zone (3343 / 3332). The market remains in consolidation, awaiting a decisive breakout.
Bullish Scenario:
As long as price trades above 3332, gold may attempt to continue its bullish move. A confirmed 1H close above 3343 would target 3365, with further extensions toward 3383 – 3401.
Bearish Scenario:
A move below 3332 would open the way to 3320, and a confirmed 4H close below 3320 could extend the decline toward 3285.
📍 Key Levels
Pivot: 3343
Support: 3332 – 3320 – 3312
Resistance: 3365 – 3383 – 3401
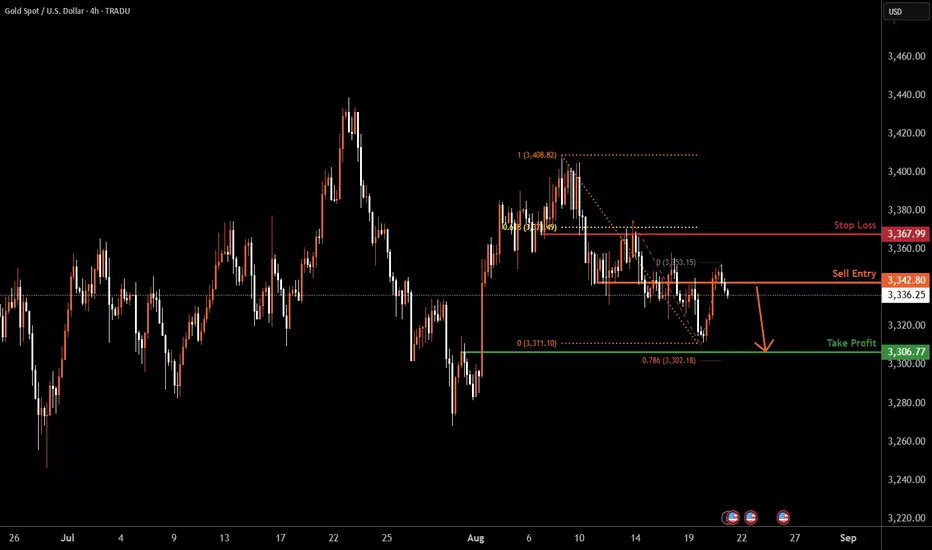
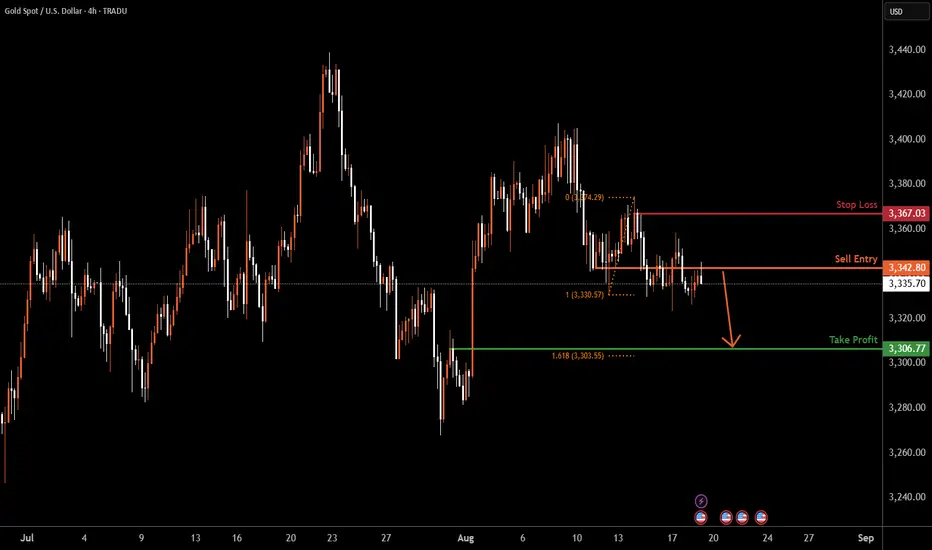
XAUUSD H4 | Bearish drop offThe Gold (XAU/USD) is reacting off the sell entry, which is a pullback resistance and could drop from this level to the downside.
Sell entry is at 3,342.80, which is a pullback resistance.
Stop loss is at 3,367.03, which is a pullback resistance that lines up with the 61.8% Fibonacci retracement.
Take profit is at 3,306.77, which is a pullback support that is slightly above the 78.6% Fibonacci projection.
High Risk Investment Warning
Trading Forex/CFDs on margin carries a high level of risk and may not be suitable for all investors. Leverage can work against you.
Stratos Markets Limited (tradu.com ):
CFDs are complex instruments and come with a high risk of losing money rapidly due to leverage. 65% of retail investor accounts lose money when trading CFDs with this provider. You should consider whether you understand how CFDs work and whether you can afford to take the high risk of losing your money.
Stratos Europe Ltd (tradu.com ):
CFDs are complex instruments and come with a high risk of losing money rapidly due to leverage. 66% of retail investor accounts lose money when trading CFDs with this provider. You should consider whether you understand how CFDs work and whether you can afford to take the high risk of losing your money.
Stratos Global LLC (tradu.com ):
Losses can exceed deposits.
Please be advised that the information presented on TradingView is provided to Tradu (‘Company’, ‘we’) by a third-party provider (‘TFA Global Pte Ltd’). Please be reminded that you are solely responsible for the trading decisions on your account. There is a very high degree of risk involved in trading. Any information and/or content is intended entirely for research, educational and informational purposes only and does not constitute investment or consultation advice or investment strategy. The information is not tailored to the investment needs of any specific person and therefore does not involve a consideration of any of the investment objectives, financial situation or needs of any viewer that may receive it. Kindly also note that past performance is not a reliable indicator of future results. Actual results may differ materially from those anticipated in forward-looking or past performance statements. We assume no liability as to the accuracy or completeness of any of the information and/or content provided herein and the Company cannot be held responsible for any omission, mistake nor for any loss or damage including without limitation to any loss of profit which may arise from reliance on any information supplied by TFA Global Pte Ltd.
The speaker(s) is neither an employee, agent nor representative of Tradu and is therefore acting independently. The opinions given are their own, constitute general market commentary, and do not constitute the opinion or advice of Tradu or any form of personal or investment advice. Tradu neither endorses nor guarantees offerings of third-party speakers, nor is Tradu responsible for the content, veracity or opinions of third-party speakers, presenters or participants.
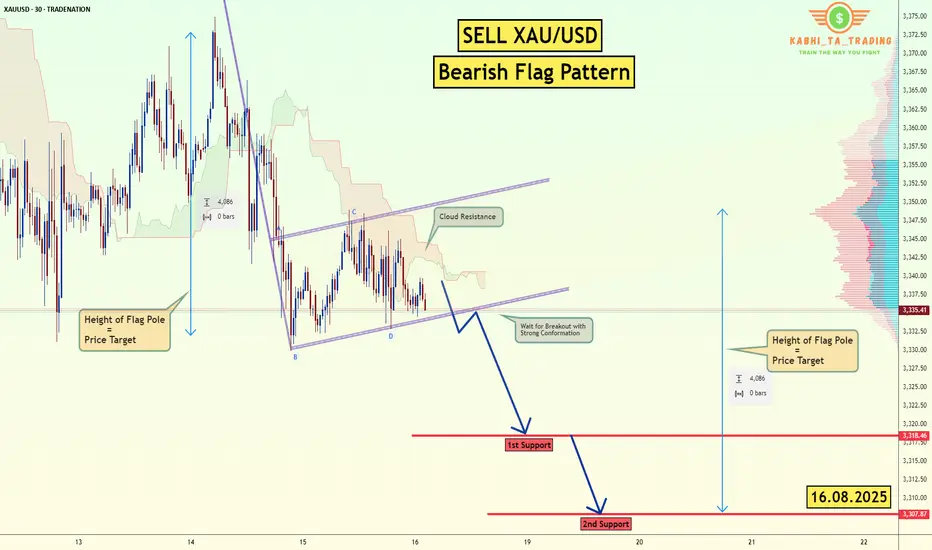
XAU/USD - Bearish Flag Pattern (16.08.2025)The XAU/USD Pair on the M30 timeframe presents a Potential Selling Opportunity due to a recent Formation of a Bearish Flag Pattern. This suggests a shift in momentum towards the downside in the coming hours.
Possible Short Trade:
Entry: Consider Entering A Short Position around Trendline Of The Pattern.
Target Levels:
1st Support – 3318
2nd Support – 3308
🎁 Please hit the like button and
🎁 Leave a comment to support for My Post !
Your likes and comments are incredibly motivating and will encourage me to share more analysis with you.
Best Regards, KABHI_TA_TRADING
Thank you.
Disclosure: I am part of Trade Nation's Influencer program and receive a monthly fee for using their TradingView charts in my analysis.
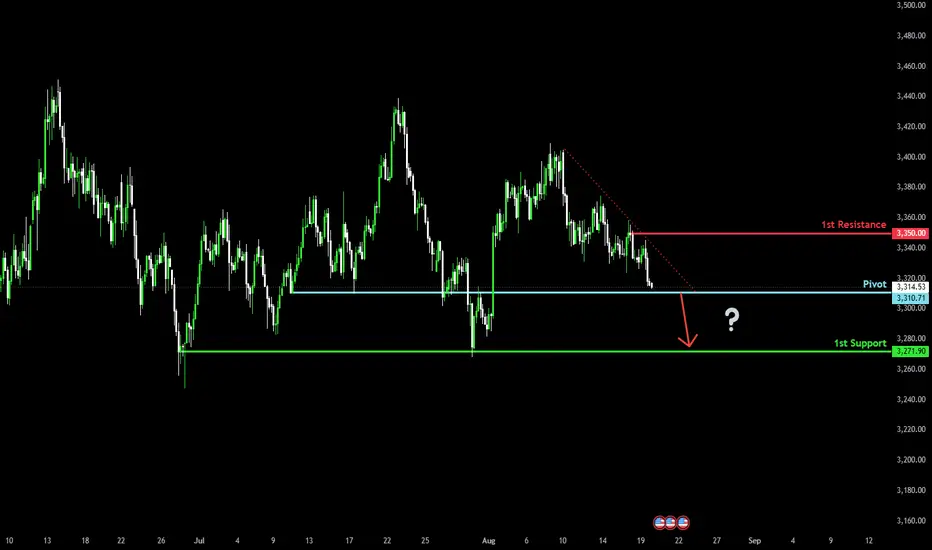
Bearish breakout for the Gold?The price is falling towards the pivot, which has been identified as an overlap support. A breakout could lead the price to drop to the first support, a multi-swing low.
Pivot: 3,310.71
1st Support: 3,271.90
1st Resistance: 3,350.00
1Risk Warning:
Trading Forex and CFDs carries a high level of risk to your capital and you should only trade with money you can afford to lose. Trading Forex and CFDs may not be suitable for all investors, so please ensure that you fully understand the risks involved and seek independent advice if necessary.
Disclaimer:
The above opinions given constitute general market commentary, and do not constitute the opinion or advice of IC Markets or any form of personal or investment advice.
Any opinions, news, research, analyses, prices, other information, or links to third-party sites contained on this website are provided on an "as-is" basis, are intended only to be informative, is not an advice nor a recommendation, nor research, or a record of our trading prices, or an offer of, or solicitation for a transaction in any financial instrument and thus should not be treated as such. The information provided does not involve any specific investment objectives, financial situation and needs of any specific person who may receive it. Please be aware, that past performance is not a reliable indicator of future performance and/or results. Past Performance or Forward-looking scenarios based upon the reasonable beliefs of the third-party provider are not a guarantee of future performance. Actual results may differ materially from those anticipated in forward-looking or past performance statements. IC Markets makes no representation or warranty and assumes no liability as to the accuracy or completeness of the information provided, nor any loss arising from any investment based on a recommendation, forecast or any information supplied by any third-party.
GOLD H4 | Potential bearish dropXAU/USD is reacting off the sell entry of 3,342.80, which is a pullback resistance and could drop from this levle to the downside.
Stop loss is at 3,367.03, which is a swing high resistance.
Take profit is at 3,306.77, which is a pullback support that is slightly above the 161.8% Fibonacci extension.
High Risk Investment Warning
Trading Forex/CFDs on margin carries a high level of risk and may not be suitable for all investors. Leverage can work against you.
Stratos Markets Limited (tradu.com ):
CFDs are complex instruments and come with a high risk of losing money rapidly due to leverage. 65% of retail investor accounts lose money when trading CFDs with this provider. You should consider whether you understand how CFDs work and whether you can afford to take the high risk of losing your money.
Stratos Europe Ltd (tradu.com ):
CFDs are complex instruments and come with a high risk of losing money rapidly due to leverage. 66% of retail investor accounts lose money when trading CFDs with this provider. You should consider whether you understand how CFDs work and whether you can afford to take the high risk of losing your money.
Stratos Global LLC (tradu.com ):
Losses can exceed deposits.
Please be advised that the information presented on TradingView is provided to Tradu (‘Company’, ‘we’) by a third-party provider (‘TFA Global Pte Ltd’). Please be reminded that you are solely responsible for the trading decisions on your account. There is a very high degree of risk involved in trading. Any information and/or content is intended entirely for research, educational and informational purposes only and does not constitute investment or consultation advice or investment strategy. The information is not tailored to the investment needs of any specific person and therefore does not involve a consideration of any of the investment objectives, financial situation or needs of any viewer that may receive it. Kindly also note that past performance is not a reliable indicator of future results. Actual results may differ materially from those anticipated in forward-looking or past performance statements. We assume no liability as to the accuracy or completeness of any of the information and/or content provided herein and the Company cannot be held responsible for any omission, mistake nor for any loss or damage including without limitation to any loss of profit which may arise from reliance on any information supplied by TFA Global Pte Ltd.
The speaker(s) is neither an employee, agent nor representative of Tradu and is therefore acting independently. The opinions given are their own, constitute general market commentary, and do not constitute the opinion or advice of Tradu or any form of personal or investment advice. Tradu neither endorses nor guarantees offerings of third-party speakers, nor is Tradu responsible for the content, veracity or opinions of third-party speakers, presenters or participants.
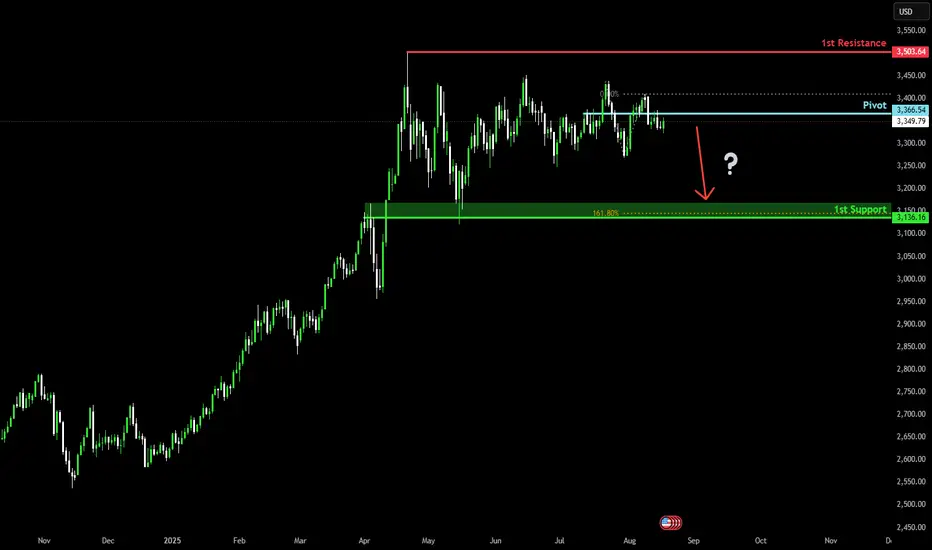
Potential bearish reversal?The Gold (XAU/USD) is reacting off the pivot and could drop to the 1st support that lines up with the 161.8% Fibonacci extension.
Pivot: 3,366.54
1st Support: 3,136.16
1st Resistance: 3,503.64
Risk Warning:
Trading Forex and CFDs carries a high level of risk to your capital and you should only trade with money you can afford to lose. Trading Forex and CFDs may not be suitable for all investors, so please ensure that you fully understand the risks involved and seek independent advice if necessary.
Disclaimer:
The above opinions given constitute general market commentary, and do not constitute the opinion or advice of IC Markets or any form of personal or investment advice.
Any opinions, news, research, analyses, prices, other information, or links to third-party sites contained on this website are provided on an "as-is" basis, are intended only to be informative, is not an advice nor a recommendation, nor research, or a record of our trading prices, or an offer of, or solicitation for a transaction in any financial instrument and thus should not be treated as such. The information provided does not involve any specific investment objectives, financial situation and needs of any specific person who may receive it. Please be aware, that past performance is not a reliable indicator of future performance and/or results. Past Performance or Forward-looking scenarios based upon the reasonable beliefs of the third-party provider are not a guarantee of future performance. Actual results may differ materially from those anticipated in forward-looking or past performance statements. IC Markets makes no representation or warranty and assumes no liability as to the accuracy or completeness of the information provided, nor any loss arising from any investment based on a recommendation, forecast or any information supplied by any third-party.
Gold | Bearish Below 3343 – Key Break Levels AheadGold Futures Set to End Week Lower on Dented Haven Demand
Gold prices appear to be stabilizing below 3343, indicating that as long as the price trades under this level, it may drop to 3332 and 3320. A break below 3320 could extend losses toward 3285.
However, a 1H close above 3344 would be a key signal for a potential bullish move toward 3365.
Pivot: 3343
Support: 3332, 3320, 3285
Resistance: 3355, 3365, 3382
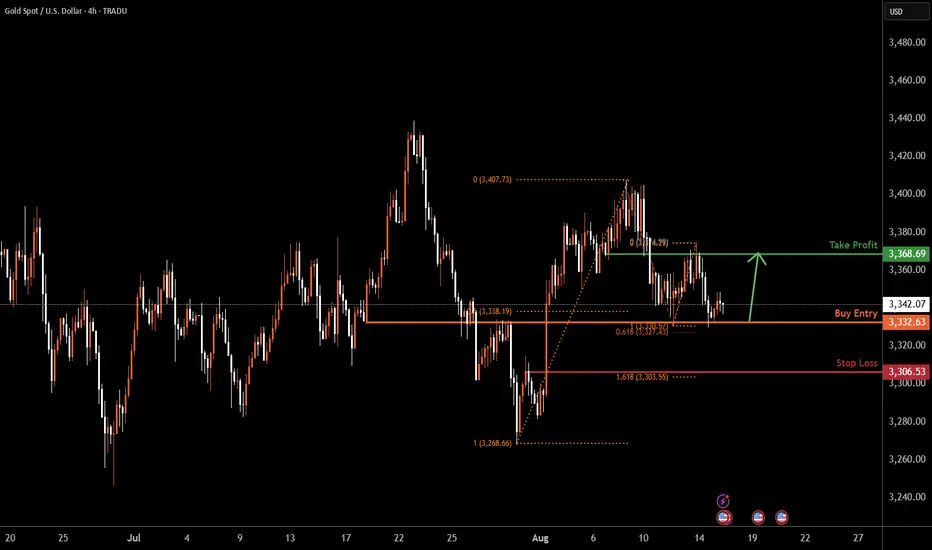
XAUUSD H4 | Bullish bounce offXAU/USD is reacting off the buy entry of 3,332.63, which is an overlap support that is slightly above the 61.8% Fibonacci projection and could bounce from this level to the take profit.
Stop loss is at 3,306.53, which is a pullback support that lines up with the 161.8% Fibonacci extension.
Take profit is at 3,368.69, which is a pullback resistance.
High Risk Investment Warning
Trading Forex/CFDs on margin carries a high level of risk and may not be suitable for all investors. Leverage can work against you.
Stratos Markets Limited (tradu.com ):
CFDs are complex instruments and come with a high risk of losing money rapidly due to leverage. 65% of retail investor accounts lose money when trading CFDs with this provider. You should consider whether you understand how CFDs work and whether you can afford to take the high risk of losing your money.
Stratos Europe Ltd (tradu.com ):
CFDs are complex instruments and come with a high risk of losing money rapidly due to leverage. 66% of retail investor accounts lose money when trading CFDs with this provider. You should consider whether you understand how CFDs work and whether you can afford to take the high risk of losing your money.
Stratos Global LLC (tradu.com ):
Losses can exceed deposits.
Please be advised that the information presented on TradingView is provided to Tradu (‘Company’, ‘we’) by a third-party provider (‘TFA Global Pte Ltd’). Please be reminded that you are solely responsible for the trading decisions on your account. There is a very high degree of risk involved in trading. Any information and/or content is intended entirely for research, educational and informational purposes only and does not constitute investment or consultation advice or investment strategy. The information is not tailored to the investment needs of any specific person and therefore does not involve a consideration of any of the investment objectives, financial situation or needs of any viewer that may receive it. Kindly also note that past performance is not a reliable indicator of future results. Actual results may differ materially from those anticipated in forward-looking or past performance statements. We assume no liability as to the accuracy or completeness of any of the information and/or content provided herein and the Company cannot be held responsible for any omission, mistake nor for any loss or damage including without limitation to any loss of profit which may arise from reliance on any information supplied by TFA Global Pte Ltd.
The speaker(s) is neither an employee, agent nor representative of Tradu and is therefore acting independently. The opinions given are their own, constitute general market commentary, and do not constitute the opinion or advice of Tradu or any form of personal or investment advice. Tradu neither endorses nor guarantees offerings of third-party speakers, nor is Tradu responsible for the content, veracity or opinions of third-party speakers, presenters or participants.
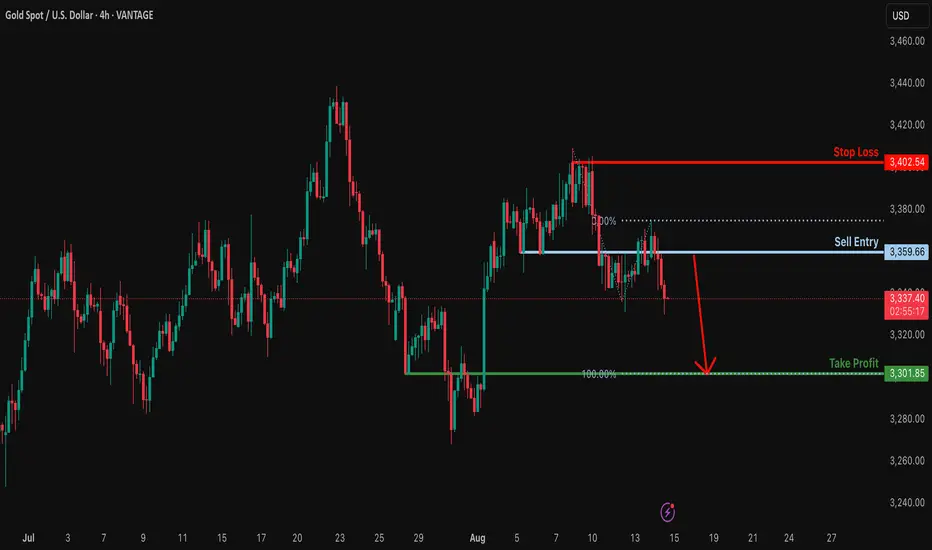
Bearish drop off pullback resistance?XAU/USD has rejected off the resistance level, which is a pullback resistance, and could drop from this level to our take profit.
Entry: 3,359.66
Why we like it:
There is a pullback resistance level.
Stop loss: 3,402.54
Why we like it:
There is a swing high resistance.
Take profit: 3,301.85
Why we like it:
There is a pullback support that lines up with the 100% Fibonacci extension.
Enjoying your TradingView experience? Review us!
Please be advised that the information presented on TradingView is provided to Vantage (‘Vantage Global Limited’, ‘we’) by a third-party provider (‘Everest Fortune Group’). Please be reminded that you are solely responsible for the trading decisions on your account. There is a very high degree of risk involved in trading. Any information and/or content is intended entirely for research, educational and informational purposes only and does not constitute investment or consultation advice or investment strategy. The information is not tailored to the investment needs of any specific person and therefore does not involve a consideration of any of the investment objectives, financial situation or needs of any viewer that may receive it. Kindly also note that past performance is not a reliable indicator of future results. Actual results may differ materially from those anticipated in forward-looking or past performance statements. We assume no liability as to the accuracy or completeness of any of the information and/or content provided herein and the Company cannot be held responsible for any omission, mistake nor for any loss or damage including without limitation to any loss of profit which may arise from reliance on any information supplied by Everest Fortune Group.
XAUUSD - Daily | UpdateGold is still in the upper range of this consolidation zone. You can see the high of the range is 3430, and the low is 3240 roughly.
Bulls:
Gold has cleared the Bearish FVG, only to pull back into a bullish FVG. If the price is bullish, then we should reject the gap with ease. Gold has just confirmed bullish price action. Look for gold to remain above 3330 and create a higher high.
Bears:
So with that said... If Gold fails to remain bullish above 3330, the price may move to a lower liquidity zone, such as 3300. Watch for gold to give a clear sign of rejection before entering a sell
**New Bearish FVG has form. Possible retest area 3370
XAUUSD H4 | Bullish bounce off 50% Fib supportThe Gold (XAU/USD) has bounced off the buy entry at 3,332.63, which is an overlap support that aligns with the 61.8% Fibonacci retracement and could potentially bounce from this level to the take profit.
Stop loss is at 3,306.53, which is a pullback support that lines up with the 78.6% Fibonacci retracement.
Take profit is at 3,400.62, whihc is a swing high resistance.
High Risk Investment Warning
Trading Forex/CFDs on margin carries a high level of risk and may not be suitable for all investors. Leverage can work against you.
Stratos Markets Limited (tradu.com ):
CFDs are complex instruments and come with a high risk of losing money rapidly due to leverage. 65% of retail investor accounts lose money when trading CFDs with this provider. You should consider whether you understand how CFDs work and whether you can afford to take the high risk of losing your money.
Stratos Europe Ltd (tradu.com ):
CFDs are complex instruments and come with a high risk of losing money rapidly due to leverage. 66% of retail investor accounts lose money when trading CFDs with this provider. You should consider whether you understand how CFDs work and whether you can afford to take the high risk of losing your money.
Stratos Global LLC (tradu.com ):
Losses can exceed deposits.
Please be advised that the information presented on TradingView is provided to Tradu (‘Company’, ‘we’) by a third-party provider (‘TFA Global Pte Ltd’). Please be reminded that you are solely responsible for the trading decisions on your account. There is a very high degree of risk involved in trading. Any information and/or content is intended entirely for research, educational and informational purposes only and does not constitute investment or consultation advice or investment strategy. The information is not tailored to the investment needs of any specific person and therefore does not involve a consideration of any of the investment objectives, financial situation or needs of any viewer that may receive it. Kindly also note that past performance is not a reliable indicator of future results. Actual results may differ materially from those anticipated in forward-looking or past performance statements. We assume no liability as to the accuracy or completeness of any of the information and/or content provided herein and the Company cannot be held responsible for any omission, mistake nor for any loss or damage including without limitation to any loss of profit which may arise from reliance on any information supplied by TFA Global Pte Ltd.
The speaker(s) is neither an employee, agent nor representative of Tradu and is therefore acting independently. The opinions given are their own, constitute general market commentary, and do not constitute the opinion or advice of Tradu or any form of personal or investment advice. Tradu neither endorses nor guarantees offerings of third-party speakers, nor is Tradu responsible for the content, veracity or opinions of third-party speakers, presenters or participants.
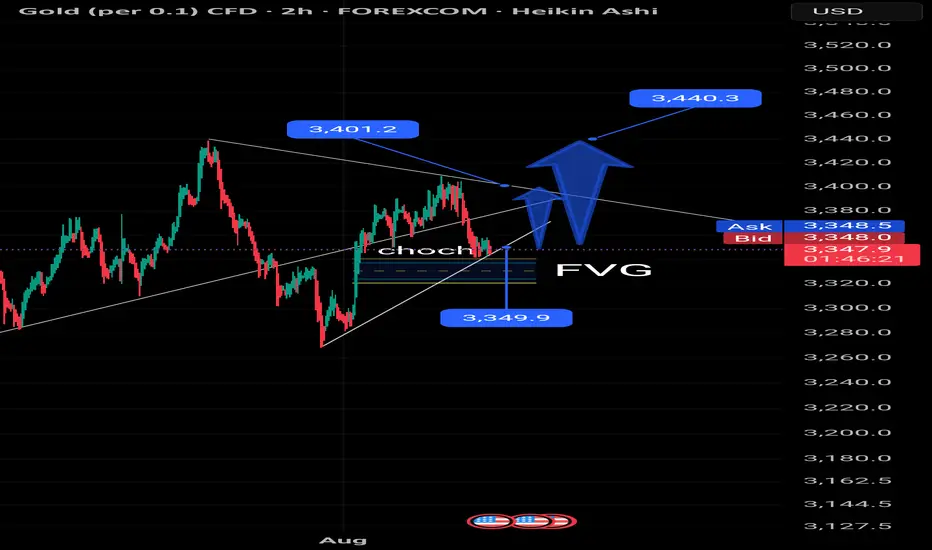
GOLD (XAU/USD) – 2H Price Action & SMC Outlook# 🟡 GOLD (XAU/USD) – 2H Price Action & SMC Outlook
**Date:** 2025/08/12
**Timeframe:** 2H (Heikin Ashi)
**Style:** Smart Money Concept (SMC) + Fair Value Gap (FVG)
---
## 📊 Market Context
Gold is currently testing the **FVG support area** around **3,349 – 3,350**, with a visible **CHOCH** structure forming on the chart. The reaction from this level will be critical in determining the next directional move.
---
## 📈 Bullish Scenario (Primary)
1. **Condition:**
- Price respects the FVG zone (**3,349.9**)
- CHOCH breaks to the upside
- Clean break and close above **3,401.2**
2. **Expected Move:**
- Retest of the breakout zone for liquidity grab
- Extension towards **3,440** as the main target
3. **Targets:**
- 🎯 TP1: **3,401.2** (break confirmation)
- 🎯 TP2: **3,440** (major resistance & supply)
4. **Invalidation:**
- A close below **3,345** would weaken the bullish case and expose lower demand.
---
## 📉 Bearish Scenario (Alternative)
1. **Condition:**
- Price fails to break **3,401.2**
- Strong rejection from the descending trendline
2. **Expected Move:**
- Return to the FVG zone at **3,349.9**
- If broken, possible continuation towards **3,320 – 3,325**
---
## ⚠️ Analysis Validity
This analysis remains valid while **FVG support holds** and a **bullish CHOCH breakout** occurs.
Failure to hold the FVG could trigger deeper retracements.
---
#XAUUSD #GoldAnalysis #SMC #FVG #CHOCH #TradingView