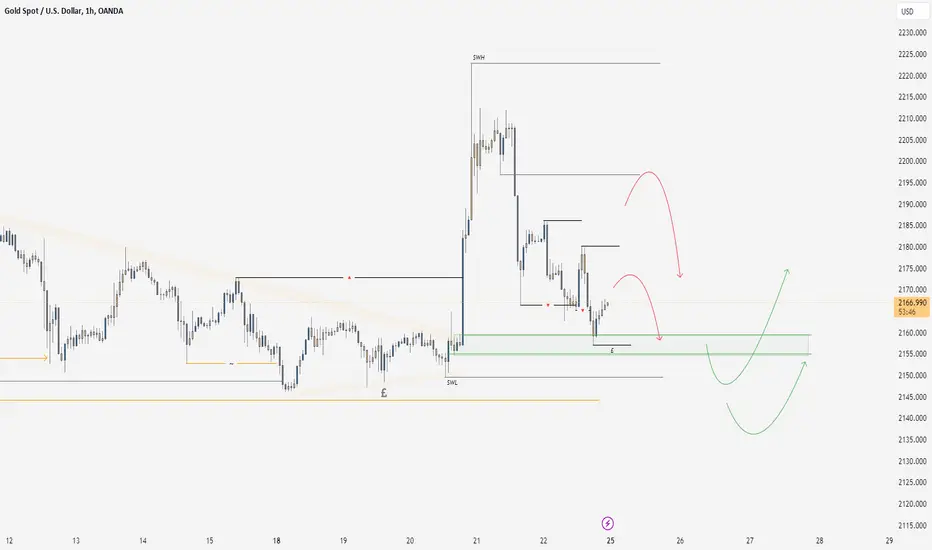
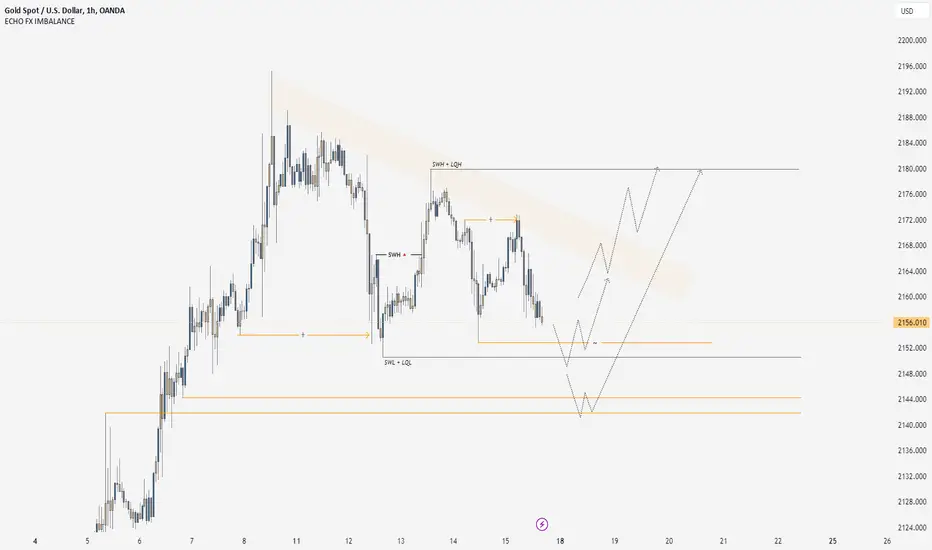
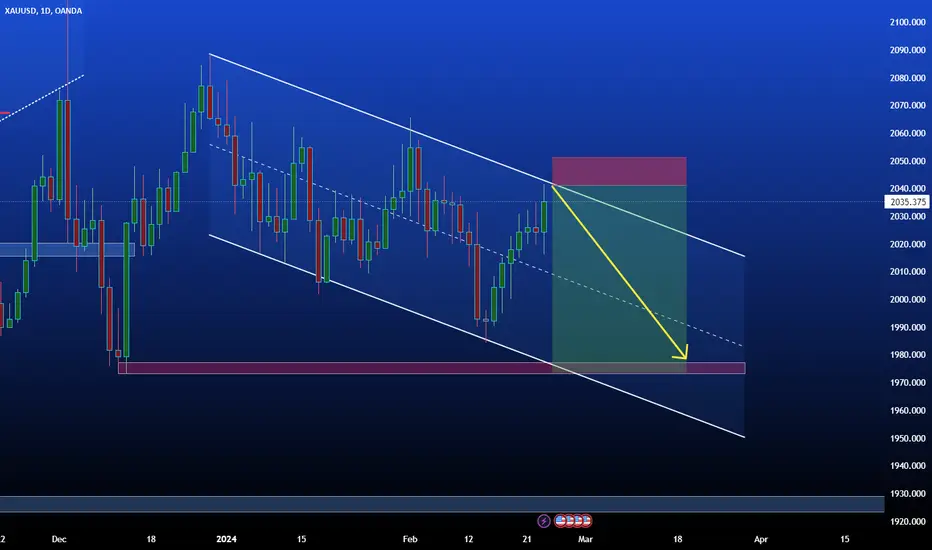
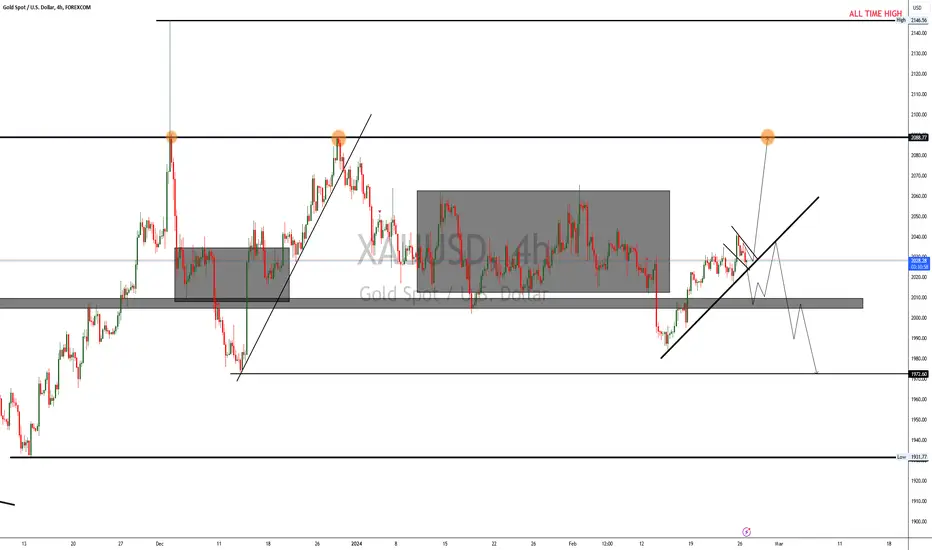
XAUUSD 24/3/24Gold giving us a clear bullish structure but we also reached our ATH and we know price very often reaches for liquid after an ATH is reached, this does not mean we are looking for price to shift bearish but we have to keep this in mind as always, as you can see here on the chart we have liquid lows and 4 ideas of what we think price may deliver!
Please keep in mind the liquid is sitting at our last major structure low and breaking this may very well shift us short term bearish... until we get a move keep all 4 for these ideas in mind, i am expecting a lower move and then a pull back higher into our newly created short term bearish range, we of course will keep in mind all of the highlighted ideas in mind and like always you trade what you see and not what you want to see!
Xau-usd
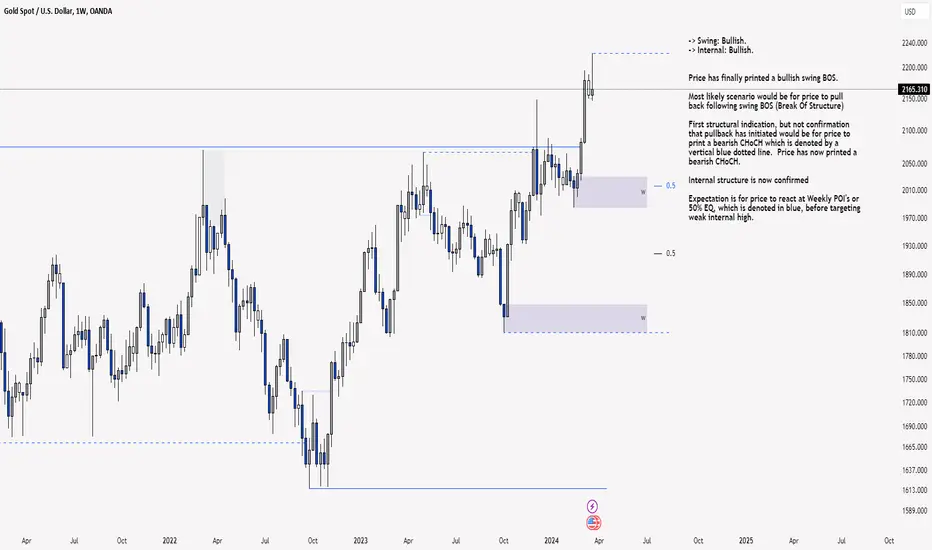
XAU/USD 25-29 March 2024 Weekly OutlookWeekly Analysis:
-> Swing: Bullish.
-> Internal: Bullish.
Price has finally printed a bullish swing BOS.
Most likely scenario would be for price to pull back following swing BOS (Break Of Structure)
First structural indication, but not confirmation that pullback has initiated would be for price to print a bearish CHoCH which is denoted by a vertical blue dotted line. Price has now printed a bearish CHoCH.
Internal structure is now confirmed
Expectation is for price to react at Weekly POI's or 50% EQ, which is denoted in blue, before targeting weak internal high.
Weekly Chart:
Daily Analysis:
-> Swing: Bullish.
-> Internal: Bullish.
Price has printed a swing BOS. Swing low confirmed and adjusted with swing high yet to be established.
Most likely scenario will be for price to pull back following swing BOS. First indication, but not confirmation, would be a bearish CHOCH denoted with a vertical dotted line.
Price could potentially continue to trade bullish to seek further liquidity before pullback, however, it is looking increasingly likely a pullback will be imminent as the CHoCH has been brought considerably closer.
Daily Chart:
H4 Analysis:
Bias/Analysis remains unchanged since last analysis dated 22/03/2024
-> Swing: Bullish.
-> Internal: Bullish.
Gold continues it's bullish run following the Fed's dovish outlook on interest rates.
Price has printed a bullish iBOS where we are currently trading within a fractal high and internal low.
Relative to recent price action of the swing range, I have readjusted bullish BOS to bullish iBOS.
Intraday expectation is for price to react H4 POI to then target fractal high.
Because of the need for HTF's requiring a pullback, another potential scenario would be for price to continue bearish and print a bearish iBOS which would then indicate the Daily pullback has initiated.
H4 Chart:
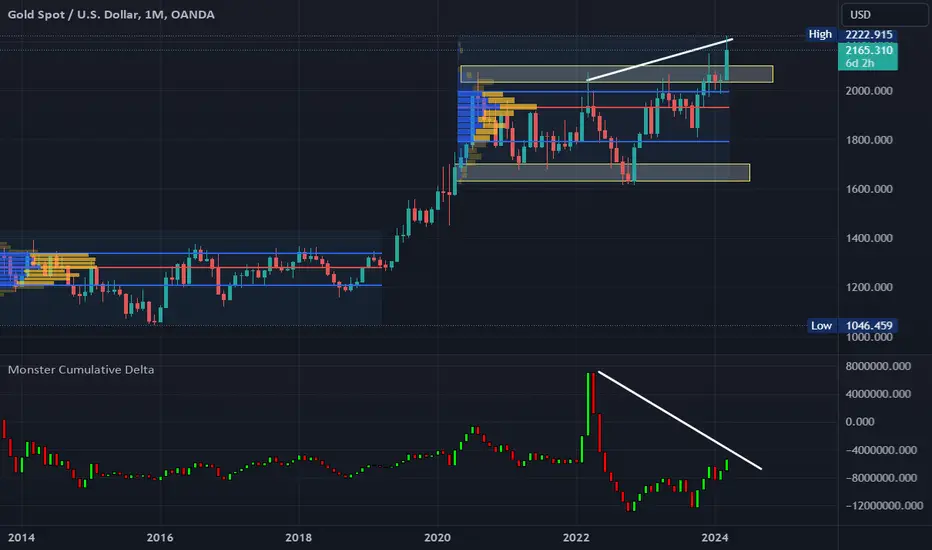
GoldGold has shown me something surprising whilst overlooking some charts, we appear to have this huge monthly divergence in the asset when alongside the cumulative delta, now I have my doubts as this delta should be using orders for the most efficient results, but it is sure is interesting as its the only divergence I can find looking back, be interesting to here some others views on this.
XAU/USD 21 March 2024 Intraday AnalysisH4 Analysis:
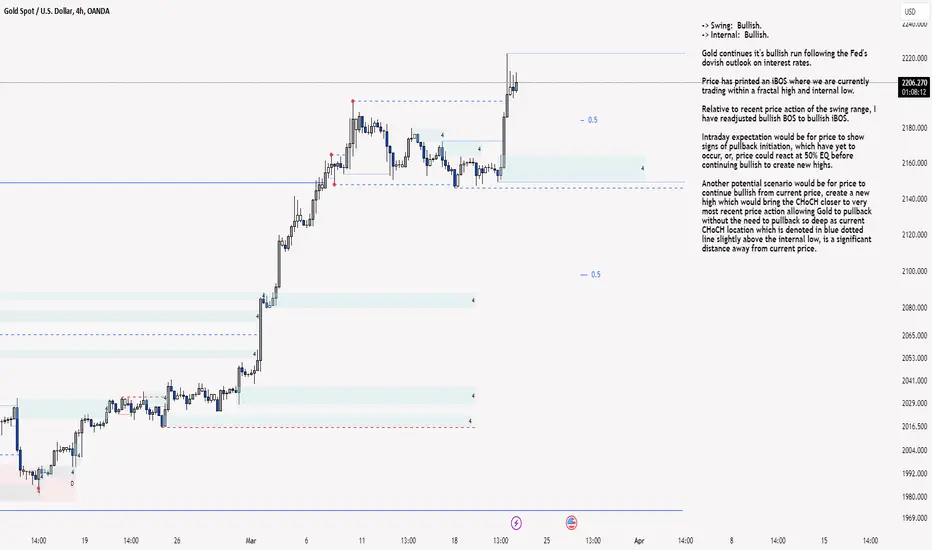
-> Swing: Bullish.
-> Internal: Bullish.
Gold continues it's bullish run following the Fed's dovish outlook on interest rates.
Price has printed an iBOS where we are currently trading within a fractal high and internal low.
Relative to recent price action of the swing range, I have readjusted bullish BOS to bullish iBOS.
Intraday expectation would be for price to show signs of pullback initiation, which have yet to occur, or, price could react at 50% EQ before continuing bullish to create new highs.
Another potential scenario would be for price to continue bullish from current price, create a new high which would bring the CHoCH closer to very most recent price action allowing Gold to pullback without the need to pullback so deep as current CHoCH location which is denoted in blue dotted line slightly above the internal low, is a significant distance away from current price.
H4 Chart:
M15 Analysis:
-> Swing: Bullish.
-> Internal: Bullish.
Price has printed a bullish iBOS followed by bullish BOS following the Fed's dovish outlook on interest rates yesterday.
Price is currently trading within a fractal high and low.
Intraday expectation would be for price to indicate initiation of pullback by printing a bearish CHoCH which is denoted with blue dotted lines.
Alternatively, and much like H4, price could continue bullish to create new highs in order to bring CHOCH closer to the very most recent price action. This would Gold to initiate first structural signs of pullback without the need to significantly pull back.
M15 Chart:
Buy XAUUSD Channel BreakoutThe XAU/USD pair (spot gold) on the M30 timeframe presents a potential buying opportunity due to a recent upward breakout from a well-defined bullish channel pattern. This suggests ongoing buying pressure and a higher likelihood of further advances in the coming minutes or hours.
Key Points:
Buy Entry: Consider entering a long position (buying) around the current price of 2161. This offers an entry point close to the breakout level, where buying pressure might be intensifying.
Target Levels: Initial bullish targets lie at the following levels:
2174: This represents the height of the channel, measured from the channel bottom (support line) to the top (resistance line), projected upwards from the breakout point.
2182: This is achieved by adding the height of the channel to the breakout point. These targets act as potential resistance zones that could see buying interest.
Stop-Loss: To manage risk, place a stop-loss order below the broken resistance line of the channel, ideally around 2153. This helps limit potential losses if the trend unexpectedly reverses.
Thank you

XAU/USD 20 March 2024 Intraday AnalysisH4 Analysis:
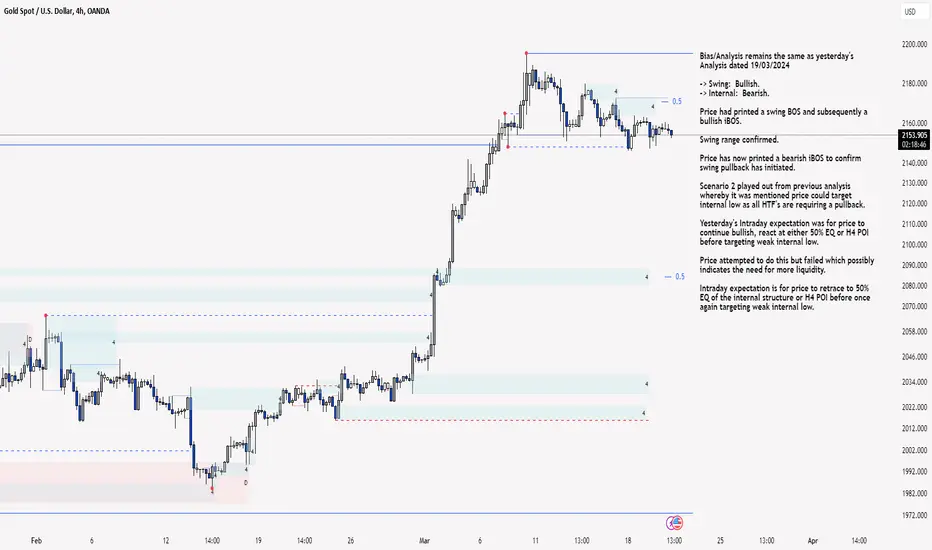
Bias/Analysis remains the same as yesterday's Analysis dated 19/03/2024
-> Swing: Bullish.
-> Internal: Bearish.
Price had printed a swing BOS and subsequently a bullish iBOS.
Swing range confirmed.
Price has now printed a bearish iBOS to confirm swing pullback has initiated.
Scenario 2 played out from previous analysis whereby it was mentioned price could target internal low as all HTF's are requiring a pullback.
Yesterday's Intraday expectation was for price to continue bullish, react at either 50% EQ or H4 POI before targeting weak internal low.
Price attempted to do this but failed which possibly indicates the need for more liquidity.
Intraday expectation is for price to retrace to 50% EQ of the internal structure or H4 POI before once again targeting weak internal low.
H4 Chart:
M15 Analysis:
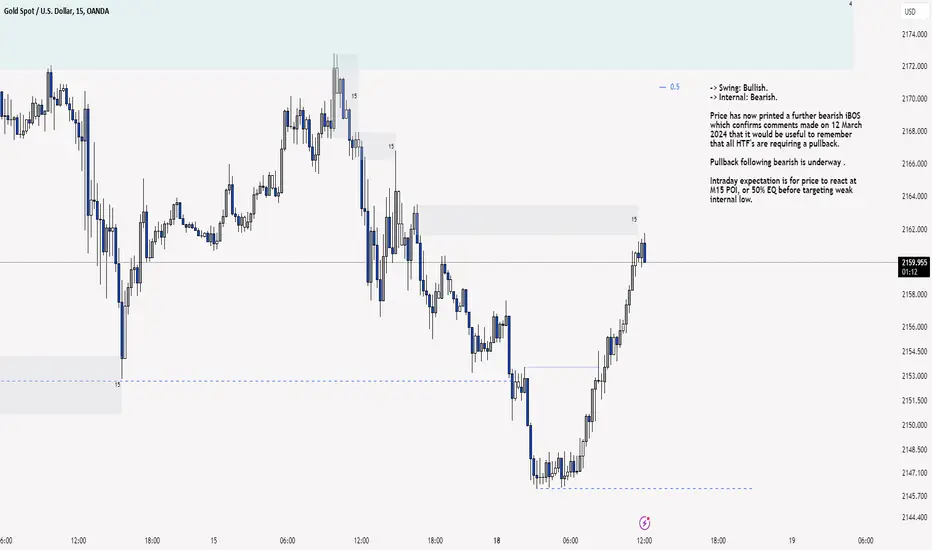
-> Swing: Bullish.
-> Internal: Bearish.
Price has now printed a further bearish iBOS which confirms comments made on 12 March 2024 that it would be useful to remember that all HTF's are requiring a pullback.
Pullback following bearish iBOS is underway .
Yesterday's Intraday expectation was for price to react at M15 POI, or 50% EQ (denoted in blue) before targeting weak internal low. Price did as expected.
However, price was unable to break and close below weak internal low which indicates that bearish pullback following bullish iBOS on M15 TF and bearish pullback for H4 TF remains underway.
Price has been moving sideways in a narrow range which could indicate that we await to see results of high impact incoming data before higher volatility moves are made.
Intraday expectation remains the same as yesterday, for price to target weak internal low.
M15 Chart:
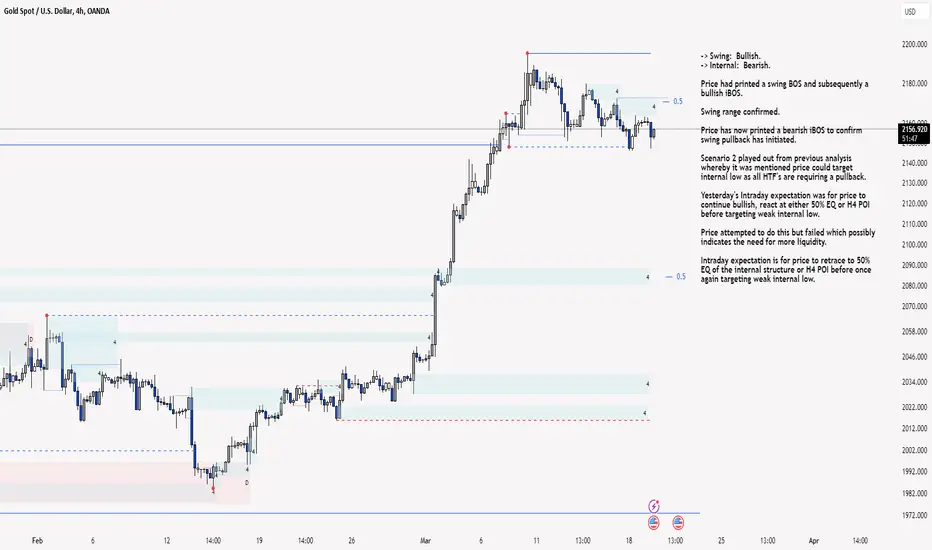
XAU/USD 19 March 2024 Intraday AnalysisH4 Analysis:
-> Swing: Bullish.
-> Internal: Bearish.
Price had printed a swing BOS and subsequently a bullish iBOS.
Swing range confirmed.
Price has now printed a bearish iBOS to confirm swing pullback has initiated.
Scenario 2 played out from previous analysis whereby it was mentioned price could target internal low as all HTF's are requiring a pullback.
Yesterday's Intraday expectation was for price to continue bullish, react at either 50% EQ or H4 POI before targeting weak internal low.
Price attempted to do this but failed which possibly indicates the need for more liquidity.
Intraday expectation is for price to retrace to 50% EQ of the internal structure or H4 POI before once again targeting weak internal low.
H4 Chart:
M15 Analysis:
-> Swing: Bullish.
-> Internal: Bearish.
Price has now printed a further bearish iBOS which confirms comments made on 12 March 2024 that it would be useful to remember that all HTF's are requiring a pullback.
Pullback following bearish iBOS is underway .
Yesterday's Intraday expectation was for price to react at M15 POI, or 50% EQ (denoted in blue) before targeting weak internal low. Price did as expected.
However, price was unable to break and close below weak internal low which indicates that bearish pullback following bullish iBOS on M15 TF and bearish pullback for H4 TF remains underway.
Intraday expectation is for price to react at 50% EQ of the internal structure (denoted in blue) and once again target weak internal low.
Price could potentially go deeper into premium EQ of the internal structure, react at H4 POI before targeting weak internal low.
M15 Chart:
XAU/USD 08 March 2024 Intraday AnalysisH4 Analysis:
-> Swing: Bullish.
-> Internal: Bearish.
Price had printed a swing BOS and subsequently a bullish iBOS.
Swing range confirmed.
Price has now printed a bearish iBOS to confirm swing pullback has initiated and is underway.
Scenario 2 played out from previous analysis whereby it was mentioned price could target internal low as all HTF's are requiring a pullback.
Intraday expectation is for price to continue bullish, react at either 50% EQ or H4 POI before targeting weak internal low.
H4 Chart:
M15 Analysis:
-> Swing: Bullish.
-> Internal: Bearish.
Price has now printed a further bearish iBOS which confirms comments made on 12 March 2024 that it would be useful to remember that all HTF's are requiring a pullback.
Pullback following bearish is underway .
Intraday expectation is for price to react at M15 POI, or 50% EQ before targeting weak internal low.
M15 Chart:
XAUUSD 17/3/24Gold has been running highs since the markup we gave out last month, hitting our daily POI and carrying back over into the bullish trend.
In this weeks mark-up we are looking at higher prices again with the clear bullish direction we have, now keep in mind we have 3 highs in play that give us a clear area of liquid to run into so with this principle in place we look to the 5min and see another bullish signal in the form of a swing high between our SWH and SWL range. We currently sit at the base of this range and it will fuel the moves to come following a run of either the high or low of said range, so as shown on our chart we have 3 ideas behind this long shift.
Firstly we run our highs and get an entry within our bullish range to then go high.
secondly we drop lower to sweep the SWL and then we run higher finding a long move the final idea we run into the daily FVG and hourly liquid lows to shift price bullish after most biases have changed to bearish.
Trade price as it delivers and don't get dragged into what you want to see and focus on what you are seeing!
have an amazing week and i wish you all a profitable week!
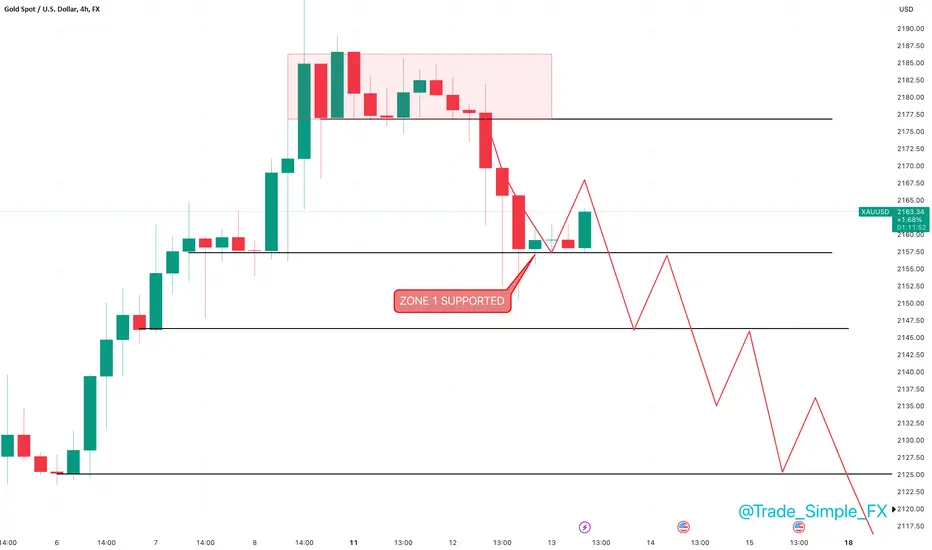
XAUUSD - Signal UpdateXAUUSD H4
Price dumped yesterday following the cluster of inflation data we witnessed, US stock indices whipsawed, XAUUSD dumped beyond our support on the LTF, but held on the H4.
A slight bounce was we are currently witnessing, before the next potential downside leg. US stock market volume to follow in 1 hour 45 minutes time. Lets see what it brings.
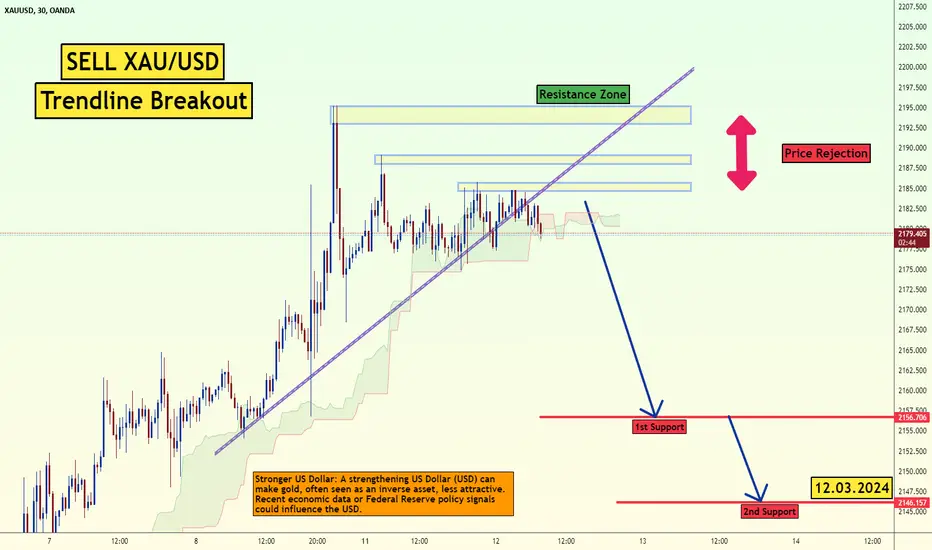
Sell XAUUSD Trendline BreakoutThe XAU/USD pair (spot gold) on the M30 timeframe presents a potential selling opportunity due to a recent downward break of a well-established trendline. This suggests a shift in momentum towards the downside and a higher likelihood of further declines in the coming minutes or hours.
Key Points:
Sell Entry: Consider entering a short position around the current price of 2180.00, positioned close to the breakout level. This offers an entry point near the perceived shift in momentum.
Target Levels: Initial bearish targets lie at the following levels: 2157 and 2146
Stop-Loss: To manage risk, place a stop-loss order above the broken trendline, ideally around 2190.00. This helps limit potential losses if the price rallies unexpectedly and breaks back above the trendline, invalidating the short trade.
Thank you
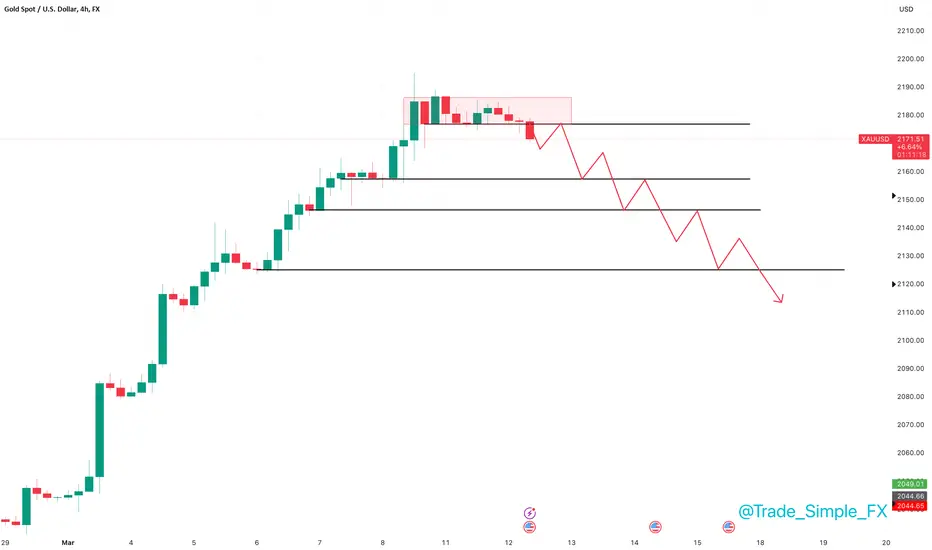
XAUUSD Bull run due a correction?XAUUSD exhausting evidently around this 2185 price. Previous legs upside have rallied significantly and moves sideways (consolidated). We are now starting to see price scallop over and exhaust somewhat.
LTF structure break is currently active and this could be the start of a deep correction from swing low of 2040 to swing high of 2195.
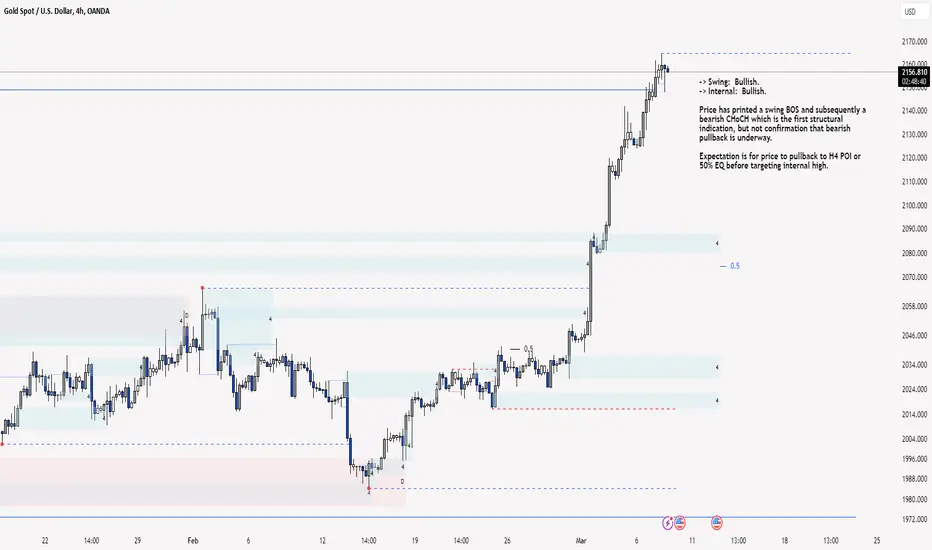
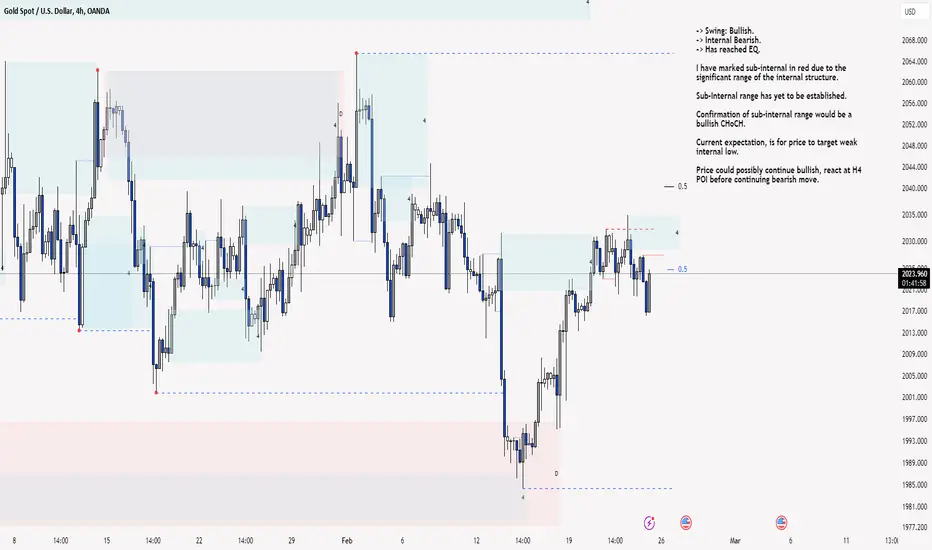
XAU/USD 07/03/2024 Intraday AnalysisH4 Analysis:
-> Swing: Bullish.
-> Internal: Bullish.
Price has printed a swing BOS and subsequently a bearish CHoCH which is the first structural indication, but not confirmation that bearish pullback is underway.
Expectation is for price to pullback to H4 POI or 50% EQ before targeting internal high.
H4 Chart:
M15 Analysis:
-> Swing: Bullish.
-> Internal: Bullish.
-> Has reached EQ.
Price has now printed a bullish swing BOS.
Swing high yet to be confirmed, therefore, we are trading within an internal range until we have confirmation of swing high.
Intraday expectation is for price to continue bullish to target swing high.
Price could potentially target M15 POI before continuing bullish.
However, request from HTF is for price to switch bearish to facilitate HTF pullback, therefore, a scenario is for price to target internal low.
M15 Chart:
GOLD FOR SCALPERS AND DAY TRADERS **2155 **Entry price , Target already marked in the chart itself FYI.
stoploss as per your risk mgmt
Guys pls like, share and follow my ideas .
Thank You and I wish everybody should win.

XAUUSD (Gold): Difficult to see anything stopping a retest Not much else to say here, there is not much getting in the way of gold at the moment.
Generally seeing dollar strength so I am expecting the high to be in sight, but do expect a retest of the 2150 mark now, looking at how bullish last week was.
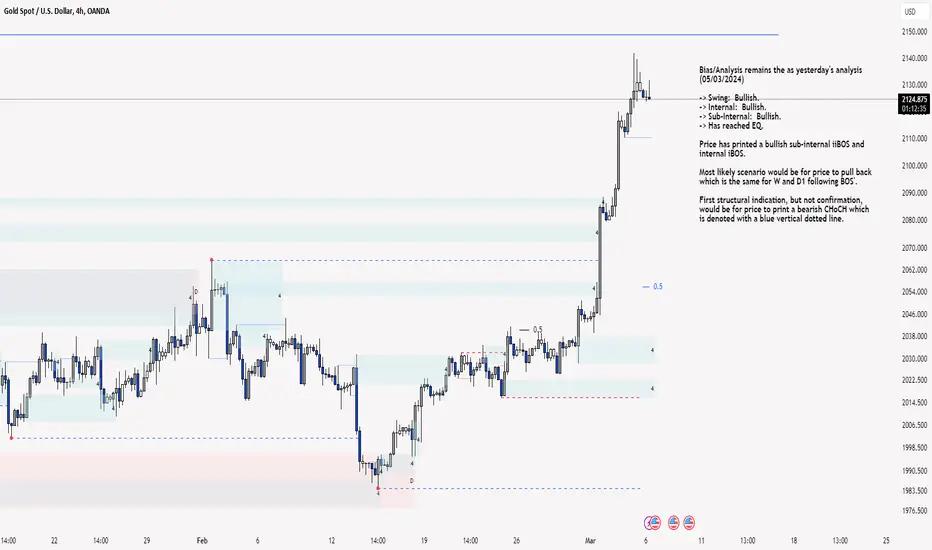
XAU/USD 06 March 2024 Intraday AnalysisH4 Analysis:
Bias/Analysis remains the as yesterday's analysis (05/03/2024)
-> Swing: Bullish.
-> Internal: Bullish.
-> Sub-Internal: Bullish.
-> Has reached EQ.
Price has printed a bullish sub-internal iiBOS and internal iBOS.
Most likely scenario would be for price to pull back which is the same for W and D1 following BOS'.
First structural indication, but not confirmation, would be for price to print a bearish CHoCH which is denoted with a blue vertical dotted line.
H4 chart:
M15 Analysis:
-> Swing: Bullish.
-> Internal: Bullish.
-> Has reached EQ.
Price has printed a further bullish iBOS.
We are now trading within an internal low and swing high.
Bearish CHoCH and internal low are located at the same position.
Price is currently in discount of EQ
Intraday expectation is for price to continue bullish to target swing high.
Price could potentially target M15 POI before continuing bullish.
M15 Chart :
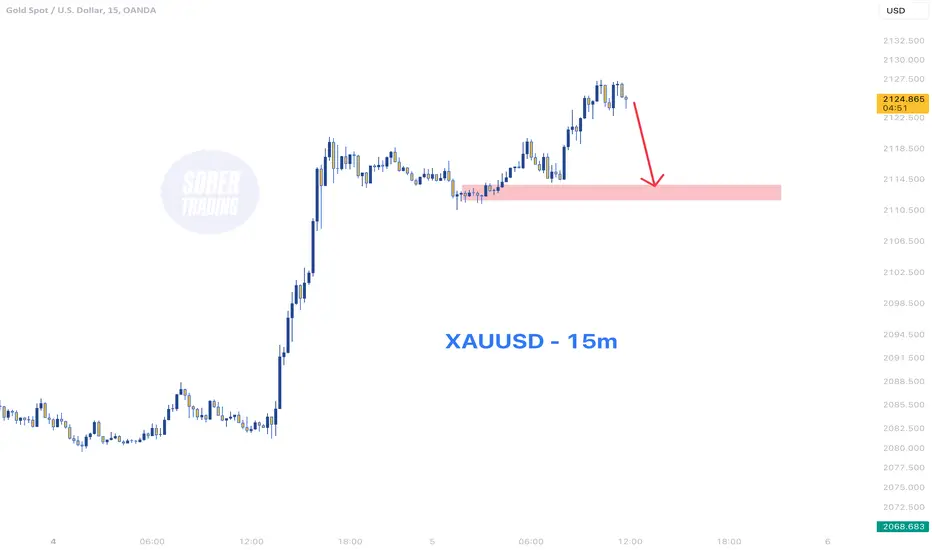
XAUUSD - 15m Sell for Scalperstraders, take note: we're spotting sell signals on #Gold, indicating a potential drop of around $10. Act prudently and keep a close watch on the market
XAUUSD (Gold): In downward channelSeeing a downward channel so expecting further bearish bias from here.
Fundamentals seem to be supporting this too, with cease fire talks in middle east, and I'm expecting continued strength from the dollar this week, supported by the fundamentals news on Thursday and Friday.
We're posting HH and HL formation and expect this to continue through this week.
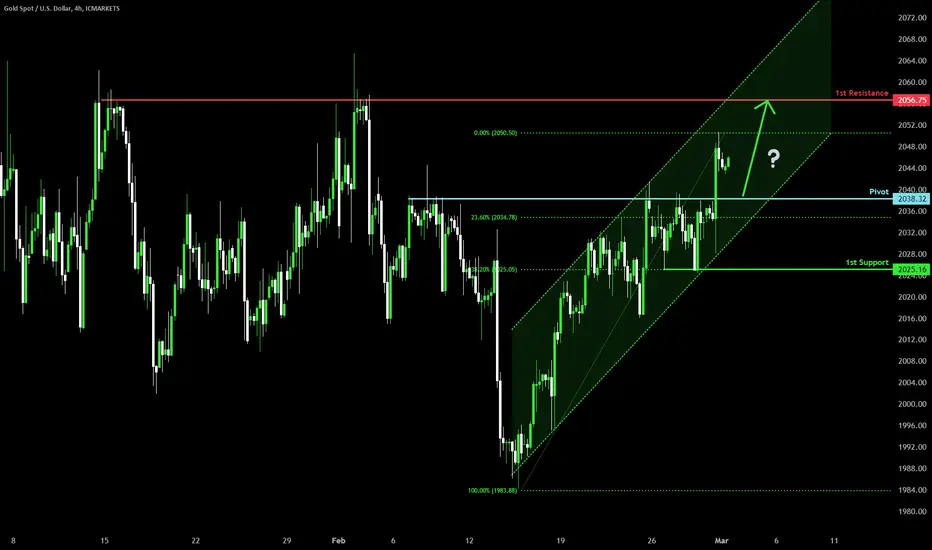
Could Gold continue its rise?Gold continues to sit nicely in a strong bullish channel. The major support is at 2038 which is a pullback support level - price could potentially bounce off this level before rising towards our 1st resistance at 2056 which happens to be a multi-swing high resistance.
Alternatively, if price breaks the pivot and ascending channel, we could see it drop towards 1st support at 2025 which is a swing low support + 38.2% fib retracement.
Risk Warning:
Trading Forex and CFDs carries a high level of risk to your capital and you should only trade with money you can afford to lose. Trading Forex and CFDs may not be suitable for all investors, so please ensure that you fully understand the risks involved and seek independent advice if necessary.
Disclaimer:
The above opinions given constitute general market commentary, and do not constitute the opinion or advice of IC Markets or any form of personal or investment advice.
Any opinions, news, research, analyses, prices, other information, or links to third-party sites contained on this website are provided on an "as-is" basis, are intended only to be informative, is not an advice nor a recommendation, nor research, or a record of our trading prices, or an offer of, or solicitation for a transaction in any financial instrument and thus should not be treated as such. The information provided does not involve any specific investment objectives, financial situation and needs of any specific person who may receive it. Please be aware, that past performance is not a reliable indicator of future performance and/or results. Past Performance or Forward-looking scenarios based upon the reasonable beliefs of the third-party provider are not a guarantee of future performance. Actual results may differ materially from those anticipated in forward-looking or past performance statements. IC Markets makes no representation or warranty and assumes no liability as to the accuracy or completeness of the information provided, nor any loss arising from any investment based on a recommendation, forecast or any information supplied by any third-party.
BUY TRADE SETUP ON XAUUSDHey Traders,
Check out this technical analysis on XAUUSD; it appears to be undergoing a small pullback, potentially indicating a bullish momentum continuation.
However, I would recommend waiting for a breakout above the flag pattern before considering a buy-trade entry.
Alternatively, there may be an opportunity for a sell trade if the market breaches the evident support area.
Keep a close eye on this.
XAU/USD 23 Feb 2024 Intraday AnalysisH4 Analysis:
-> Swing: Bullish.
-> Internal: Bearish.
-> Has reached EQ.
Price has printed a bearish iBOS. Internal range established.
Bullish pullback currently underway indicated by bullish CHoCH.
Intraday expectation is for price continue bullish, react at 50% (preferably within premium zone) or react at M15 POI as both are positioned nearby.
Price to then continue bearish to target weak internal low.
H4 Chart:
M15 Analysis:
-> Swing: Bullish.
-> Internal: Bearish.
-> Has reached EQ.
Price has printed a bearish iBOS. Internal range established.
Bullish pullback currently underway indicated by bullish CHoCH.
Intraday expectation is for price continue bullish, react at 50% (preferably within premium zone) or react at M15 POI as both are positioned nearby.
Price to then continue bearish to target weak internal low.
M15 Chart:
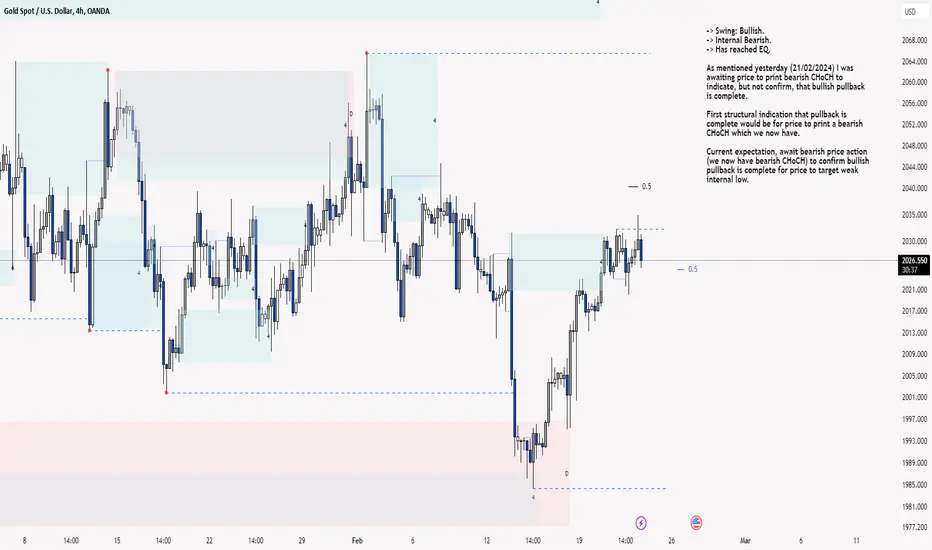
XAU/USD 22 Feb 2024 Intraday AnalysisH4 Analysis:
-> Swing: Bullish.
-> Internal Bearish.
-> Has reached EQ.
As mentioned yesterday (21/02/2024) I was awaiting price to print bearish CHoCH to indicate, but not confirm, that bullish pullback is complete.
First structural indication that pullback is complete would be for price to print a bearish CHoCH which we now have.
Current expectation, await bearish price action (we now have bearish CHoCH) to confirm bullish pullback is complete for price to target weak internal low.
H4 Chart:
M15 Analysis:
-> Swing: Bullish.
-> Internal: Bullish.
-> Has reached EQ.
Price has printed a further bullish iBOS. Internal range established.
Bearish pullback currently underway indicated by bearish CHoCH.
Price is currently reacting to the upper part of discount to 50% EQ of the internal range.
Intraday expectation is for price continue bullish to target weak internal high. Price may continue bearish, react at M15 POI before targeting weak internal high.
M15 Chart:
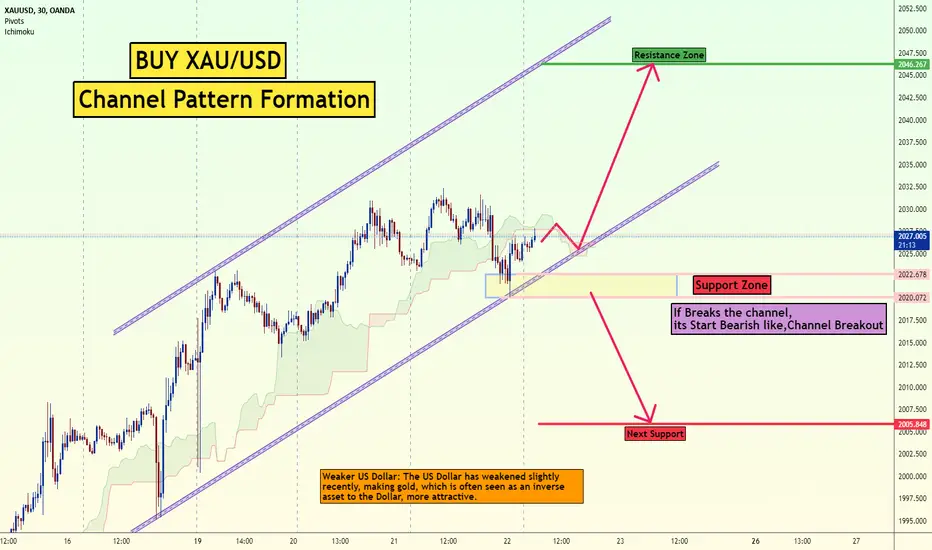
Buy XAUUSD Channel FormationThe XAU/USD pair (spot gold) on the M30 timeframe displays a potential buying opportunity due to the presence of a bullish channel pattern. This pattern suggests ongoing buying pressure and a higher likelihood of further advances in the coming minutes or hours.
Key Points:
Bullish Channel: The price has been trading within an upward-sloping channel, characterized by two converging lines: a rising support line and a rising resistance line. This ongoing uptrend signals continued buying pressure.
Recent Price Action: The recent price action shows the price holding above the support line of the channel, indicating continued bullish momentum.
Buy Entry: Consider entering a long position around the current price of 2026, positioned near the support line. This offers an entry point close to potential buying pressure.
Target Levels: Initial bullish targets lie at the previous resistance level within the channel, now acting as potential support: 2046. Further upside targets could be determined using other technical analysis methods like Fibonacci retracements or extensions.
If Price Breaks the Channel, its Starts Bearish like, Channel Breakout Pattern.
Thank you