XAU/USD 16 Feb 2024 Intraday AnalysisH4 Analysis:
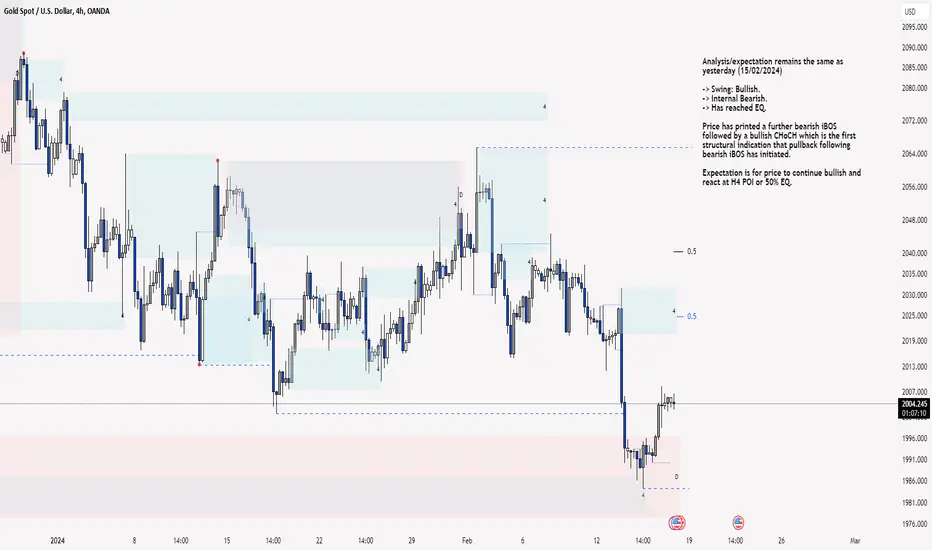
Analysis/expectation remains the same as yesterday (15/02/2024)
-> Swing: Bullish.
-> Internal Bearish.
-> Has reached EQ.
Price has printed a further bearish iBOS followed by a bullish CHoCH which is the first structural indication that pullback following bearish iBOS has initiated.
Expectation is for price to continue bullish and react at H4 POI or 50% EQ.
H4 Chart:
M15 Analysis:
-> Swing: Bullish.
-> Internal: Bullish.
-> Has reached EQ.
Price has printed a bullish iBOS indicating H4 bullish pullback has initiated.
Current intraday expectation remains the same as yesterday (15/02/2024) for price to continue bullish and react at nested H4 and M15 POI's.
M15 Chart:
Xau-usd
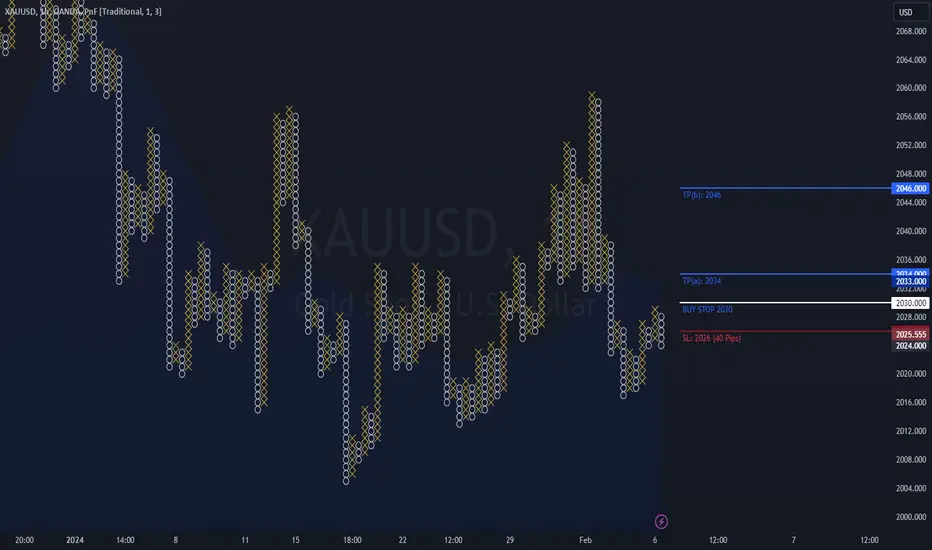
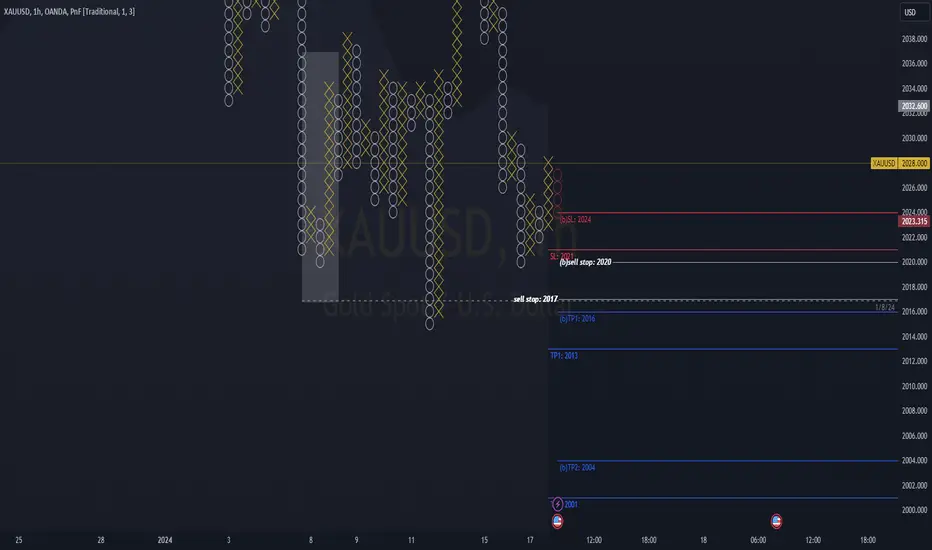
BUY StopLooking like Ill be changing my bias based on structure, and DXY short.
Will hold for 160 pips but first TP is 40
Enjoy
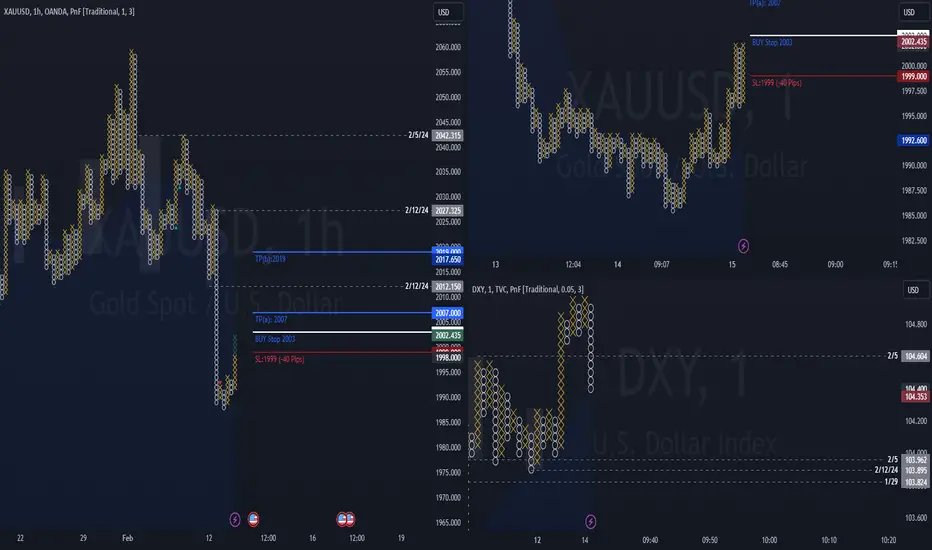
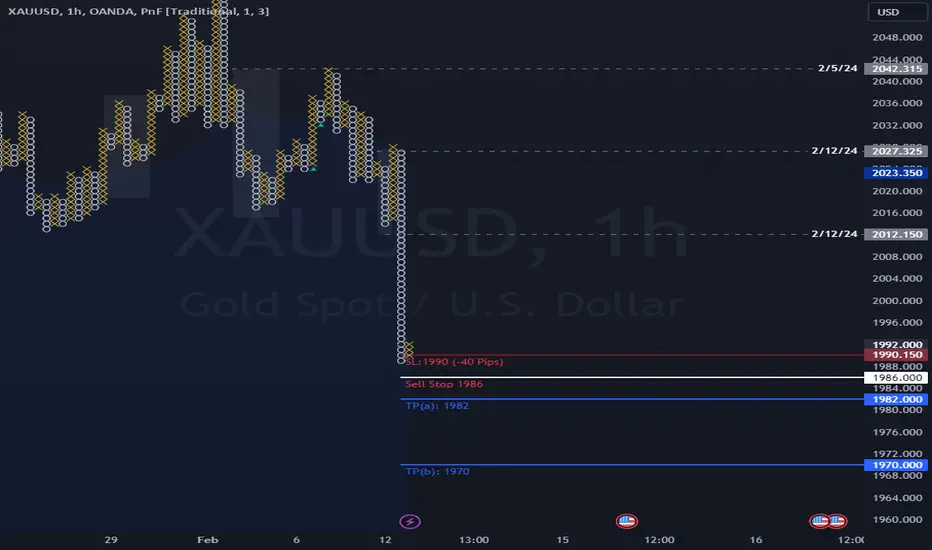
Sell Stop 2/14/24 Honest opinion is the dollar continues to rally after its big move yesterday. In this case I'll only be looking to place a pending order after 0845EST for the sell stop at 1986.
Keep in mind things may change from now to 0845, if it does ill add it in the comments section.
XAU/USD 14 Feb 2024 Intraday AnalysisH4 Analysis:
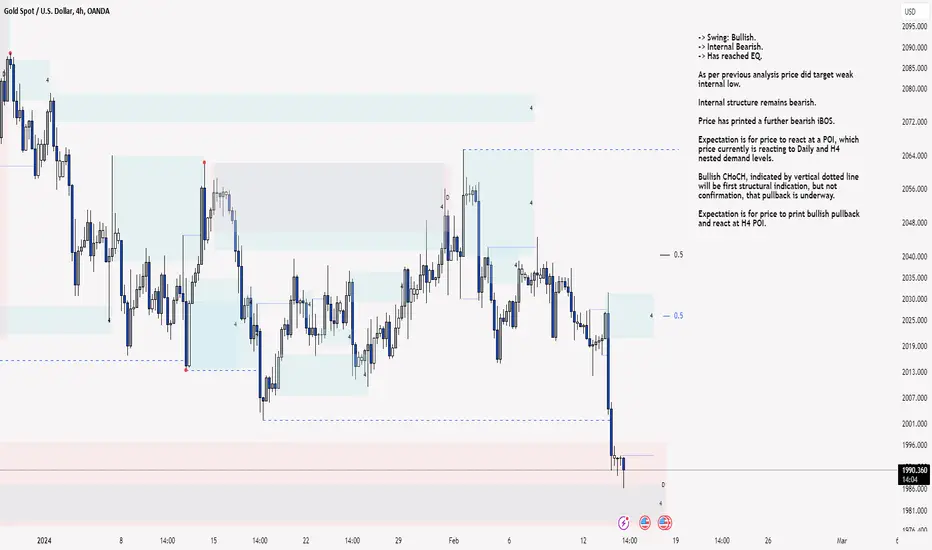
-> Swing: Bullish.
-> Internal Bearish.
-> Has reached EQ.
As per previous analysis price did target weak internal low.
Internal structure remains bearish.
Price has printed a further bearish iBOS.
Expectation is for price to react at a POI, which price currently is reacting to Daily and H4 nested demand levels.
Bullish CHoCH, indicated by vertical dotted line will be first structural indication, but not confirmation, that pullback is underway.
Expectation is for price to print bullish pullback and react at H4 POI.
H4 Chart:
M15 Analysis:
-> Swing: Bullish.
-> Internal: Bearish.
-> Sub-Internal: Bearish.
-> Has reached EQ.
Price has printed a bearish iBOS, as per previous analysis, price did target weak internal low where we are now seeing a bullish reaction to nested Daily and H4 POI's.
Intraday expectation of previous analysis was for price to target weak internal low at 2001.895, therefore, expectation was reached.
Current intraday expectation is for price to print bullish iBOS to confirm pullback following H4 and M15 bearish iBOS is underway.
M15 Chart:
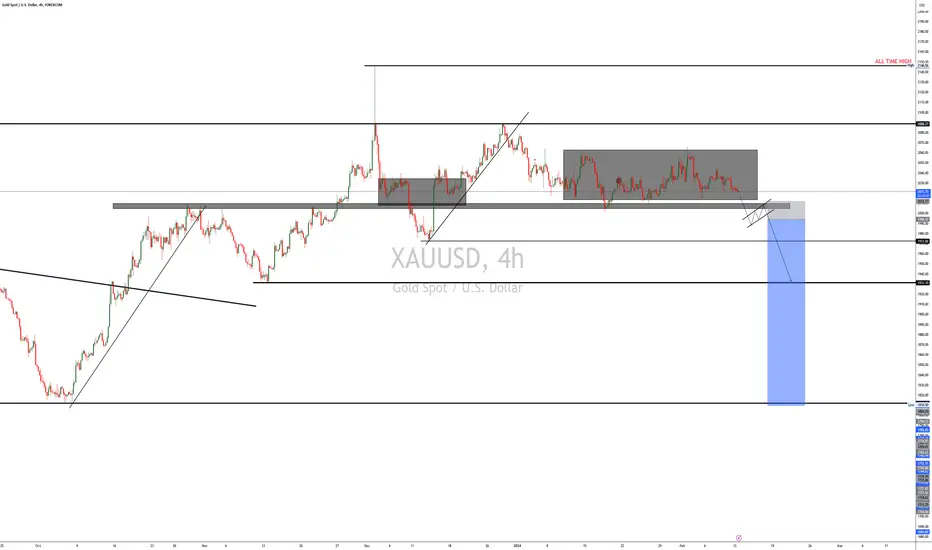
XAUUSD (GOLD)XAUUSD on 4h time frame we have FVG zone i think FVG will taken and price drop best zone to sell 2050 and best zone to buy 2012
SELL TRADE SETUP ON XAUUSDHey Traders,
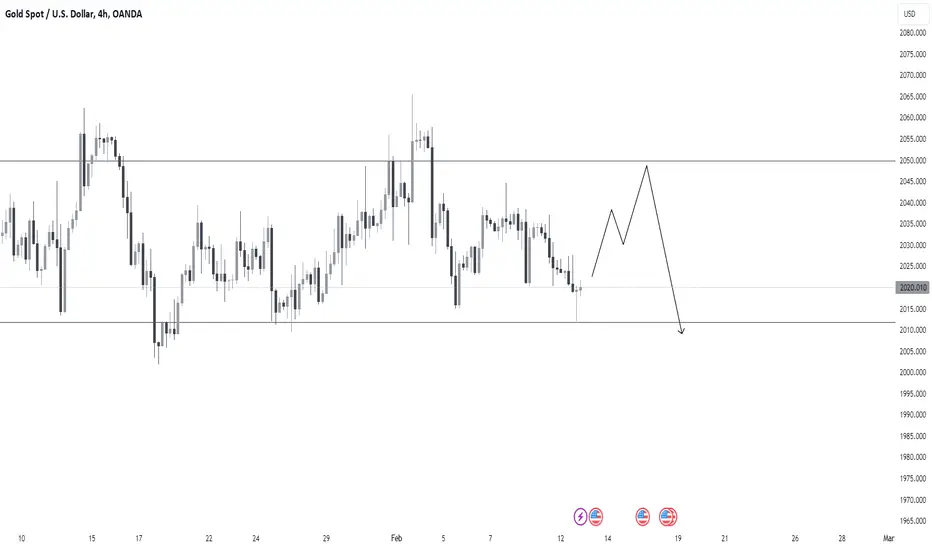
Check this analysis out on XAUUSD. The pair had been ranging for quite some time.
Provided that the price breaks and remains below the support, I will look for a nice short trade.
Keep a close tab on this one.
XAU/USD 12-16 Feb 2024 Weekly AnalysisWeekly Analysis:
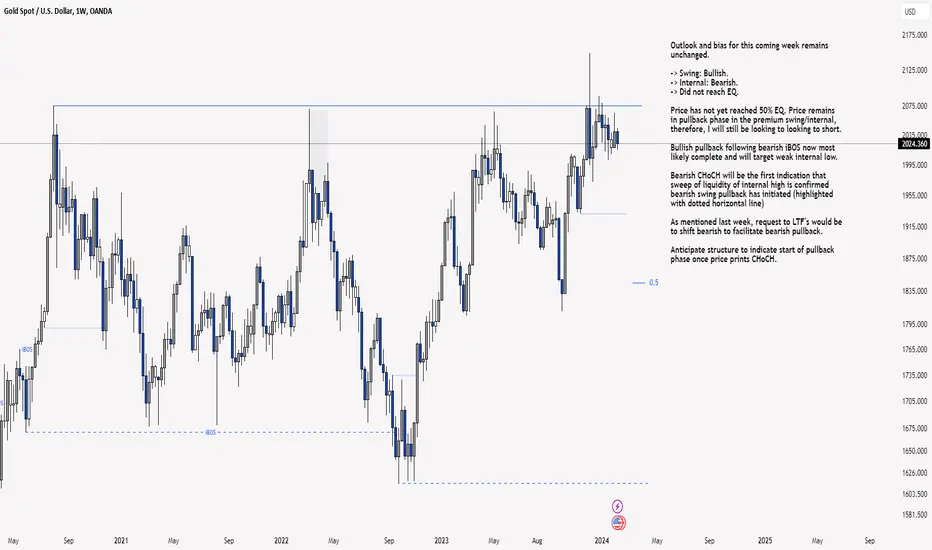
Outlook and bias for this coming week remains unchanged.
-> Swing: Bullish.
-> Internal: Bearish.
-> Did not reach EQ.
Price has not yet reached 50% EQ. Price remains in pullback phase in the premium swing/internal, therefore, I will still be looking to looking to short.
Bullish pullback following bearish iBOS now most likely complete and will target weak internal low.
Bearish CHoCH will be the first indication that sweep of liquidity of internal high is confirmed bearish swing pullback has initiated (highlighted with dotted horizontal line)
As mentioned last week, request to LTF's would be to shift bearish to facilitate bearish pullback.
Anticipate structure to indicate start of pullback phase once price prints CHoCH.
Weekly Chart:
Daily Analysis:
Bias has remained unchanged since last week:
-> Swing: Bullish.
-> Internal: Bearish
-> Has reached EQ.
Price pulled back following bearish iBOS as per expectation.
Price has failed to close above strong internal high whereby we are now in premium EQ of the internal range.
Price remains, as last week, to be trading within internal high and low.
Expectation: Price to target weak internal low.
As per analysis of last week, In the event price continues to trade bullish, which it did, the likely scenario is for price to trade up to strong internal high before continuing bearish internal order flow which remains active.
Daily Chart:
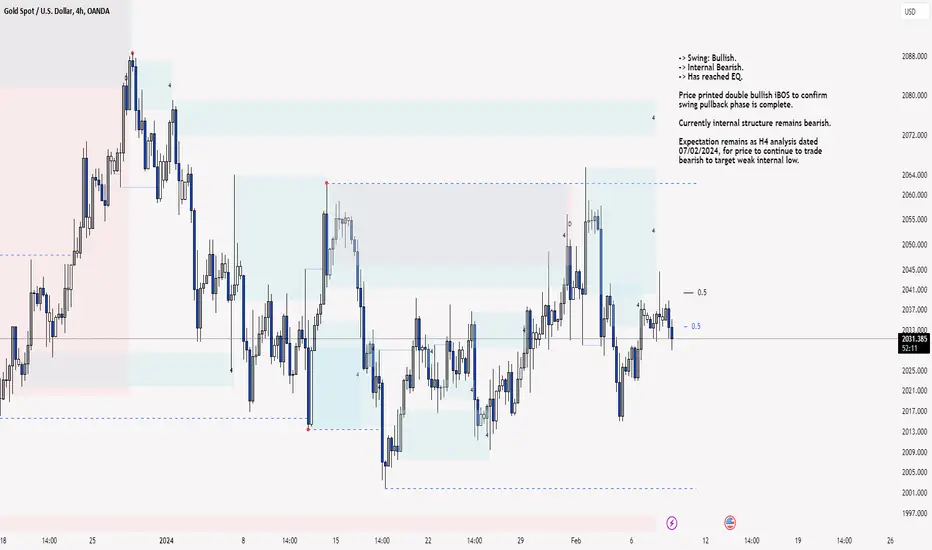
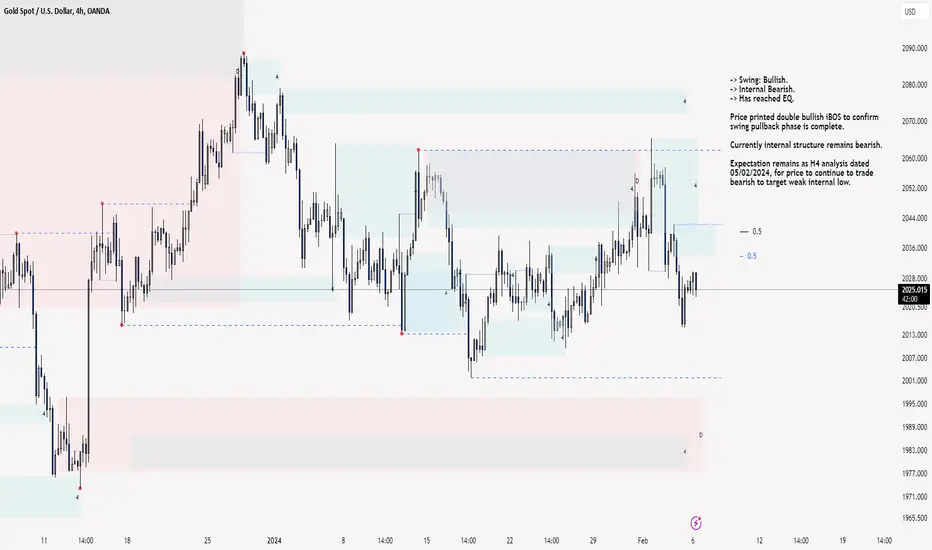
H4 Analysis:
-> Swing: Bullish.
-> Internal Bearish.
-> Has reached EQ.
Price printed double bullish iBOS to confirm swing pullback phase is complete.
Currently internal structure remains bearish.
Expectation remains as H4 analysis dated 09/02/2024, for price to continue to trade bearish to target weak internal low.
H4 Chart:
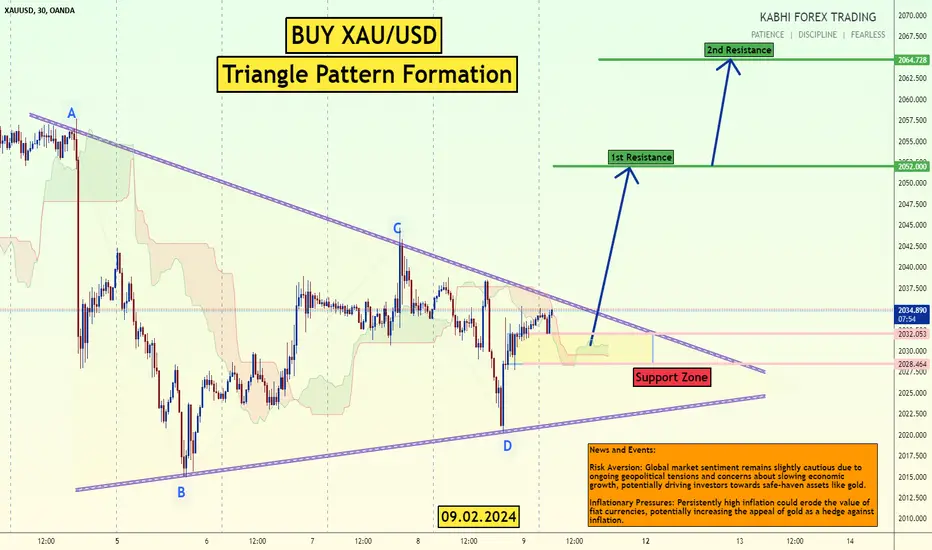
Buy XAUUSD Triangle PatternThe XAU/USD pair on the M30 timeframe displays a potential buying opportunity due to a recent a symmetrical triangle pattern.
Key Points:
The price has been trading within a symmetrical triangle formation characterized by converging support and resistance lines. This often indicates indecision before a decisive move.
Buy Entry: Consider entering a long position around the current price of 2034, offering an entry point close to the breakout level.
Target Levels: Initial bullish targets lie at the resistance levels of 2052 and 2064, marking previous resistance zones within the triangle.
Stop-Loss: To manage risk, place a stop-loss order below the support line of the broken triangle at 2026. This helps limit potential losses if the price reverses and breaks back down.
Thank you
XAU/USD 09 Feb 2024 Intraday AnalysisH4 Analysis:
-> Swing: Bullish.
-> Internal Bearish.
-> Has reached EQ.
Price printed double bullish iBOS to confirm swing pullback phase is complete.
Currently internal structure remains bearish.
Expectation remains as H4 analysis dated 07/02/2024, for price to continue to trade bearish to target weak internal low.
H4 Chart:
M15 Analysis:
-> Swing: Bullish.
-> Internal: Bullish.
-> Sub-Internal: Bearish.
-> Has reached EQ.
Following swing BOS price very aggressively pushed to the upside.
Price has printed a bullish iBOS where we are now in the pullback phase.
Sub-structure to internal structure, which is marked in red printed bullish iiBOS followed by a bearish iiBOS. Pullback phase currently underway.
Intraday expectation is for price to target weak internal low priced at 2001.895
M15 Chart:
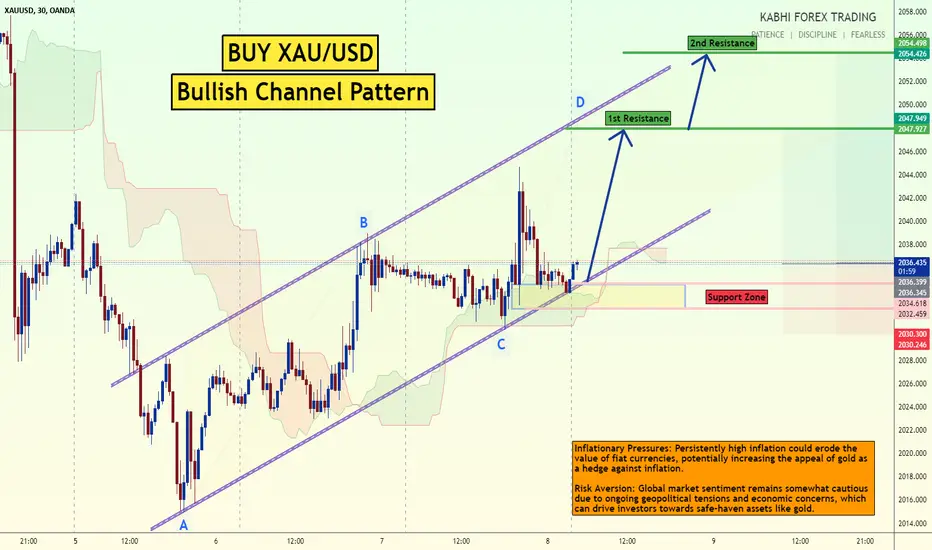
Buy XAUUSD Bullish ChannelThe XAU/USD pair on the M30 timeframe presents a potential buying opportunity due to a well-defined bullish channel pattern. This pattern suggests ongoing buying pressure and a higher likelihood of further advances in the coming minutes or hours.
Key Points:
Bullish Channel: The price has been trading within an upward-sloping channel defined by two converging lines: a rising support line and a rising resistance line. This ongoing uptrend signals continued buying pressure.
Buy Entry: Consider entering a long position around the current price of 2036.50, which sits close to the channel support. This could offer an entry point near a potential continuation of the upward move.
Target Levels: Initial bullish targets lie at the resistance levels of 2047.92 and 2054.50, marking previous resistance zones within the channel.
Stop-Loss: To manage risk, place a stop-loss order below the support line of the broken channel, around 2030. This helps limit potential losses if the price reverses and breaks back down.
Thank you
XAU/USD SELL - 07/02/2024Dear Students,
I trust you're all eager to explore the fascinating world of trading. Today, I want to walk you through the rationale behind a hypothetical sell position in gold in 2051, leveraging a supply zone strategy.
1. Identifying the Historical Supply Zone:
Upon thorough analysis of historical price charts, a prominent supply zone was identified at the price level of 2051. This zone represented a region where sellers historically dominated, creating a robust resistance level that had consistently held over time.
2. Technical Analysis:
The decision to initiate a sell position was heavily influenced by technical indicators. The presence of the supply zone, coupled with other bearish technical signals like overhead resistance, reversal candlestick patterns, or negative momentum indicators, provided a compelling case for a potential downward movement in gold prices.
3. Fundamental Analysis:
Fundamental factors were also considered in conjunction with the technical signals. If economic conditions, central bank policies, or geopolitical events aligned with the technical signals within the supply zone, it bolstered the conviction behind the sell decision.
4. Global Economic Conditions:
Understanding the broader economic landscape was pivotal. Factors such as interest rate decisions, economic indicators, and currency movements that interacted with the supply zone were carefully analyzed to anticipate potential catalysts for a downward price movement.
5. Market Sentiment and Supply Zone Dynamics:
The supply zone wasn't just a technical level; it also resonated with market sentiment. If there were indications of increased selling interest or a shift in sentiment aligning with the supply zone, it added another layer of confidence to the sell decision.
6. Diversification within the Supply Zone:
Initiating the sell position within the supply zone was strategic for portfolio diversification. By entering the market at a historically significant level, the trade aimed not only for potential profits but also to minimize risks associated with potential market reversals.
7. Short-Term Perspective:
This sell position was approached with a short-to-medium-term perspective, anticipating a potential price decline within the context of the identified supply zone.
8. Risk Management within the Supply Zone:
Robust risk management strategies were integral to this hypothetical trade. Setting stop-loss orders and closely monitoring price movements within the supply zone were paramount to control potential losses.
Remember, this discussion is intended for educational purposes, and trading decisions should be based on a comprehensive analysis of both technical and fundamental factors. If you have any questions or would like further clarification, feel free to reach out.
Happy learning,

2/6/24 Gold BuyStopTruth be told, I initially was liking this for a sell order however , technical, momentum, DXY all tell me i should really place a buy order.
I like this entry, I never place pending orders before 0850 EST.
XAU/USD 06 Feb 2024 Intraday AnalysisH4 Analysis:
-> Swing: Bullish.
-> Internal Bearish.
-> Has reached EQ.
Price printed double bullish iBOS to confirm swing pullback phase is complete.
Currently internal structure remains bearish.
Expectation remains as H4 analysis dated 05/02/2024, for price to continue to trade bearish to target weak internal low.
H4 Chart:
M15 Analysis:
-> Swing: Bullish.
-> Internal: Bullish.
-> Sub-Internal: Bullish.
-> Has reached EQ.
Following swing BOS price very aggressively pushed to the upside.
Price has printed a bullish iBOS where we are now in the pullback phase.
Sub-structure to internal structure, which is marked in red has now printed a bullish iiBOS.
Intraday expectation is for price to target weak internal high.
M15 Chart:
XAU/USD 05 Feb 2024 Intraday AnalysisH4 Analysis:
-> Swing: Bullish.
-> Internal Bearish.
-> Has reached EQ.
Price printed double bullish iBOS to confirm swing pullback phase is complete.
Currently internal structure remains bearish.
Price has once again to reacted to Daily and H4 nested supply levels where we saw a noticeable reaction. Price wicked above high of internal structure but failed to close above.
Expectation remains as H4 analysis dated 04/02/2024, for price to continue to trade bearish to target weak internal low.
H4 Chart:
M15 Analysis:
-> Swing: Bullish.
-> Internal: Bearish.
-> Sub-Internal: Bullish
-> Has reached EQ.
Following swing BOS price very aggressively pushed to the upside.
Price has printed a bullish iBOS where we are now in the pullback phase.
Sub-structure to internal structure, which is marked in red has now printed a bearish iiBOS to align with internal bearish order-flow.
Expectation is for price to target weak internal low.
M15 Chart:

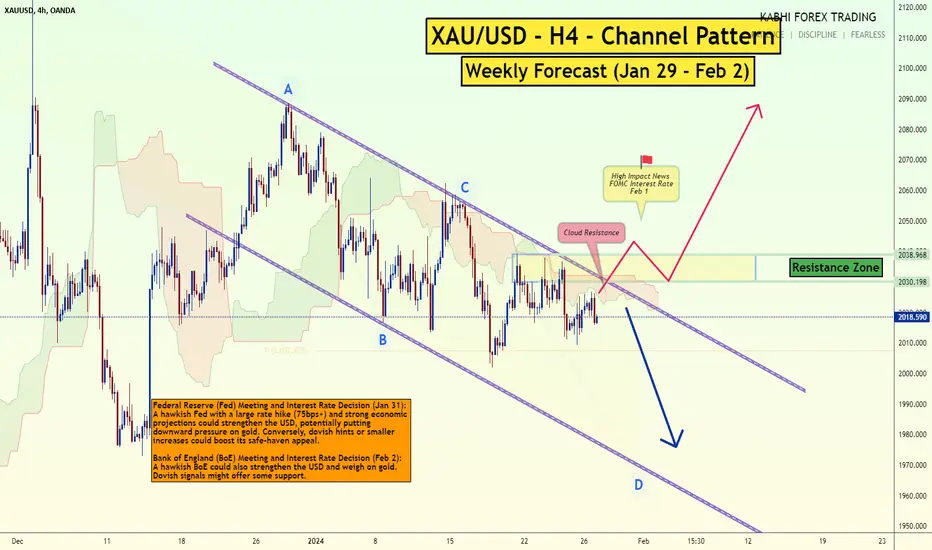
XAUUSD H4 Channel PatternThe XAU/USD pair on the H4 chart currently showcases a bearish channel pattern, hinting at potential selling opportunities in the coming days. However, a breakout above the channel could present potential buy opportunities.
Sell Opportunity:
1.A potential sell entry could be considered around the current price as it sits closer to the channel resistance. This allows for some buffer before a potential downward move.
2.Targets for the bear case would be the lower support line of the channel or potentially even lower depending on bearish momentum and confirmation from other technical indicators.
Shifting to Buy:
1.A break above the upper resistance line of the channel would signal a breakdown of the bearish trend, opening up potential buy opportunities.
2.Entry points for buying could be considered just above the broken resistance or on a retest of the broken line.
3.Targets for the bull case would be the previous swing highs within the channel or higher depending on bullish momentum and confirmation from other technical indicators.
Central Bank Decisions:
Federal Reserve (Fed) Meeting and Interest Rate Decision (Jan 31): A hawkish Fed with a large rate hike (75bps+) and strong economic projections could strengthen the USD, potentially putting downward pressure on gold. Conversely, dovish hints or smaller increases could boost its safe-haven appeal.
Bank of England (BoE) Meeting and Interest Rate Decision (Feb 2): A hawkish BoE could also strengthen the USD and weigh on gold. Dovish signals might offer some support.
US Non-Farm Payrolls (Feb 2): A robust US jobs report might reinforce hawkish Fed expectations and weigh on GBP/USD. Conversely, weaker data could dampen USD strength and lend some support to the pound.
If you found my post helpful or informative, could you please leave a comment 💬🖌 and hitting that like button💚💚
“Markets are never wrong, but opinions often are.”-Jesse Livermore
Good Luck💛💛
Thank you
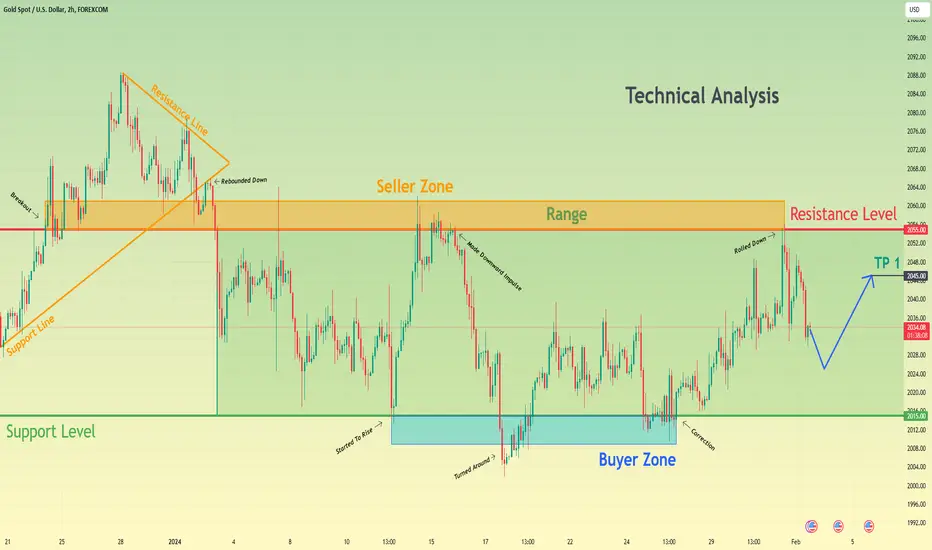
Gold can fall little more, turn around, and start to move upHello traders, I want share with you my opinion about Gold. Observing the chart, we can see that the price a not long time ago bounced from the support line and made an upward impulse to the resistance line of the pennant, thereby breaking the 2055 resistance level, which coincided with the seller zone. After this movement, Gold rebounded from the resistance line and started to decline to the resistance level, and after it fell, the price exited from the pennant pattern. Next, Gold broke the resistance level one more time and entered to range, where it declined to the 2015 support level, which coincided with the buyer zone with the bottom part. After this, the price started to rise and in a short time rose to the seller zone, but soon turned around and made a downward impulse lower even the buyer zone. Then price soon backed up to the range and some time traded near the support level, after which made a correction to this level and in a short time rose to the resistance level. But a not long time ago price rebounded from this level and started to fall. Now, I think Gold can decline to 2025 points, after which it turns around and starts to move up, therefore I set my target at the 2045 level. Please share this idea with your friends and click Boost 🚀
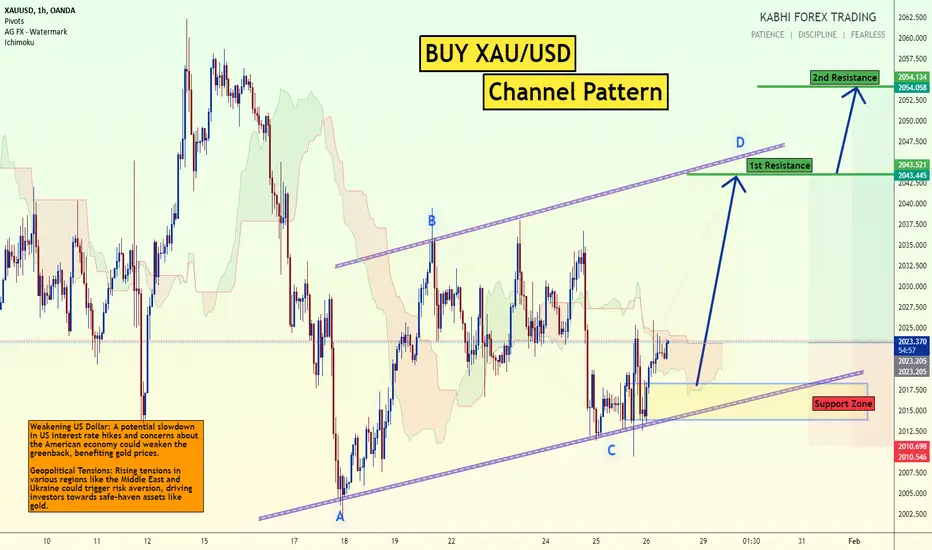
Buy XAUUSD Channel PatternGold (XAU/USD) might be gearing up for a climb, showcasing a bullish channel pattern on its H1 chart. This pattern suggests a gradual increase in buying pressure, potentially leading to a breakout towards higher prices.
Bullish Channel: The price has been oscillating within a channel with rising support and resistance lines, forming a Shape. This often indicates building buying pressure as the price range narrows.
Buy Entry: Consider entering a long position around the current price of 2023, which offers a potential entry point near the channel support.
Target Levels: Initial bullish targets lie at the resistance levels of 2043 and 2054, marking the upper boundaries of the channel.
Stop-Loss: To manage risk, place a stop-loss order below the channel support at 2013.
Key Points:
Weakening US Dollar: A potential slowdown in US interest rate hikes and concerns about the American economy could weaken the greenback, benefiting gold prices.
Geopolitical Tensions: Rising tensions in various regions like the Middle East and Ukraine could trigger risk aversion, driving investors towards safe-haven assets like gold.
GOLD | Jan 23Have entered shorts here as explained in the previous idea. I doubt the full swing to the anticipated area, will be monitoring the price action closely
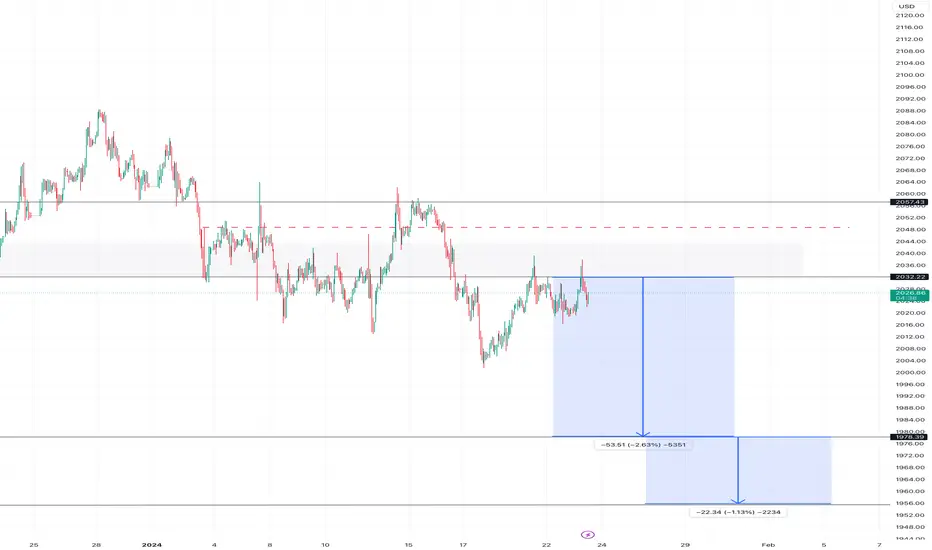
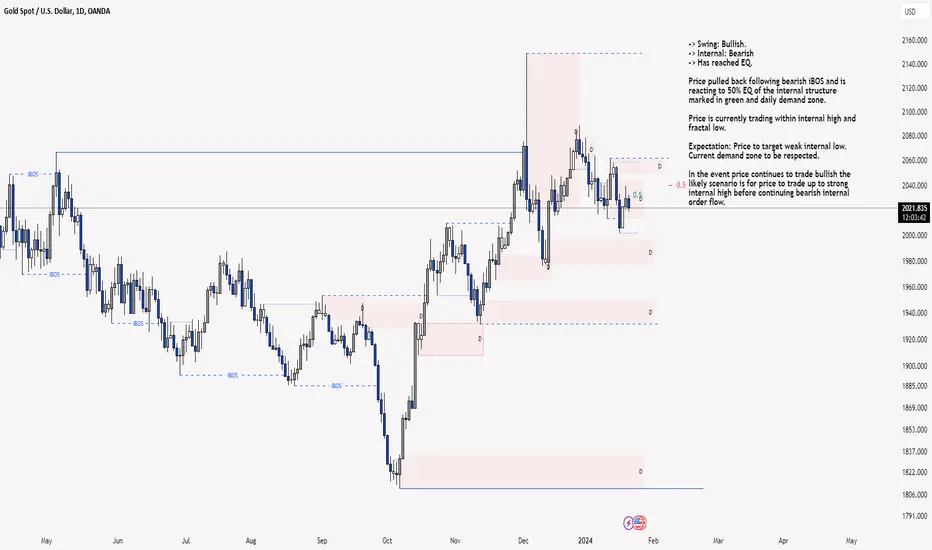
XAU/USD 22 Jan 2024 Daily Analysis-> Swing: Bullish.
-> Internal: Bearish
-> Has reached EQ.
Price pulled back following bearish iBOS and is reacting to 50% EQ of the internal structure marked in green and daily demand zone.
Price is currently trading within internal high and fractal low.
Expectation: Price to target weak internal low. Current demand zone to be respected.
In the event price continues to trade bullish the likely scenario is for price to trade up to strong internal high before continuing bearish internal order flow.
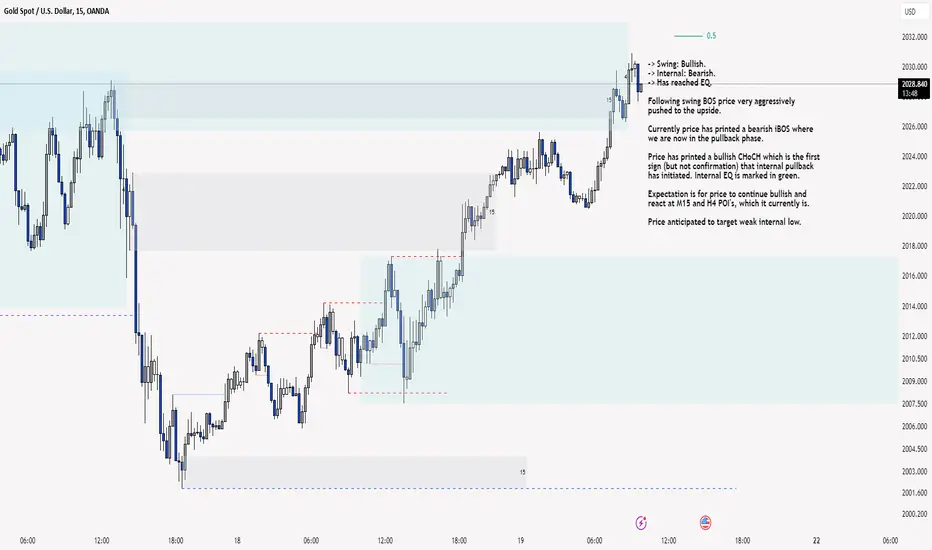
XAU/USD 19 Jan 2024 Intraday Analysis -> Swing: Bullish.
-> Internal: Bearish.
-> Has reached EQ.
Following swing BOS price very aggressively pushed to the upside.
Currently price has printed a bearish iBOS where we are now in the pullback phase.
Price has printed a bullish CHoCH which is the first sign (but not confirmation) that internal pullback has initiated. Internal EQ is marked in green.
Expectation is for price to continue bullish and react at M15 and H4 POI's, which it currently is.
Price anticipated to target weak internal low.
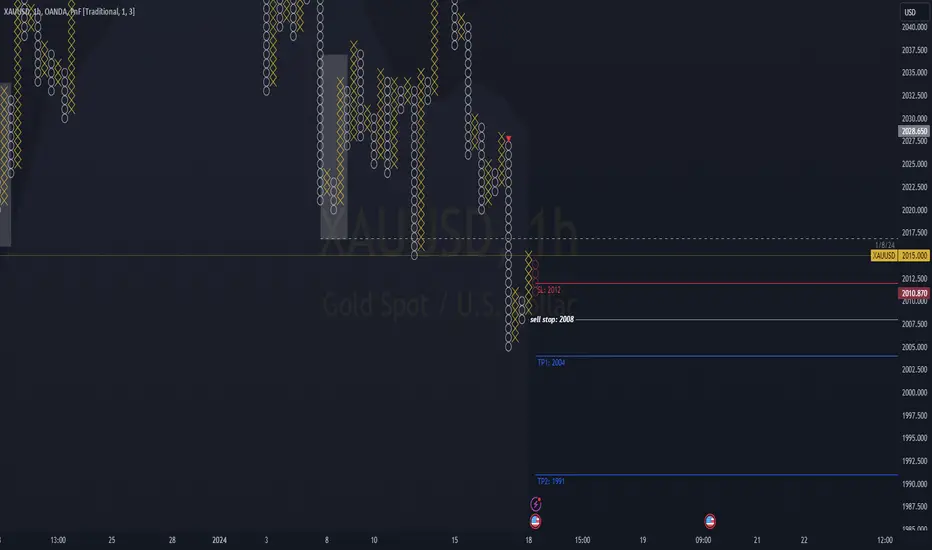
Sell Stop 1/18/24Yesterdays move went really well, while i projected total 240 pips, i chickened out at 85 pips net... move ended up completing the full 240 without me.
no major news today, regular risk
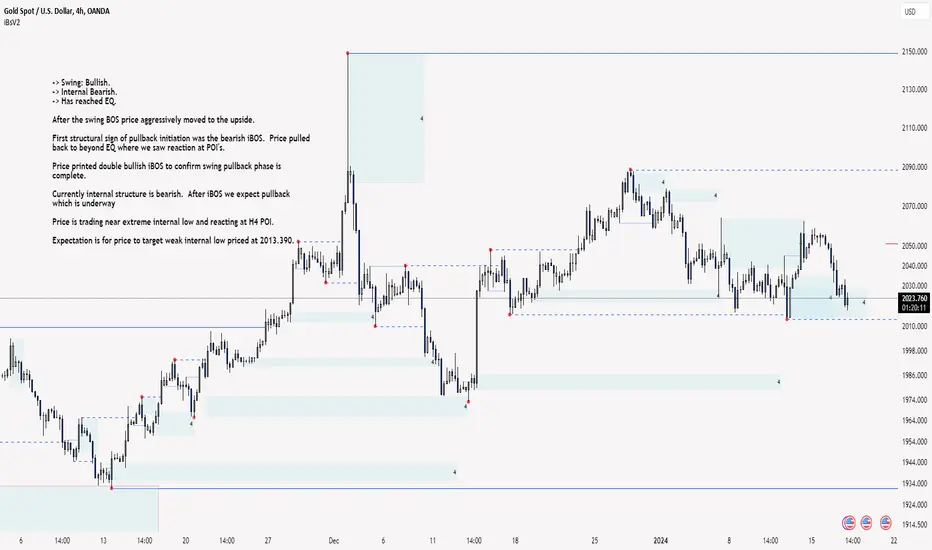
XAU/USD H4 ANALYSIS-> Swing: Bullish.
-> Internal Bearish.
-> Has reached EQ.
After the swing BOS price aggressively moved to the upside.
First structural sign of pullback initiation was the bearish iBOS. Price pulled back to beyond EQ where we saw reaction at POI's.
Price printed double bullish iBOS to confirm swing pullback phase is complete.
Currently internal structure is bearish. After iBOS we expect pullback which is underway
Price is trading near extreme internal low and reacting at H4 POI.
Expectation is for price to target weak internal low priced at 2013.390.