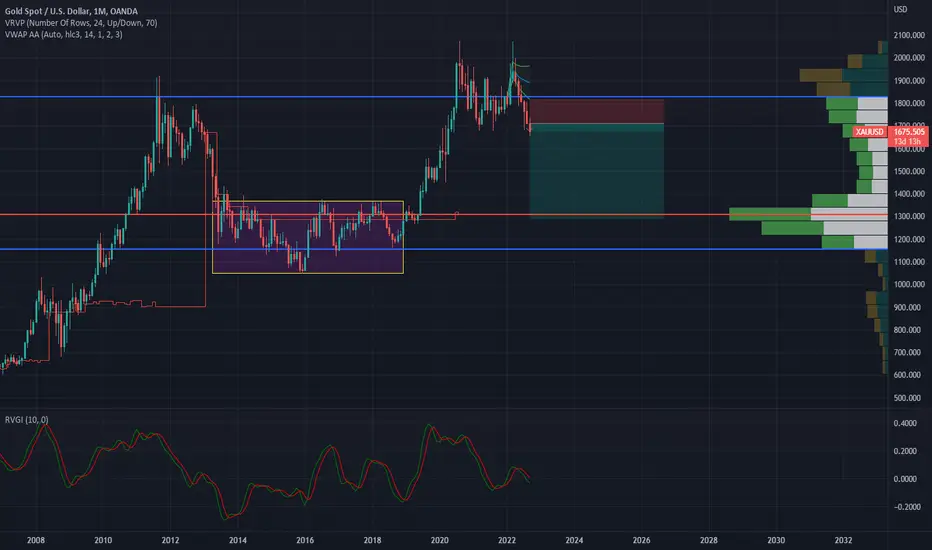
XAUWith more rate hikes on the cards, it looks to me that XAU will start a big fall very soon, and we could see price return to the range highlighted in the yellow box.
Xau-usd
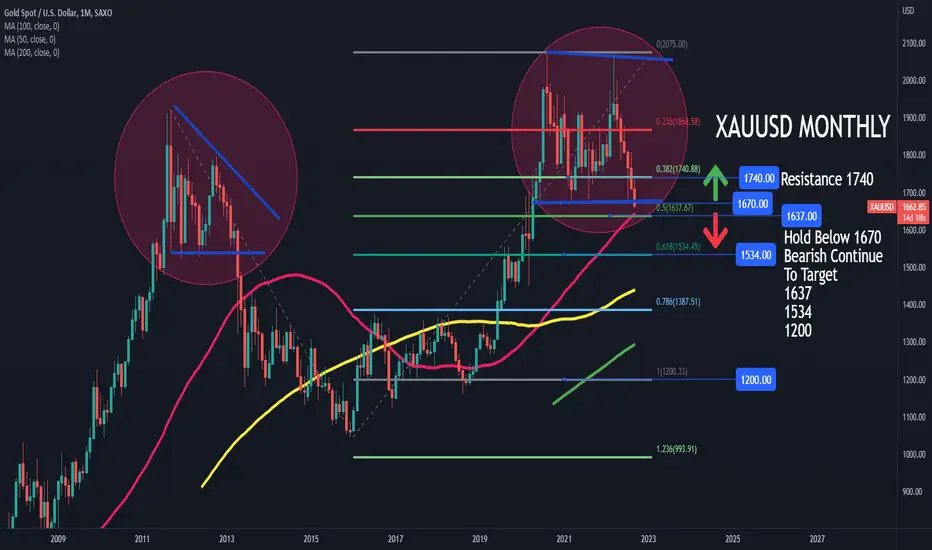
XAUUSD INVALIDATED ITS BULLISH VIEW? BELOW 1670 TARGET 1637Looking Back at Mar 22, 2021, We talked about XAUUSD in consolidation level.
Since that time, XAUUSD has tested its historical time and failed. Then reversed in deep correction.
As I said at previous idea Mar 22, 2021,
"Break and hold above 1925 would resume medium term bullish view to test 1990 and all time high 2075 level.
Break below 1660 would invalidate its bullish view."
Now, XAUUSD break below 1670 and 1660, invalidated its bullish view.
If XAUUSD Hold Below 1670 then its Bearish Continue To Target :
1637, 1534, and 1200.
Resistance at 1740.
Entry XAUUSD Buy 14/09/2022Details on chart - entry once price tapped with buy zone after ranging most of Asian
Gold Daily Analysis 14.09.2022Yesterday gold made a higher low near 1697. We can take a good longterm BUY with SL 1688 near this level.
The present value zone is trending up. Yesterday gold tested the support at lower level of value zone.
Today price may test to break yesterday low and if bulls are strong we will be good to make our higher high at 1742 by week end
In present level we should not sell
BUY 1702 SL 1688 TP 1742
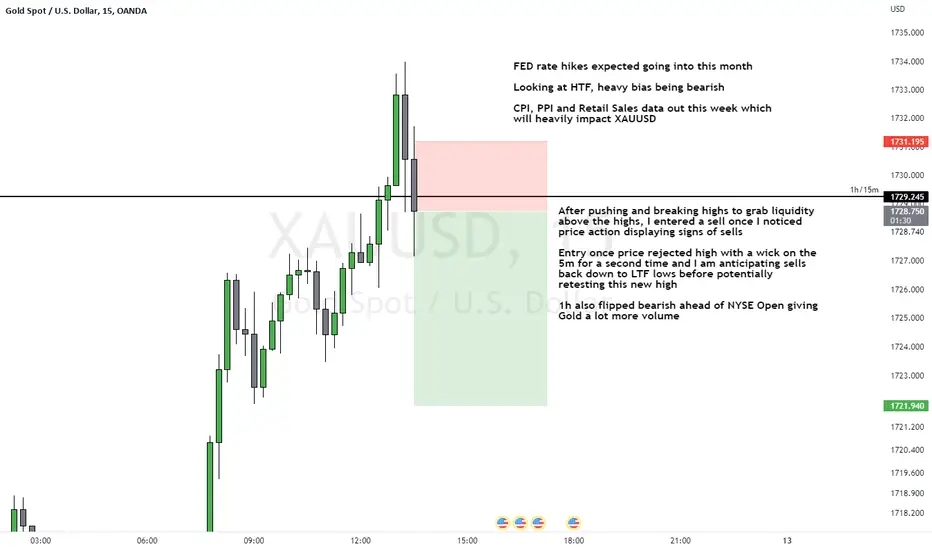
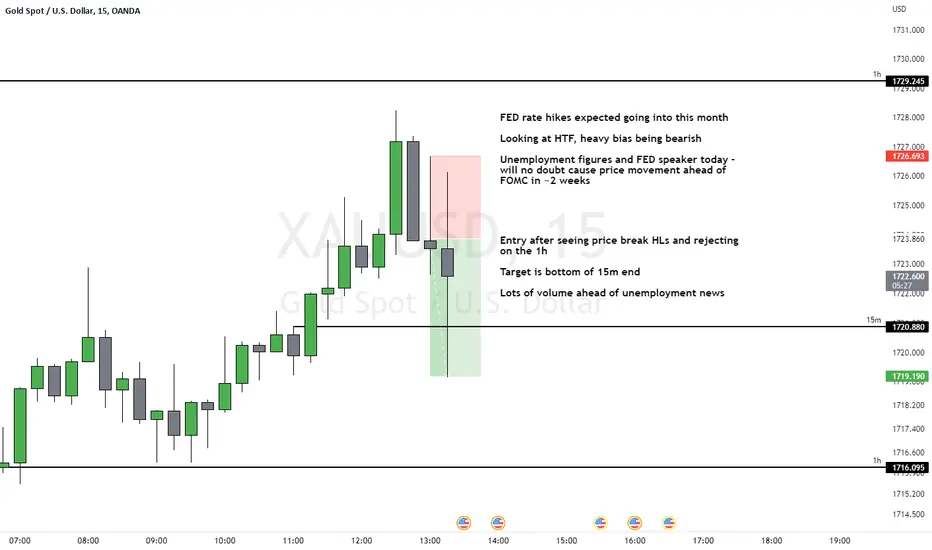
Entry XAUUSD Sell 13/09/2022Details on chart - entry once price broke the lows of the previous 15m candles after creating rejection wicks
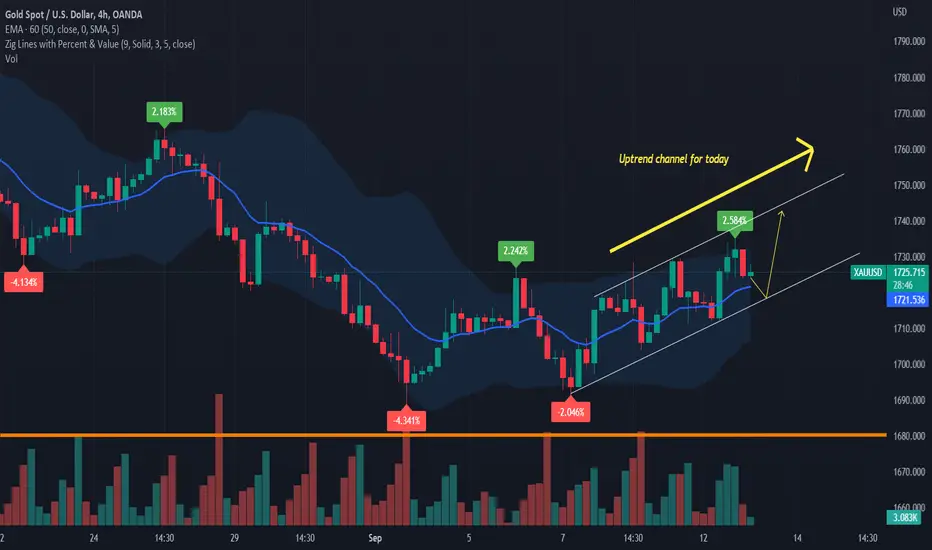
Gold Daily Analysis 13.09.2022Gold is in a uptrend value zone making small highs and lows.
Today Gold may test the resistance at 1743.
Present 1728 is weekly resistance. So we can expect any reversal from here if bulls are weaker. If price is able to sustain above this level in daily candle we will have this as support in next week.
Today we have important news in US time. So expect price to test its support or resistance levels then. If gold breaks the present value zone then it means a change in trend. The present uptrend value zone is formed recently and may not be strong. So dont go for longterm short even if price goes below this value zone.
The present setup is suggesting good reversal considering the double bottom formed in daily and 4 hour charts.
My trading idea for today
BUY 1718 SL 1708 TP 1742
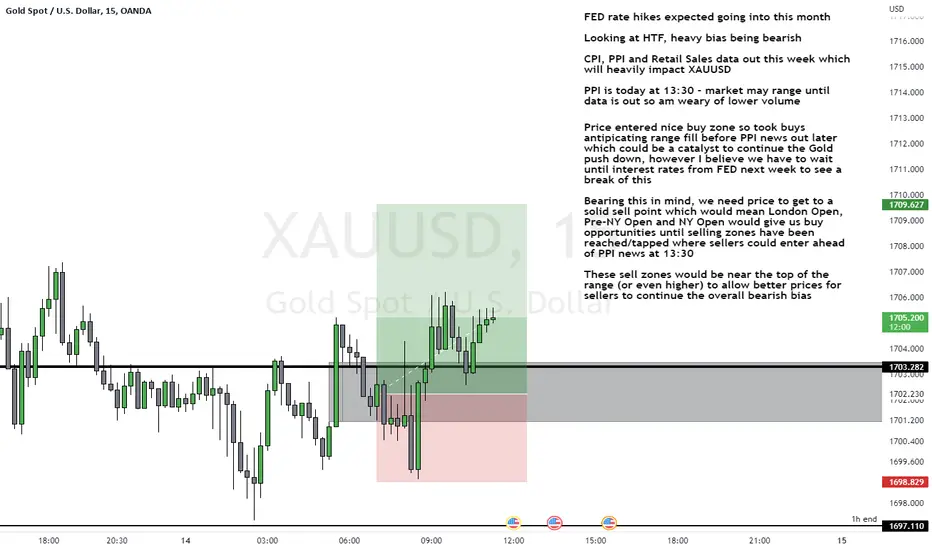
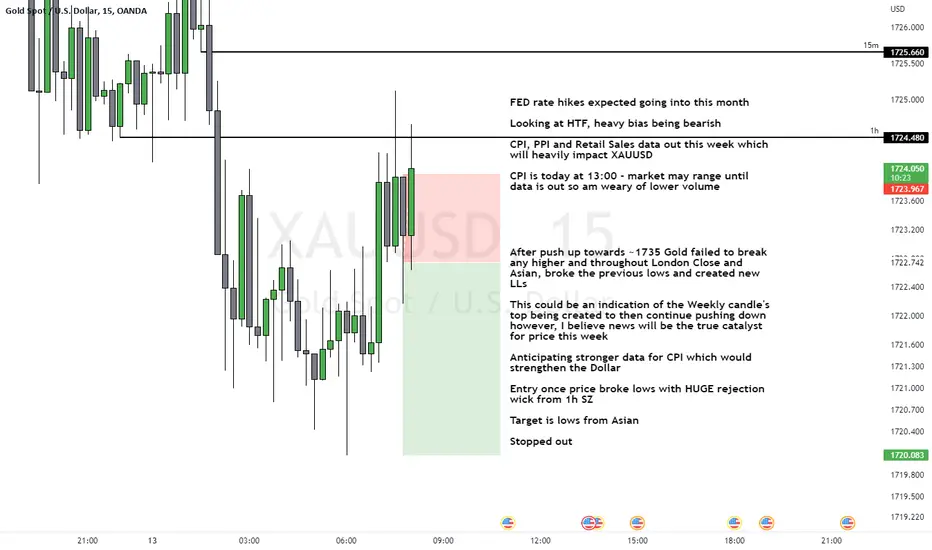
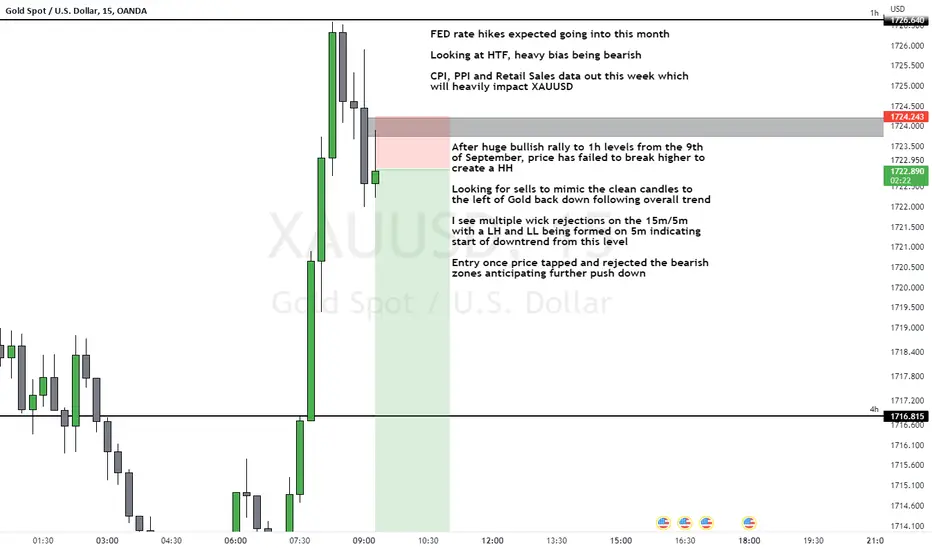
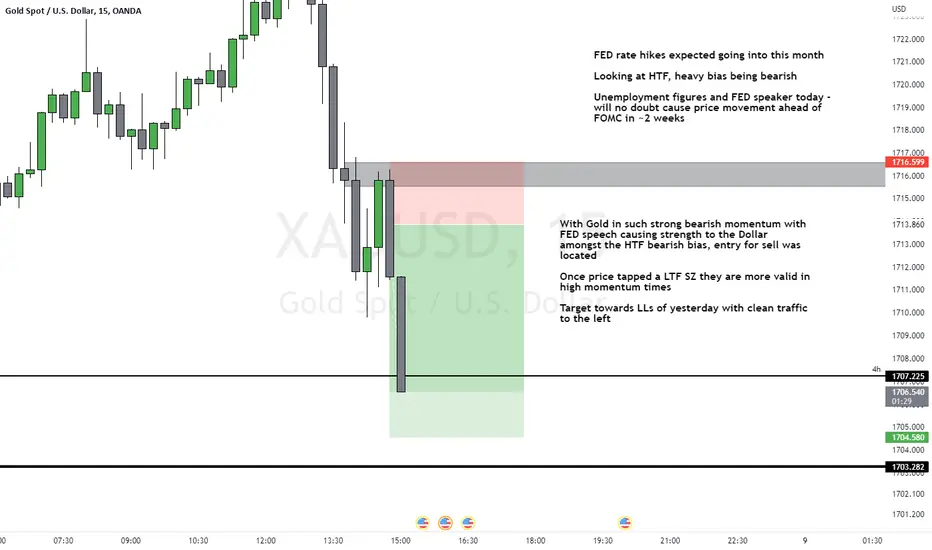
Entry XAUUSD Sell 12/09/2022Details on chart - fundamentals explained upcoming and technicals also on chart to help provide insight into this trade
Entry XAUUSD Sell 12/09/2022Details on chart - entry as shown on graph with fundamentals for Gold coming into more play later in the week
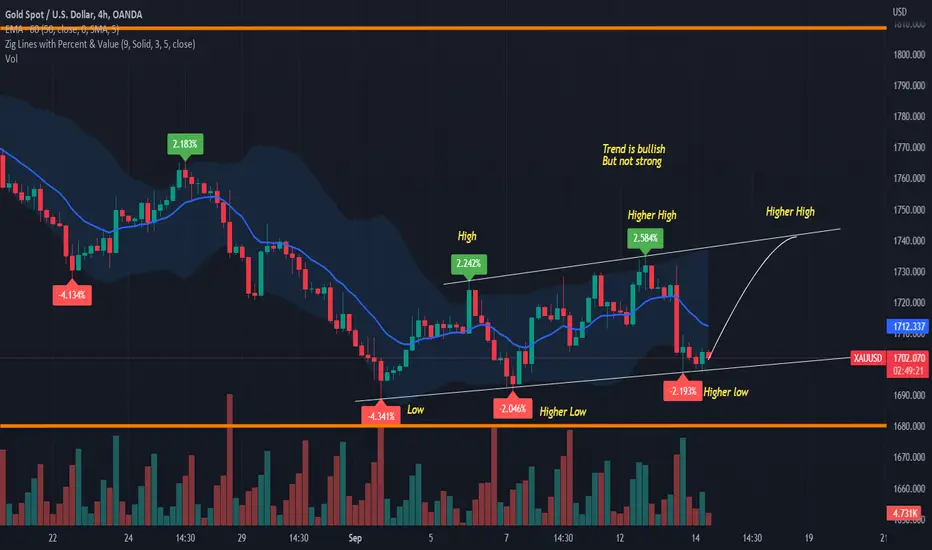
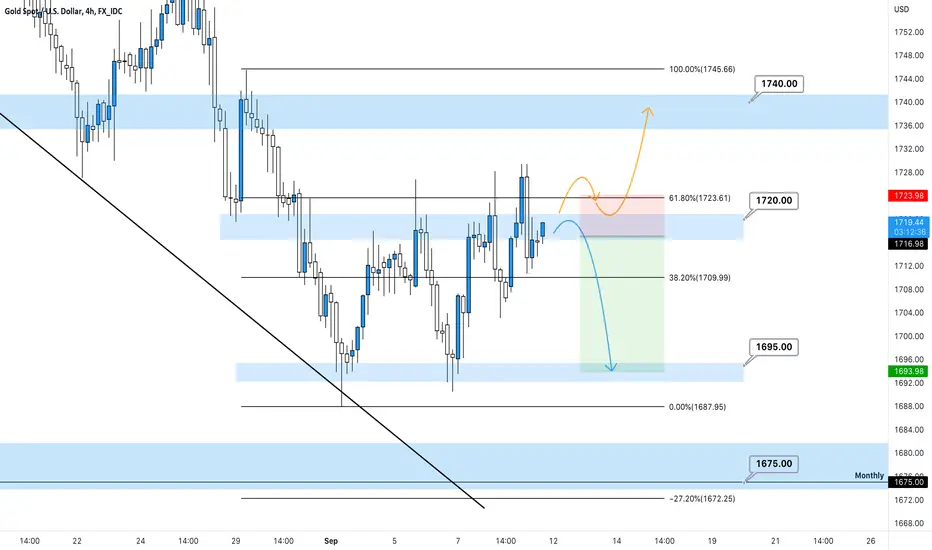
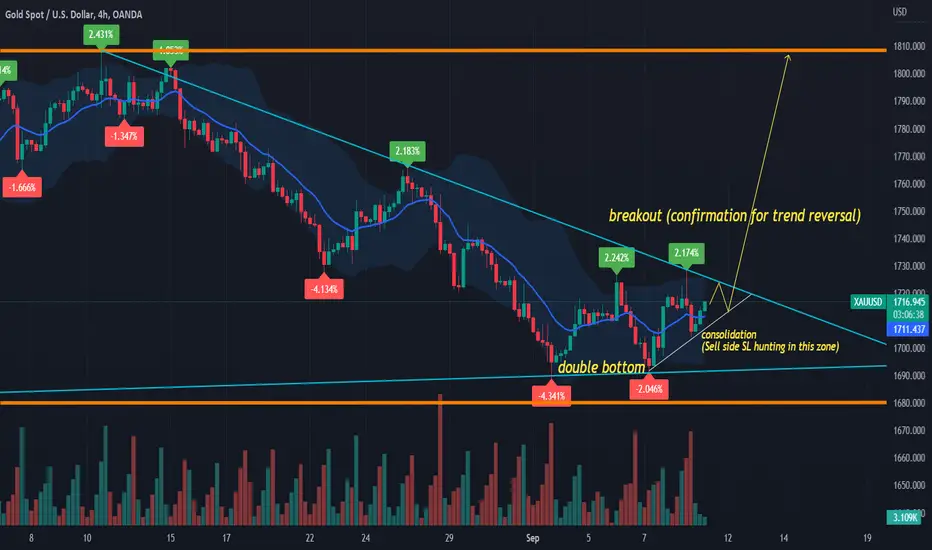
XAUUSD 4hour Analysis September 11th, 2022Gold Bearish idea
Weekly Trend: Bearish
Daily Trend: Bearish
4Hour Trend: Bearish
Trade scenario 1: We are still overall bearish and we can see price action attempted to break the range but failed to form above the zone at 1720.00
The most likely scenario is gold continuing the range it's in. If this happens look to target toward the bottom of the range.
Trade scenario 2: For us to consider gold bullish again we ideally need to see a bullish break of the range with a higher low above.
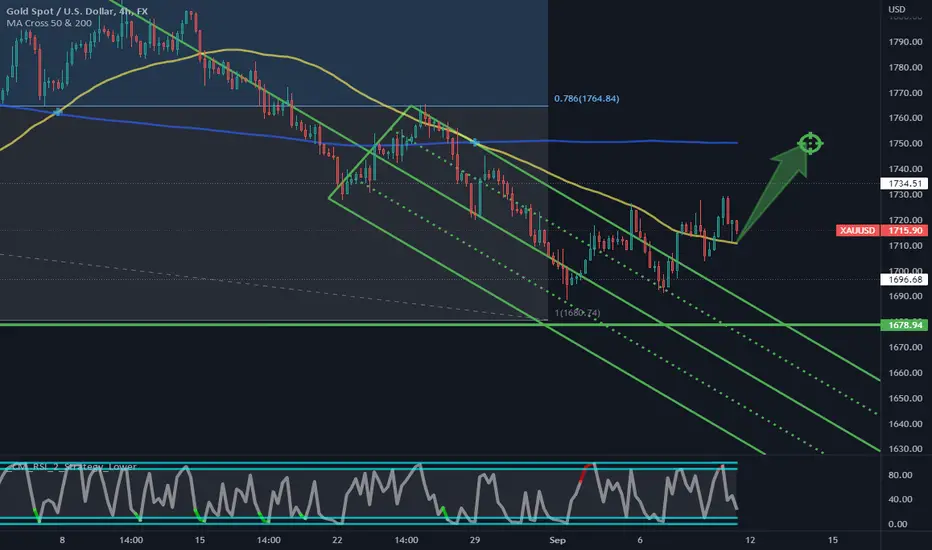
!!! GOLD !!! - Monday little up! (4H)Hi,
With one more week in the buy zone and the bear markets we will most likely have a small run up to 4 hour candles.
This is just an idea!
Take care!
Entry XAUUSD Sell 09/09/2022Details on chart - entry once price closed bearish on the LTFs rejecting zones
Gold Daily Analysis 09.09.2022Gold is consolidating after forming a double bottom by testing the support at 1690. However we need a breakout from the present sideways pattern above 1728 in daily chart for more bulls to show. Today is week close. So we can expect SL hunting on sell side. We can hope for the breakout next week.
SELL 1726 SL 1732 TP 1716
BUY 1706 SL 1696 TP 1726
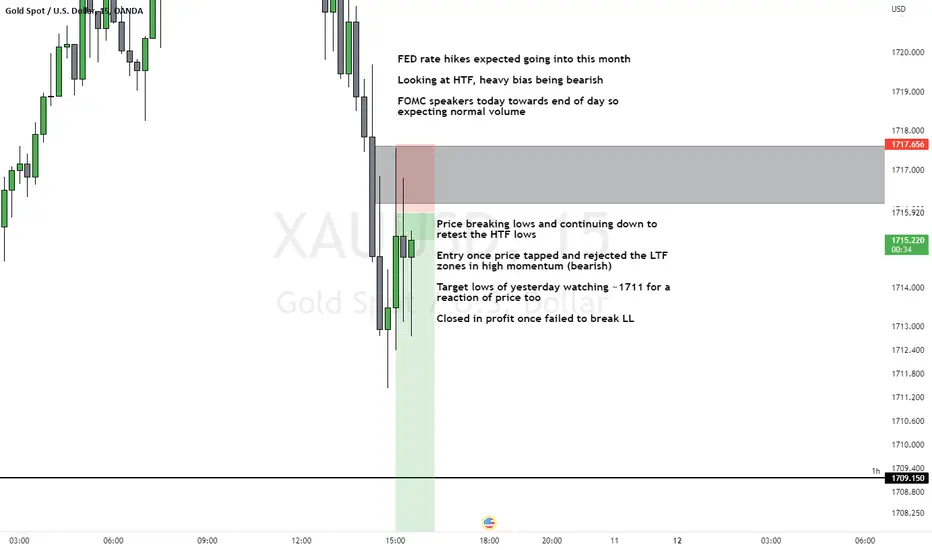
Entry XAUUSD Sell 08/09/2022Details on chart - entry once price closed bearish on the 1m/5m respecting the LTF zones ahead of strong momentum for the Dollar
Entry XAUUSD Sell 08/09/2022Details on chart - LTF entry with 15m target intended for price to tap into
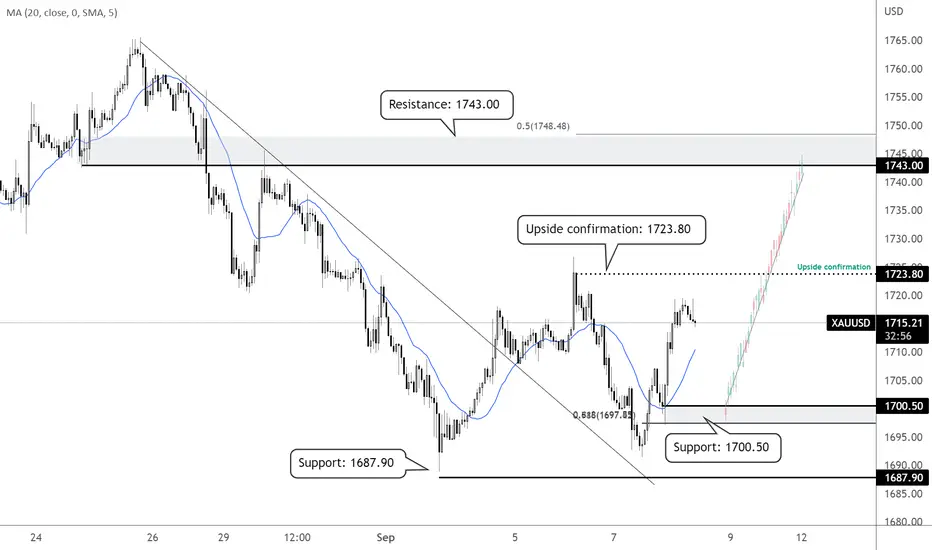
XAUUSD H1: Bullish outlook seen, further upside above 1700.50On the H1 time frame, a throwback to the support zone at 1700.50, in line with the Fibonacci confluence levels and M30 demand chain could present an opportunity to play the bounce to the resistance zone at 1743.00. A break above our upside confirmation level at 1723.80 which is also the swing high resistance could provide the bullish acceleration to the resistance zone at 1743.00. 20 SMA is showing signs of bullish pressure as well with prices holding above the SMA.
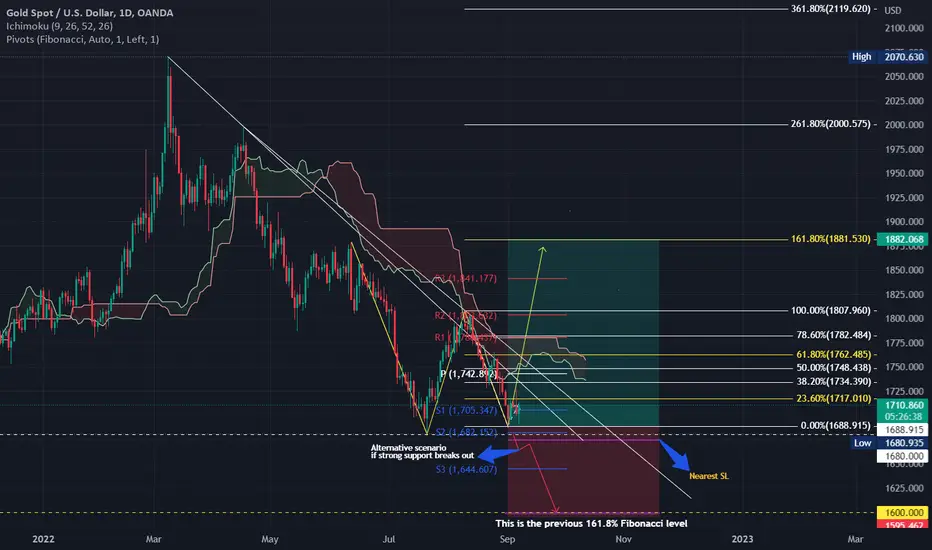
XAUUSD Swing Trading PlanEntry price: fibonacci level 23,6% ->(valid if price closes above 23.6% Fibonacci level)
TP1 : 1762 ->fibonacci level 61,8%
TP2: 1881.5 ->fibonacci level 161,8%
SL1: Below Fibonacci level 0% or it can be under strong support 1880
Alternative SL: can be made also at the price of 1675 let the price breathe a little
SL2: you can make a stop loss right at the price of 1600 (previous of Fibonacci 161.8%) or you can make it below
All valid if the price today or tomorrow manages to close above the Fibonacci level 23.6%
or alternatively buy at the price of 1680 it is strong support most likely the price will bounce from there you can set the RR at 1:2 to be safe :_)
good luck!!!