XAUUSD Video Analysis Brief – Weekly Forecast Summary (2025)This video summarizes the key scenarios and technical outlook for Gold (XAUUSD) on the weekly timeframe, integrating both Fibonacci-based projections and macro fundamentals.
Core Setup
Gold is currently positioned near the 161.8% Fibonacci extension (~$3,276).
A breakout toward $3,500 is possible before a potential corrective move.
Scenario 1: Bullish Continuation
Gold breaks above $3,435 → rallies to $4300 → continues toward major Fibonacci targets:
TP: $4,320, which is the Fibonacci level 261.8%
Scenario 2: Correction First
Gold fails to hold above $3,435 → triggers a healthy correction to:
TP1: $2,920
TP2: $2,650
If support 161.8% level holds in the correction zone, a renewed bullish phase is expected.
Macro Alignment
Central bank gold buying (notably BRICS) supports the long-term bid.
Fed policy leaning dovish → tailwinds for gold.
Inverse correlation with DXY:
DXY below 98.95 → bullish for gold
DXY above 100 → signals correction
Effect on Altcoins
If correction is risk-on driven, capital may rotate into altcoins.
If triggered by macro stress or USD strength, alts may fall alongside gold.
This analysis offers a multi-scenario framework to navigate the next major moves in gold, with key levels to watch for traders, investors, and macro analysts alike.
Xaudollar

Gold (XAUUSD) Weekly TF 2025Overview
This analysis outlines the structural Fibonacci confluences, scenario planning, and macro-aligned projections for Gold (XAUUSD) on the weekly timeframe. It integrates multi-layered Fibonacci extensions and retracements, mapping out key support and resistance levels, and proposes a nuanced primary scenario that includes both intermediate rallies and corrective movements.
Primary Scenario – Multi-Stage Movement Hypothesis
We anticipate that gold may initially extend higher from the current level (~$3,325) to test the 127.2% Fibonacci extension at $3,435, with the possibility of a further intermediate peak near $3,500. This level marks a psychological and technical resistance zone and could act as a temporary top.
Following this local peak, a corrective phase may unfold. This pullback could evolve into one of the two outlined correction scenarios:
1 TP Correction Scenario
Support Target: ~$2,950
Basis: 100% Fib extension confluence and prior resistance turned support
Expected Outcome: Price stabilizes at this level and resumes upward momentum
2 TP Correction Scenario
Support Target: ~$2,650
Basis: Strong historical structure + 100% Fib confluence from a broader cycle
Expected Outcome: This zone acts as a long-term demand accumulation area
Upon completion of the corrective structure, we expect gold to reinitiate its primary bullish trend.
Bullish Continuation Targets
TP1: ~$4,050 (161.8% Fibonacci extension)
TP2: ~$4,319 (261.8% Fibonacci extension)
These targets align with macroeconomic conditions, central bank accumulation trends, and long-term structural cycles.
Supporting Technicals
RSI: Holding above 50, indicating preserved bullish momentum
MACD: Positive crossover with widening histogram on weekly timeframe
Price Action: Strong support zone between $3,280–$3,300 aligning with 161.8% Fib retracement of the recent minor wave
Macro Fundamentals & Correlations
Central Bank Gold Demand: Sustained net buying by BRICS nations, particularly China and Russia, supports the structural bid on gold
Fed Policy: Market anticipates a prolonged pause or gradual rate cuts, favoring non-yielding assets like gold
DXY & US10Y Yields: Any further decline in DXY or softening yields would add tailwinds to gold
Crypto Correlation: During inflationary hedging or systemic risk periods, gold and crypto may correlate positively, especially with weakening USD
Intermarket Relationships: Gold, DXY, and TOTAL (Crypto Market Cap)
Gold vs. DXY (US Dollar Index)
Gold historically maintains an inverse correlation with DXY. A rising DXY tends to apply downward pressure on gold prices, while a falling DXY enhances gold's upside momentum.
Scenario Interactions:
If DXY breaks below 98, this could validate the bullish scenario for gold toward $3,435–$4,050.
If DXY rallies back above 100, it could trigger the correction scenarios ($2,950 or $2,650) in gold.
Gold vs. TOTAL (Crypto Market Cap)
Gold and TOTAL may show positive correlation during periods of USD weakening and global liquidity expansion.
Scenario Interactions:
If gold rallies toward $3,500 and TOTAL also breaks key resistance (e.g., $1.8T–$2T), this signals synchronized bullish risk appetite.
If gold corrects while TOTAL continues to rise, it could indicate rotation of liquidity from defensive to risk-on assets.
A simultaneous correction in both may occur if DXY strengthens aggressively or if macro shocks reduce global liquidity.
These intermarket relationships should be monitored continuously to assess the evolving macro context and validate the chosen scenario.
In the case of a gold correction toward $2,950 or $2,650, the impact on altcoins will hinge on the prevailing macroeconomic backdrop. If the correction stems from a healthy, technical rebalancing within a risk-on environment—without a concurrent surge in the U.S. dollar—it could signal a shift in capital from defensive assets like gold into more speculative plays, including altcoins. This type of capital rotation often benefits the crypto market, particularly if TOTAL (crypto market cap) holds or advances structurally. However, if the correction is caused by rising dollar strength, tightening financial conditions, or broader risk-off sentiment, altcoins may instead suffer alongside gold, as liquidity is withdrawn across the board. Therefore, the context and drivers behind gold’s correction are crucial in assessing its downstream effects on altcoin performance.
From a philosophical lens, gold's cyclical ascent and retreat mirrors the rhythm of nature and human experience—expansion, contraction, and renewal. Just as rivers carve valleys before surging toward the ocean, the market too must surrender gains to gather force. A correction in gold is not merely a financial event, but a moment of recalibration—an inhale before the next exhale of momentum. It invites reflection: whether wealth seeks refuge or ventures into risk, whether fear contracts or ambition expands. In this interplay, altcoins may inherit the restless spirit of capital in search of yield, as gold, the ancient anchor of value, briefly pauses in its timeless journey.
Conclusion
We present a multi-phased path for gold where:
An initial bullish breakout toward $3,435–$3,500 forms a short- to mid-term peak
A subsequent correction brings gold to either $2,950 or $2,650, depending on macro triggers
A renewed bull rally drives gold toward $4,050 and potentially $4,319 and beyond
This scenario reflects both the cyclical nature of market structure and the macro-fundamental backing that continues to support long-term gold strength.

XAU/USD 12 March 2024 Intraday AnalysisH4 Analysis:
-> Swing: Bullish.
-> Internal: Bearish.
Analysis/Bias remains the same as analysis dated 07 March 2024.
Price has printed a bullish CHoCH according to analysis and bias dated 28 February 2025.
Price is currently trading within an established internal range.
Intraday Expectation:
Price is now trading in premium of 50% internal EQ where we could see a reaction at any point. Price could also target H4 supply zone before targeting weak internal low, priced at 2,832.720
Note:
With the Federal Reserve's dovish stance and persisting geopolitical uncertainties, heightened volatility in Gold is expected to continue. Traders should proceed with caution and adjust risk management strategies in this high-volatility environment.
Price could also be driven by President Trump's policies, geopolitical moves and economic decisions which are sparking uncertainty.
H4 Chart:
M15 Analysis:
-> Swing: Bullish.
-> Internal: Bearish.
Analysis and bias remains the same as analysis dated 03 March 2023.
As mentioned in my analysis dated 28 February 2025, whereby price printed a bullish CHoCH but stated I would continue to monitor price.
On this occasion I have marked the previous bullish CHoCH in red as price did not pull back deeply enough to warrant internal structure breaks, additionally, there was minimal time spent .
Price has printed a further bullish CHoCH which is now confirmed. Price is not trading within an established internal range.
Intraday Expectation:
Price to continue bullish, react at either premium of internal 50% EQ, or M15 supply zone before targeting weak internal low priced at 2,832.720.
Note:
With the Federal Reserve maintaining a dovish stance and ongoing geopolitical tensions, volatility in Gold prices is expected to remain elevated. Traders should exercise caution, adjust risk management strategies, and stay prepared for potential price whipsaws in this high-volatility environment.
M15 Chart:

XAU/USD Poised for Short-Term Rise to New All-Time HighXAU/USD is expected to continue its rise in the short term, reaching a new all-time high (ATH) this week. After a period of ranging and consolidation, where the price remained within a relatively tight range, the upward momentum is expected to resume. This suggests a bullish sentiment in the market for the gold/US dollar currency pair. However, it is important to note that market trends are influenced by various factors and can change rapidly. To make accurate predictions or assessments, it is advisable to consult up-to-date market analysis and seek guidance from financial professionals who have access to the latest market data and tools.
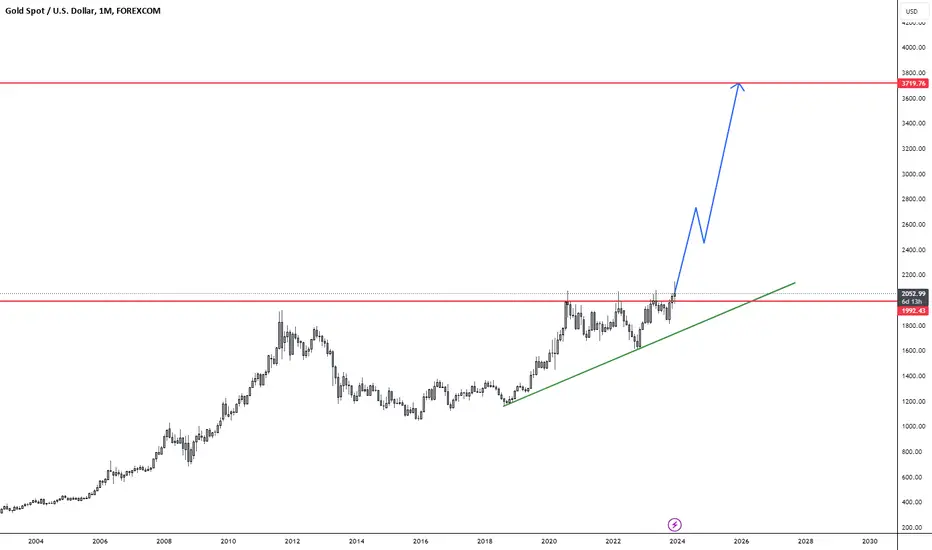
GOLD XAU USD Is Going To RallyGold looks like it is about to go on a parabolic run up to the $3700 region in the upcoming months/years.
NFA
Enjoy!
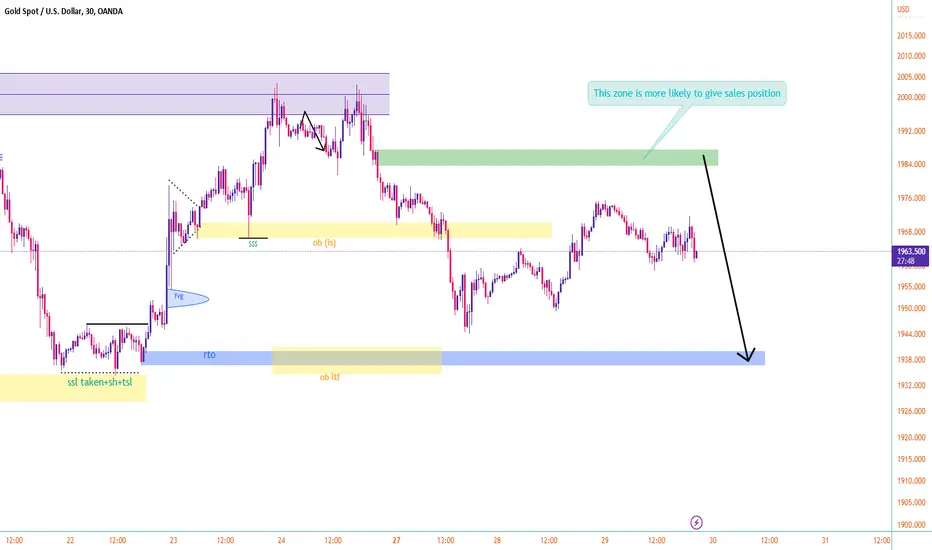
update xaudusdBe careful with your sales transactions, friends, there is a surprising fluctuation in it, manage your sales positions(Be sure to follow to see the earliest updates)

last updateMy two suggested places to buy are clear. You can get confirmation from each of them. You can make the purchase. Just pay attention to the writings and texts. I have friends and I hereby say goodbye to this account. You have to live as long as there is anemone, but in a more secluded space
read captinGreetings and courtesy to jealous and jealous Iranians. Well, as you can see, this analysis went according to the forecast and gave a profit of over 500 pips where all the professors believed in selling and gave strange predictions. I was a buyer with full margin and with my main account.Friends, all the analysis that I was watching, minus my first 5-6 analysis which were from the previous year, I had a very interesting winning percentage and it was 85% win rate analysis. Iran is a ruined house, friends play the role of the enemy and tear their shirts out of jealousy, or investment companies harass you.Yes, this is Iran. By the way, I am no longer active in this account and I will be active in another account in the coming days and I will definitely continue the path I started stronger than anyone else. I am the best analyst and trader in Iran, but alas, I am in Iran. Good luck, I ended my activity in this account because of a bunch of jealous, stupid and forbidden people

gold updateYou can either sell according to the analysis at the specified location or use that area for stop loss (also follow me to stay up to date with updates)
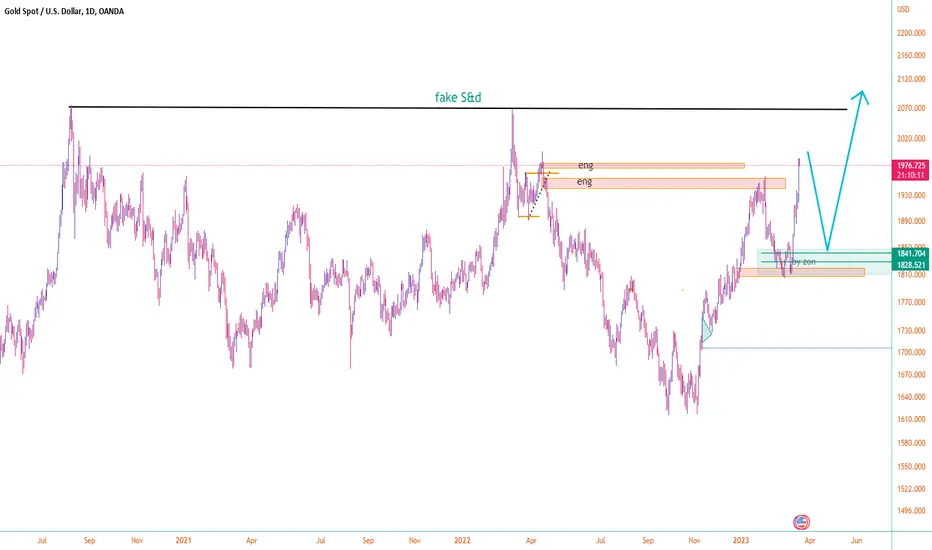
Very long term perspectiveHello friends, the previous analysis is still valid and just be careful, the correlation of the cryptocurrency market with the dollar will be disrupted when one of these two hits a new ceiling or a newer floor.

A reminder of the previous analysisI will give you a little energy, friends, so that you can enjoy and be able to endure the path, the analysis will be updated

Definitely read the captionIt has dropped 1.36% since last night's update, and will give an opportunity to sell again in the specified areas. Entry points and price targets are clear. Just be careful to look for confirmation in the areas of 1 and 5 minutes time frames
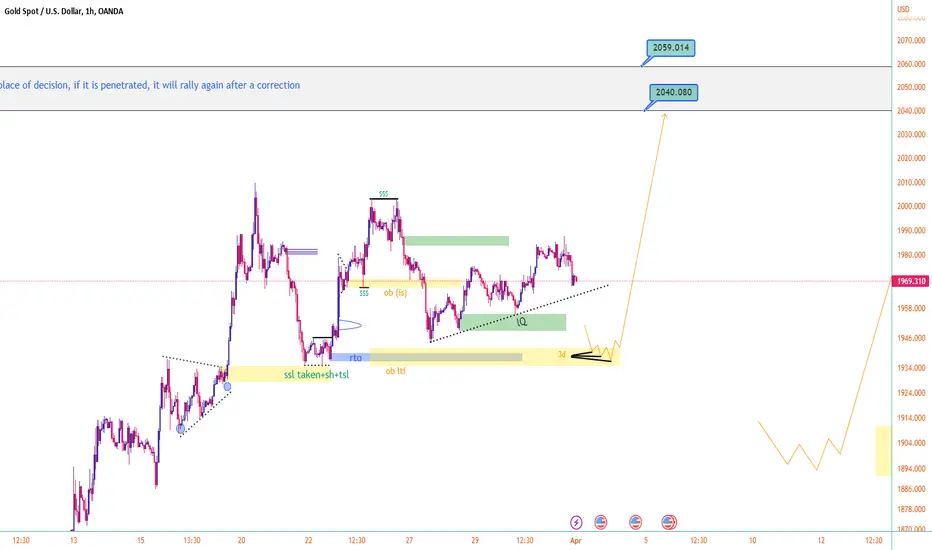
It will be available for purchase soon, but it has an attractive
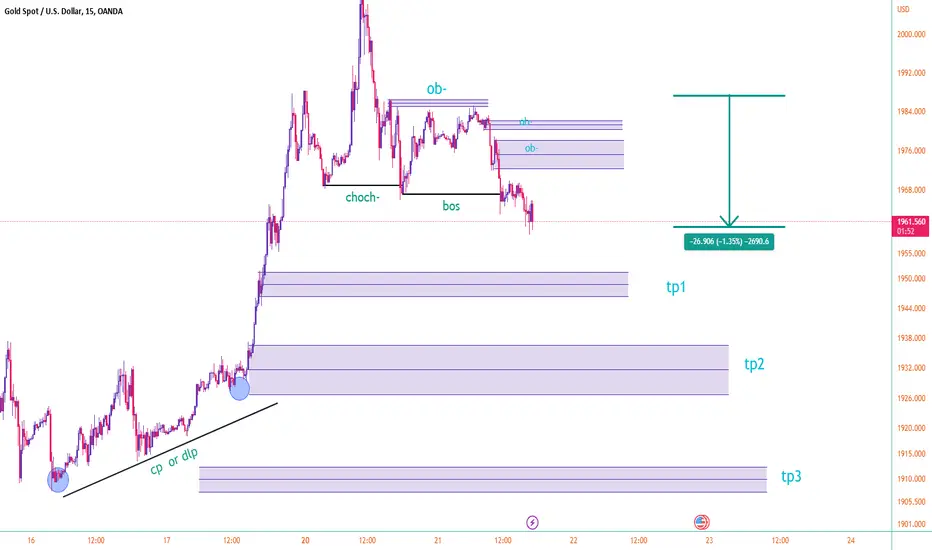
In the analysis based on smart money in a style called rtm , we take a view on the important areas in order to clear the orders. Shopping areas are identified in the analysis
You can gradually think about selling.The analysis will be updatThe previous analysis is still valid and if you are in TB, don't rush and optimize your targets . Be careful, friends, when two important regions get a divorce under the title of organizational support and strong order block, the value of the region decreases. You should definitely enter the area with confirmation. Another important confirmation is the onc1 setup, which I will discuss in the next analysis.

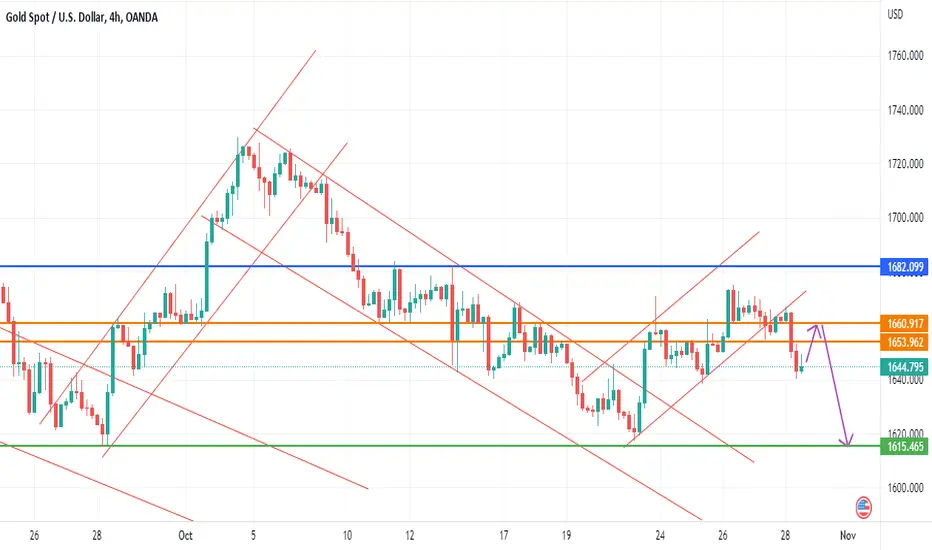
Why everyone is expecting an up trend for gold?As you see in the chart, there is a breakout in the uptrend. and of course, the retest will draw the 2nd shoulder! Then the road to $1615. Good luck! I hope you share your thoughts in the comments have a good weekend :D
XAUUSD free signal I recommend sell GOLD at thid levels as you can see in the chart we have my favorite price action+ all signals in indicators
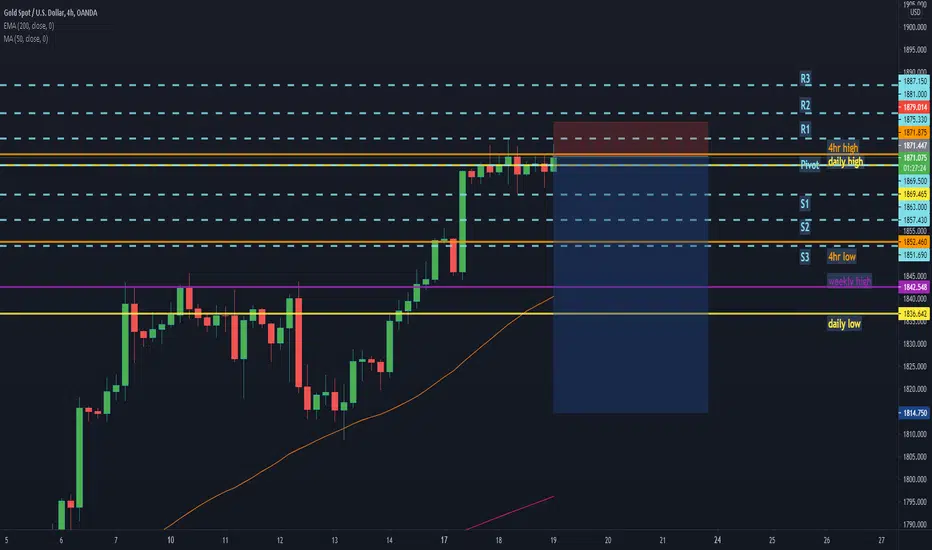
xauusd - GOLD IM SELLING GOLD!
entry 1870-1874
sl 1876-1880
tp1 1863
tp2 1856
tp3 1850
tp4 1844
tp5 1836
a bull run can only last with minor pullbacks. i do believe gold will recover back up tp 1900s. but 1st a correction must happen.
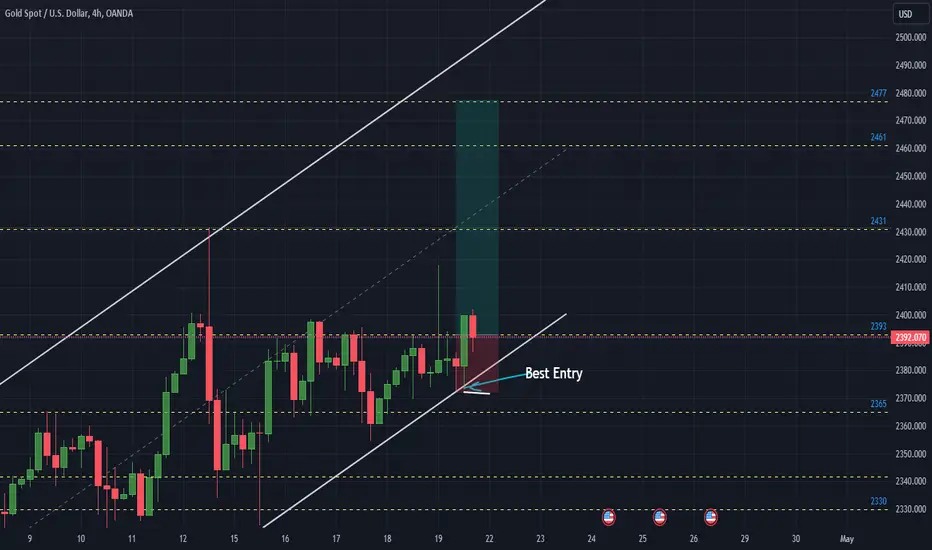
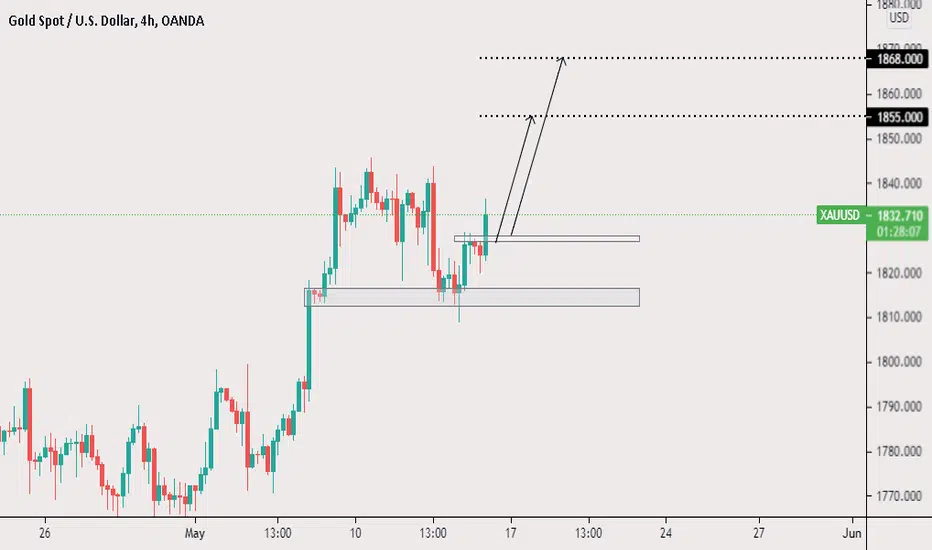
LONG THE EARLY BIRDDaily break and retest - confirms uptrend
4H my preferred entry zone. double bottom formed at the demand zone. broke and retested confirming trend. waiting for 2nd break and retest to confirm trend continuation.
Dollar index, is currently in a confirmed down trend as well.
Take profit 1 and 2 are set at 1855.0 (TP1) and 1868.0 (TP2)
Sl will be 5 pips below previous LH, will be adjusted at retracement if need be.
Good Luck and Risk safe, don't gamble, even a perfect setup can fail.
My personal risk is 1 to 3% per trade.
GOLD (XAUUSD) - Weekly Technical Analysis UpdateMidterm forecast:
While the price is below the resistance 2075.05, beginning of downtrend is expected.
We make sure when the support at 1818.00 breaks.
If the resistance at 2075.05 is broken, the short-term forecast -beginning of downtrend- will be invalid.
Technical analysis:
While the RSI uptrend #1 is not broken, bullish wave in price would continue.
A peak is formed in daily chart at 2014.90 on 08/18/2020, so more losses to support(s) 1916.20, 1862.45 and minimum to Major Support (1818.00) is expected.
Price is below WEMA21, if price rises more, this line can act as dynamic resistance against more gains.
Relative strength index (RSI) is 51.
❤️ If you find this helpful and want more FREE forecasts in TradingView
. . . . . Please show your support back,
. . . . . . . . Hit the 👍 LIKE button,
. . . . . . . . . . . Drop some feedback below in the comment!
❤️ Your Support is very much 🙏 appreciated! ❤️
💎 Want us to help you become a better Forex trader?
Now, It's your turn!
Be sure to leave a comment let us know how do you see this opportunity and forecast.
Trade well, ❤️
ForecastCity English Support Team ❤️

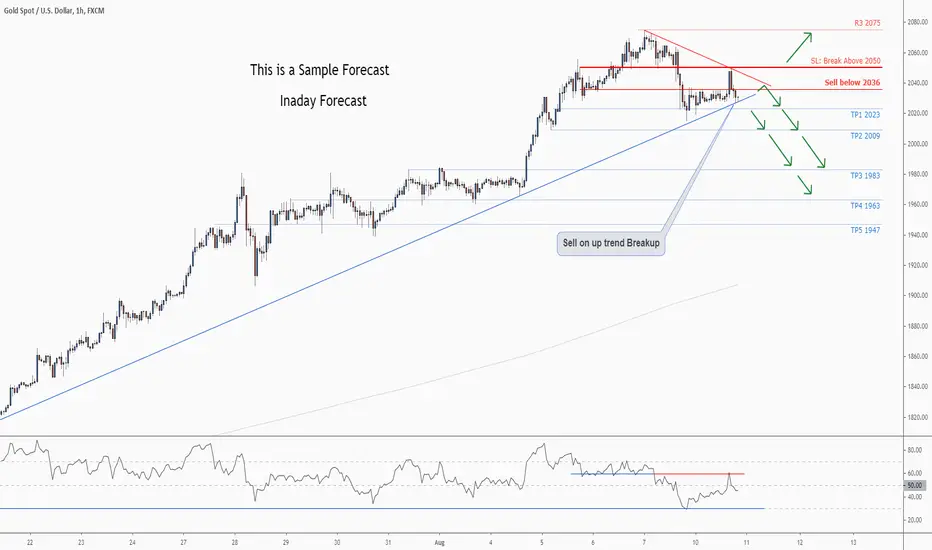
Don't miss the great sell opportunity in XAUUSDTrading suggestion:
. There is a possibility of temporary retracement to suggested Resistance line (2036) or also on uptrend breakup. if so, traders can set orders based on Price Action and expect to reach short-term targets.
Technical analysis:
. XAUUSD is in a range bound and the beginning of down trend is expected.
. The price is above the 21-Day WEMA which acts as a dynamic support.
. The RSI is at 45.
Take Profits:
TP1= @ 2023
TP2= @ 2009
TP3= @ 1983
TP4= @ 1963
TP5= @ 1947
SL= Break above R2
❤️ If you find this helpful and want more FREE forecasts in TradingView
. . . . . Please show your support back,
. . . . . . . . Hit the 👍 LIKE button,
. . . . . . . . . . Drop some feedback below in the comment!
❤️ Your Support is very much 🙏 appreciated! ❤️
💎 Want us to help you become a better Forex trader ?
Now, It's your turn !
Be sure to leave a comment let us know how do you see this opportunity and forecast.
Trade well, ❤️
ForecastCity English Support Team ❤️
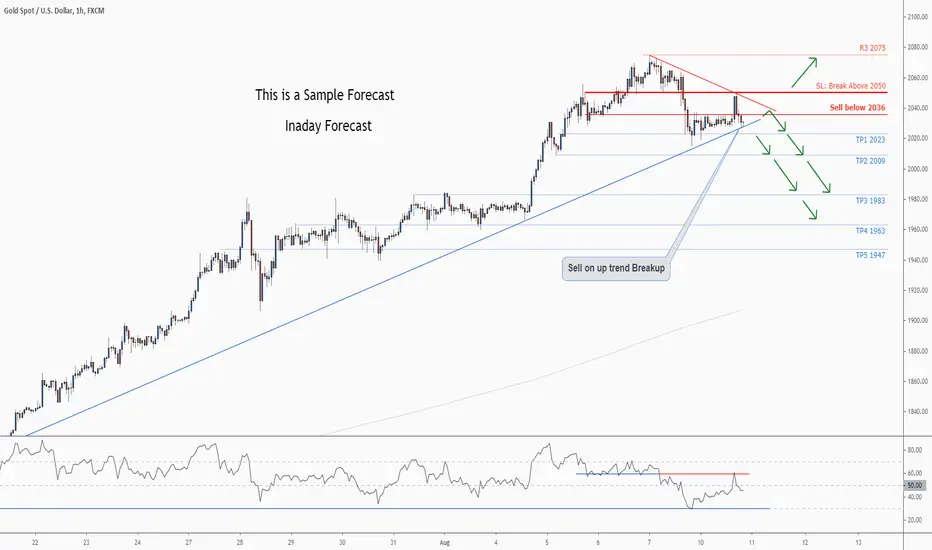
GOLD Weekly Technical Analysis UpdateMidterm forecast:
1939.45 is a major support, while this level is not broken, the Midterm wave will be uptrend.
Technical analysis:
While the RSI uptrend #1 is not broken, bullish wave in price would continue.
A peak is formed in daily chart at 1818.00 on 07/07/2020, so more losses to support(s) 2000.00, 1970.20 and minimum to Major Support (1939.45) is expected.
Price is above WEMA21, if price drops more, this line can act as dynamic support against more losses.
Relative strength index (RSI) is 79.
❤️ If you find this helpful and want more FREE forecasts in TradingView
. . . . . Please show your support back,
. . . . . . . . Hit the 👍 LIKE button,
. . . . . . . . . . . Drop some feedback below in the comment!
❤️ Your Support is very much 🙏 appreciated! ❤️
💎 Want us to help you become a better Forex trader ?
Now, It's your turn !
Be sure to leave a comment let us know how do you see this opportunity and forecast.
Trade well, ❤️
ForecastCity English Support Team ❤️
