"The Great Gold Heist" – XAU/USD Master Plan🏆 "The Great Gold Heist" – XAU/USD Master Plan (High-Risk, High-Reward Loot!) 🚨💰
🌟 Attention, Market Robbers & Money Makers! 🌟
Hola! Oi! Bonjour! Hallo! Marhaba! 🤑💸
🔥 Based on the legendary Thief Trading Strategy (technical + fundamental heist tactics), here’s our blueprint to STEAL massive profits from the XAU/USD (Gold vs. Dollar) market! 🔥
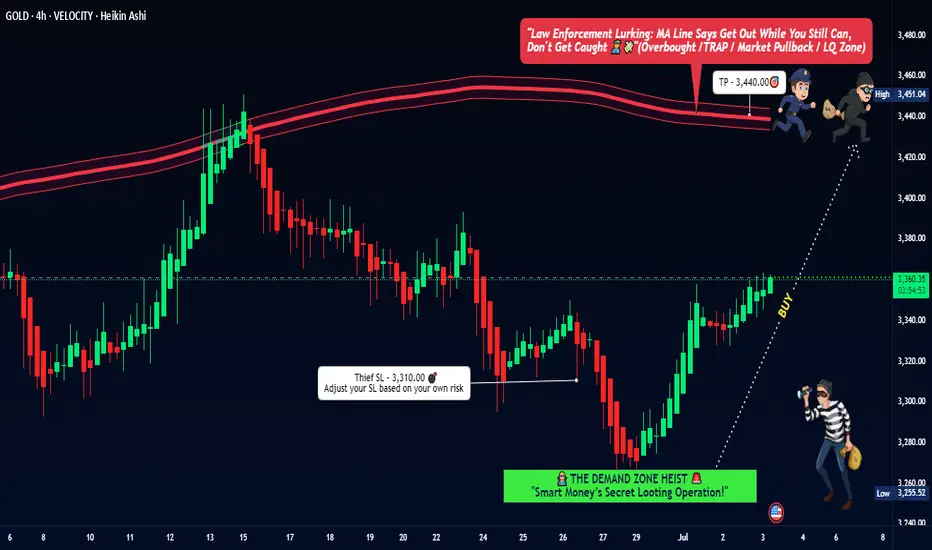
🎯 The Heist Plan (Long Entry Setup)
Entry Point 📈: *"The vault is UNLOCKED! Swipe bullish loot at any price—but for a cleaner steal, set Buy Limits within 15-30M recent swing lows/highs. ALERT UP! ⏰"*
Stop Loss 🛑: "Thief’s SL hides at the nearest swing low (4H TF: 3310.00) OR below the last daily candle wick. Adjust based on your risk appetite & lot size!"
Target 🏴☠️: 3440.00 (or escape early if the cops—err, bears—show up!)
⚡ Scalper’s Quick Loot Guide:
"Only scalp LONG! Rich? Go all-in. Broke? Join the swing traders & rob slow ‘n’ steady. Use Trailing SL to lock profits!"
📊 Market Status:
XAU/USD (GOLD) – Neutral (But Bullish Sneak Attack Likely! 🐂💥)
"The heist is ON, but watch for traps—overbought zones, consolidation, and bearish robbers lurking!"
🔍 Pro Thief Moves:
✅ Fundamentals Matter! (COT Reports, Geopolitics, Macro Data, Sentiment—check our Bii0 for the full loot list!) 🔗👉🏻☝🏻 klik lin.kk
✅ News = Danger! Avoid new trades during releases. Trail your SLs to protect stolen cash! 📰🚨
💖 Support the Heist Crew!
"Hit the BOOST BUTTON 💥 to strengthen our robbery squad! More boosts = easier money steals daily!"
🚀 Stay tuned—another heist drops soon! 🐱👤💎
Xausdanalysis
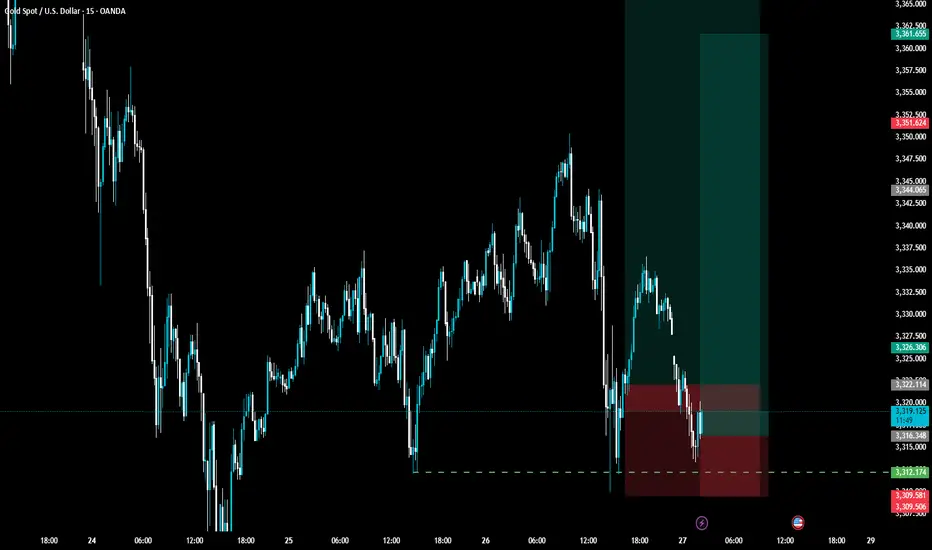
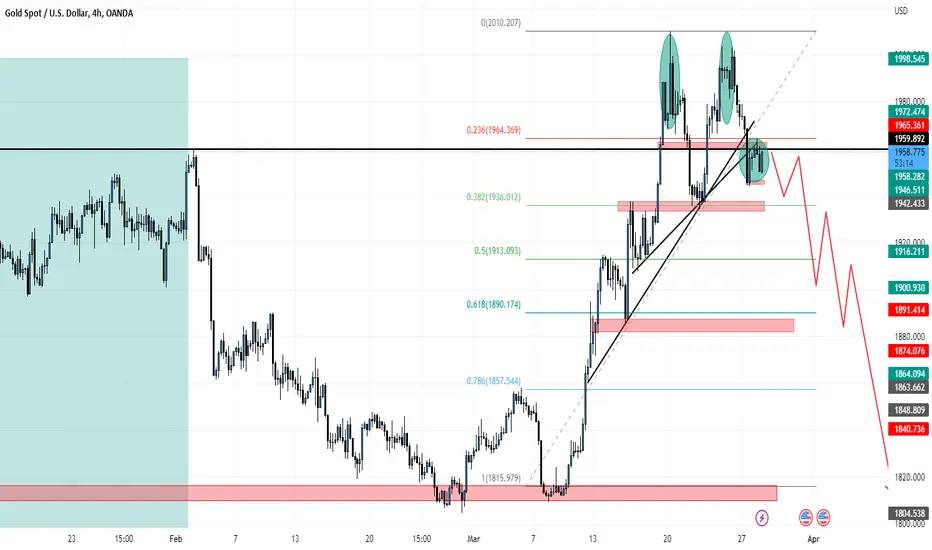
Gold’s in a Trap — And That’s Exactly Why You Should Be CarefulGold is stuck in a tight sideways range. It’s been bouncing between $3,370–$3,380 for two days now. Everyone sees it. Every trader watching gold knows this level acted as support — and judging by the candle shadows, buyers are getting aggressive here.
So if you're purely technical — yeah, looks like a solid buy right now.
But here’s the twist…
___________________________________________________________
I’m not buying.
And I’ll tell you why — because it's too obvious.
When something screams "buy" from every chart and every textbook, that’s when you pause and ask yourself:
“Am I about to walk into a classic setup… or actually catch a real move?”
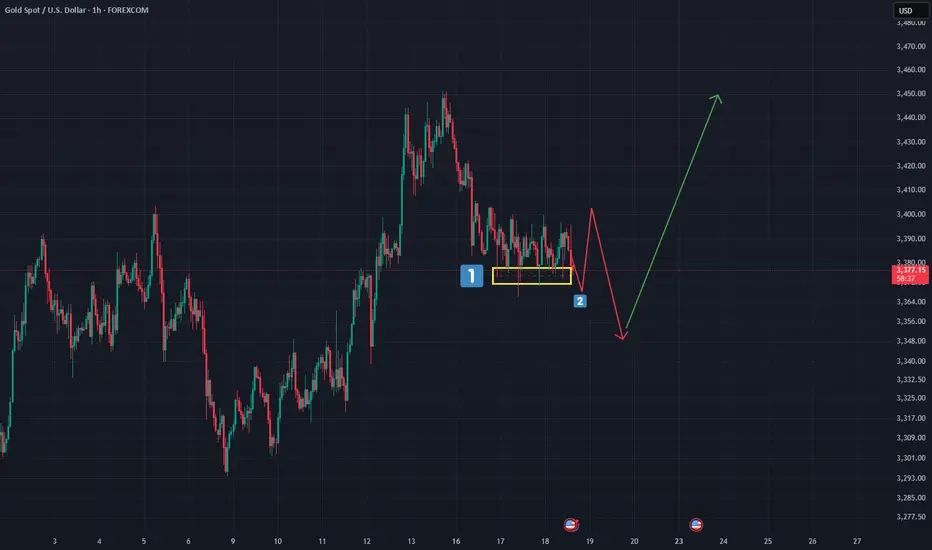
Because history shows us — these textbook setups often play out like this:
Motivation → Encouragement → Payback. (See Chart 2)
It goes like this:
Price breaks a visible high or low (Motivation)
Traders jump in and get some pips(Encouragement)
Then — brutal reversal (Payback)
Only then will everything get off the ground, and it will be fast, so that the "unnecessary" passengers who were "dropped off" should not have time to return to this train. So why are they "unwanted"? Well, here's one possible answer: because retail tends to hold losing trades too long , but gets spooked early on winners. We’re wired that way.
So what happens when everyone starts booking profits after a small bounce?
You get limit sell orders piling up , slowing momentum — sometimes even flipping the trend.
And then what do big players do?
Then come back in — buying at higher levels, averaging their positions. Not the best case scenario....
Key Takeaway:
______________________
Here’s my advice — especially if you’re in this game long-term:
1. Avoid those super obvious setups everyone else is jumping into.
2. Instead of asking, "Why should I open a trade now?"
Try asking: "Why shouldn’t I open a trade now?"
p.s.
If you liked this kind of deep-dive — follow along. We don’t just read charts. We read the market behind them.
Conclusion:
_________________________
📍 Gold is testing a key zone — but don’t let the crowd pull you in.
🧠 The first quick impulse is often a trap
📈 Stay sharp, stay ahead.
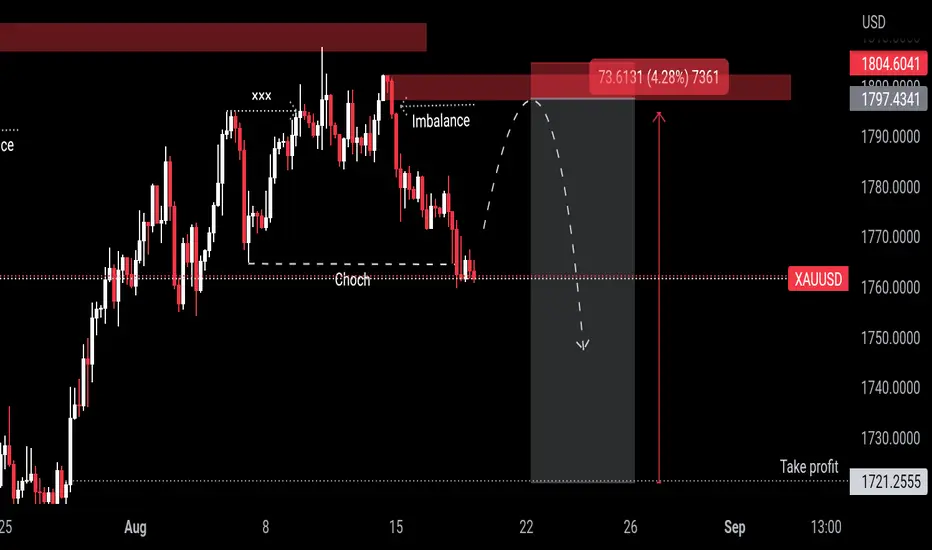
XAU/USDGold seems to be touch daily bullish FVG also that area is a swing daily high lots of liquidity is resting this zone, One's liquidity is swiped price will target daily low target.
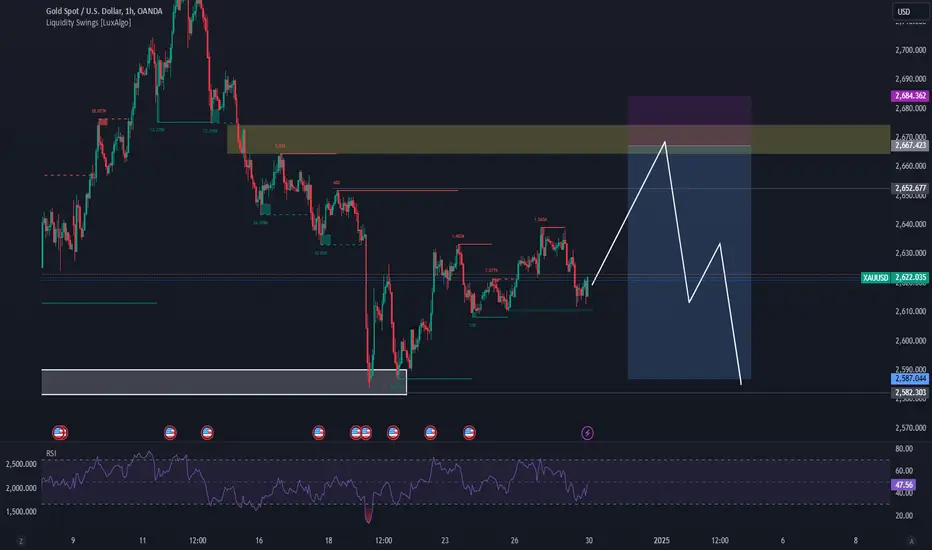
#XAUUSD 1HBased on the 1-hour analysis, I’m watching for a selling opportunity around the key resistance levels of 2673.00 and 2671.00.
Targets: 2662.00 / 2640.00 / 2625.00
However, with the major NFP event coming up today, there's potential for an upward spike. Avoid placing advance orders for now and wait for solid bearish confirmation before entering.
#XAUUSD

#XAUUSD 1HBased on the 1-hour analysis, the price is consolidating near the resistance area. I'm personally looking for a selling opportunity around the 2509.00 zone.
There’s a chance the price could drop directly from here without testing our zone.
Avoid placing advance orders for now and wait for strong bearish confirmation before entering.
#XAUUSD

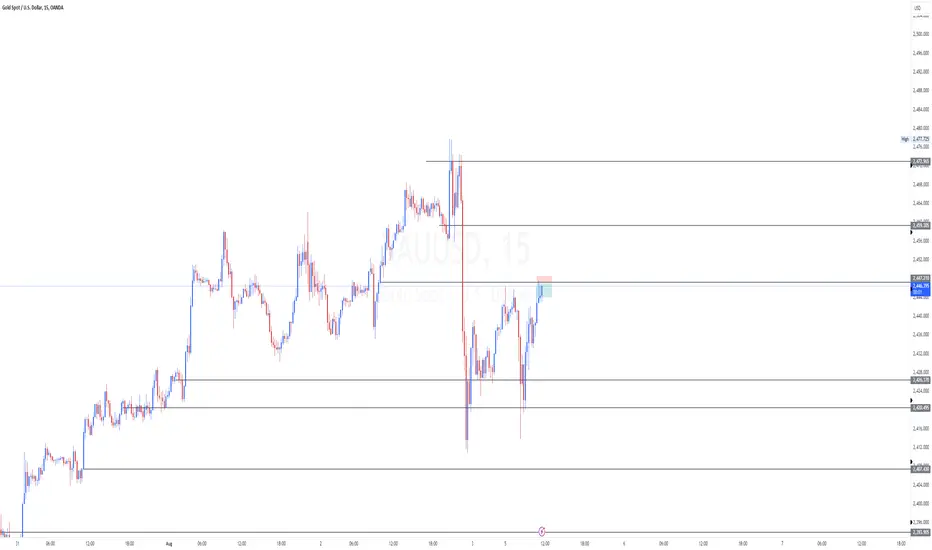
XAUUSD - GOLD - Scalping Mode! 5th AugLet's see what the market has to offer.
Disclaimer:
This is simply my personal technical analysis, and you're free to consider it as a reference or disregard it. No obligation! Emphasizing the importance of proper risk management—it can make a significant difference. Wishing you a successful and happy trading experience!
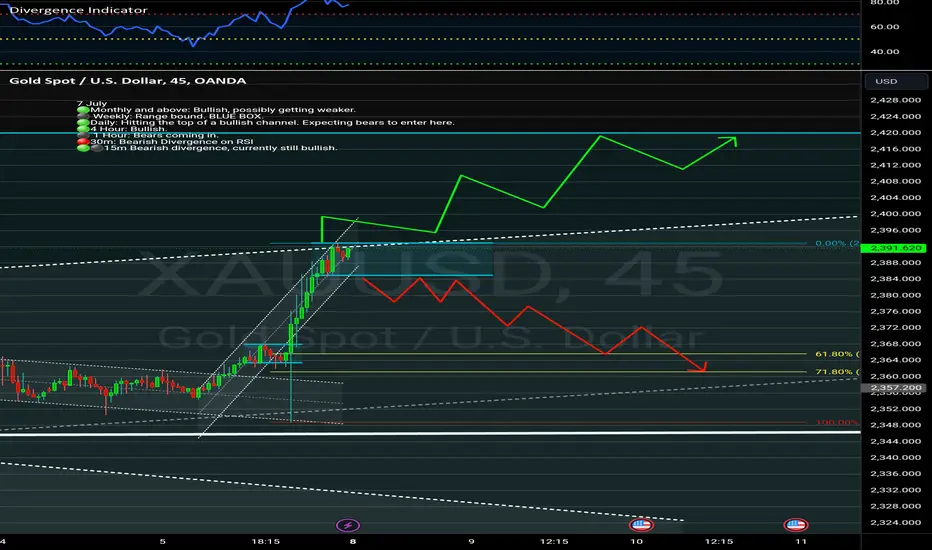
XAU-USD Bearish divergence intraday.Hi traders.
1 Hour and below has bearish divergence taking place. A slow breakdown in price. We have hit the upper bound resistance in a bullish channel. I expect a short term reversal. We must wait for a breakout of the channel before attempting a short down to $2360 zone.
On the other hand, price could push hard out of the intraday channel to $2420
XAUUSD SCALPINGwe'll wait for the news on 17:30 to confirm whether we BUY or SELL
If it breaks the up trend line we buy
If it breaks the down trend line we wait for retest or double confirmation candle then we sell

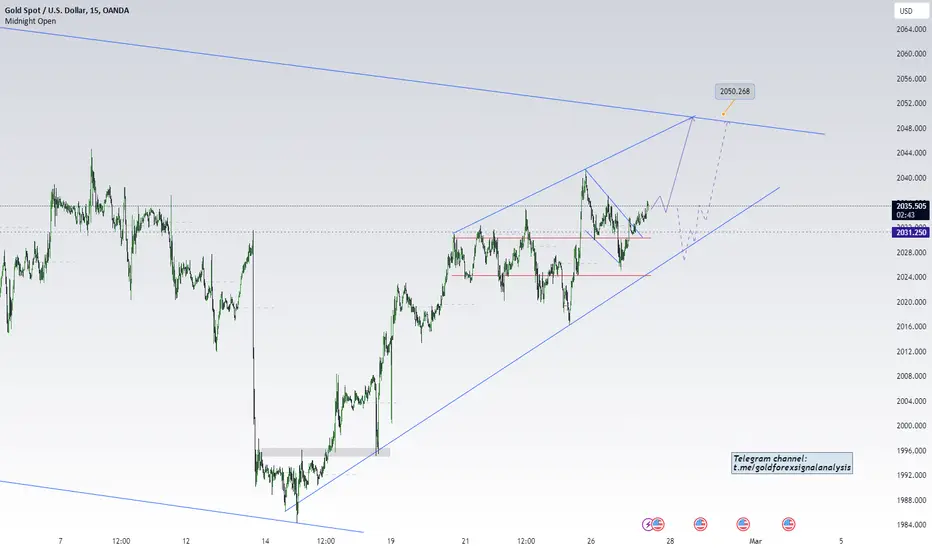
Gold daily analysisGold is likely to touch the 2050 where it is a upper channel line and I have 2 scenarios. I think the control is in the buyers hand, so I just look for buy until 2050 get touch.
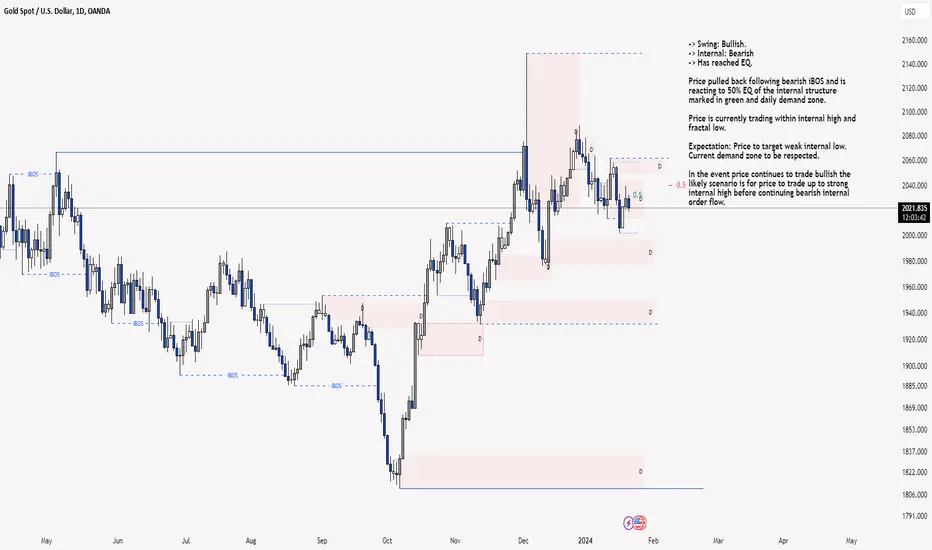
XAU/USD 22 Jan 2024 Daily Analysis-> Swing: Bullish.
-> Internal: Bearish
-> Has reached EQ.
Price pulled back following bearish iBOS and is reacting to 50% EQ of the internal structure marked in green and daily demand zone.
Price is currently trading within internal high and fractal low.
Expectation: Price to target weak internal low. Current demand zone to be respected.
In the event price continues to trade bullish the likely scenario is for price to trade up to strong internal high before continuing bearish internal order flow.
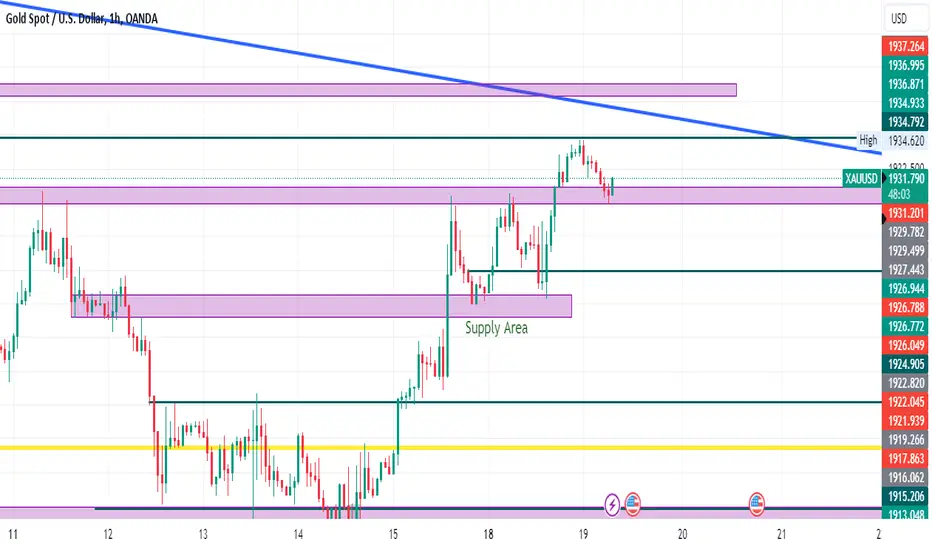
xauusd 1h timeframe chart xauusd chart analysis 1hours time frame. if breakout 1934 so you can buy, if xauusd breakdown 1931level so can sell.
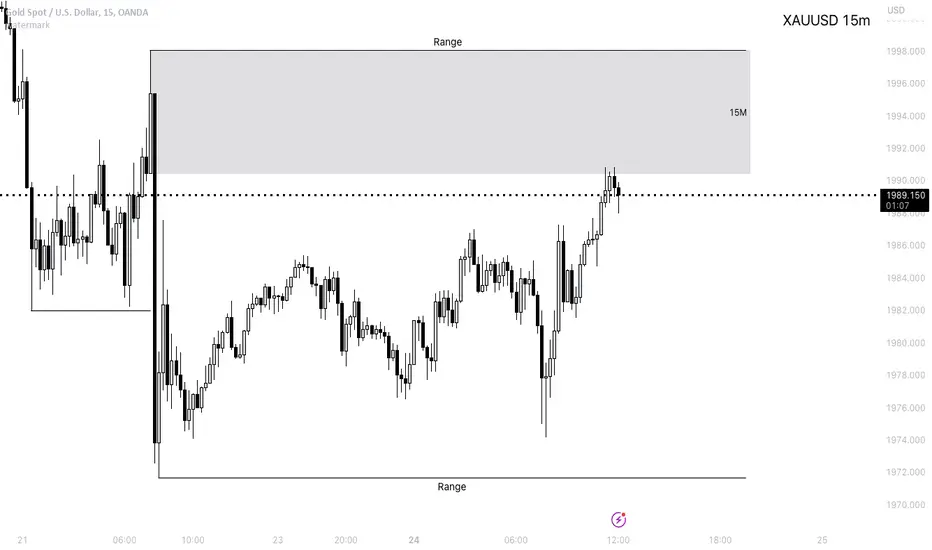
XAUUSD 26/04/2023Currently, on the 15-minute timeframe chart, we are within a bullish range that ranges from 2009 to 1991, with the former being the liquidity point of the range. Therefore, we could expect a bullish reaction in the zone ranging from 1998 to 1996. As long as the price does not close below this zone with a bearish candle, we can say that the zone is being absorbed in lower timeframes, and we can move down to lower timeframes to position ourselves in bullish ranges.

XAUUSD 15M 24/04/2023On the 15-minute timeframe, we can see that we are already mitigating the zone between 1998 and 1990. Depending on the confirmation style, one could already be in a short position with a target at 1971, as it is the liquidity point of the bearish range.
Gold Spot Bulls Can Show The PresenceHello Friends,
On my last analysis it was suggested 2048 - 2050 can bring bears on charts till 1980 - 1970. Today we have witnessed 1970 now this is a support, an important support infect.
So those who are shorts should look to book gains or at least adopt risk management. For details of That analysis please go though my previous research on GOLD.
I believe short covering base pull back from here can be seen till 1981 - 1986.
Closing US session above 1986 would shift control to ST to bulls.
For MT to LT please review my previous details research.
Happy Trading.
possibilities of reversal move about xauusdhello everyone
we have few factors on xauusd chart 4h
that gives us a point to how think about next moves
XAUUSDOANDA:XAUUSD
The gold is going up and may bounce back down to break below support line.
What do you think will happen with GOLD?
XAUUSD
on this 1H time frame. There is a possibility that the Bull trend will form after this ranging market.
Right now it is best to wait until Late Tuesday or Wednesday or possibly Thursday to have a clearer 1H timeframe.
I am hoping this trend breaks the 1808.00 price.
I am seeing a continuing BULLISH TREND that can break the 1870 price.
If there was a time to back up gold , it is now.
$XAU - Gold, where are you heading?$XAU - Gold, where are you heading?
Another day, another great opportunity...Precious metals within the ranges a break to either direction!
Trade Journal
XAUUSD - Daily Timeframe AnalysisXAUUSD price is currently testing Weekly & Daily support levels.
Stay tuned for updates.
XAUUSD LONG or SHORT?We are seeing the XAUUSD to go up and break the 1900$ mark.
Let's get started!
(Make sure to hit LIKE!)
If the price hovers and breaks the 1810$ mark then soon we will see a long sell spike, but if the mark opens about 1835$ then next target will be 1900$ or above.
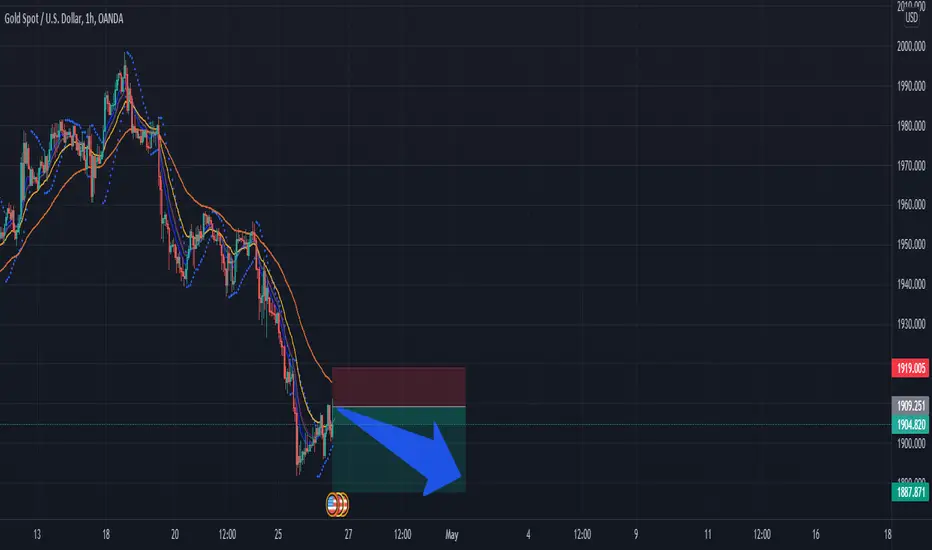
XAUUSD SellWe are still bearish on the precious metal and entering into a new order here with the following targets:
SELL XAUUSD (GOLD)
ENTRY: 1909
SL: 1919
TP: 189