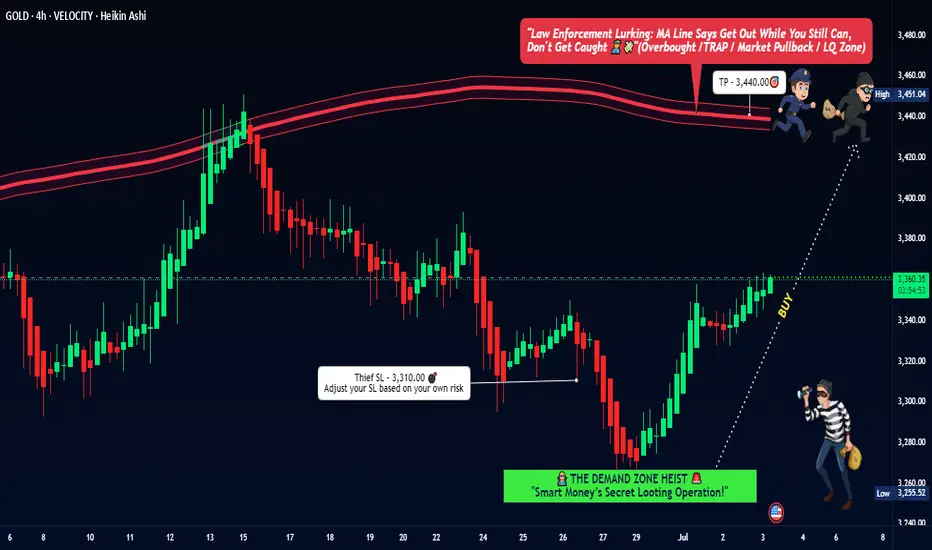
"The Great Gold Heist" – XAU/USD Master Plan🏆 "The Great Gold Heist" – XAU/USD Master Plan (High-Risk, High-Reward Loot!) 🚨💰
🌟 Attention, Market Robbers & Money Makers! 🌟
Hola! Oi! Bonjour! Hallo! Marhaba! 🤑💸
🔥 Based on the legendary Thief Trading Strategy (technical + fundamental heist tactics), here’s our blueprint to STEAL massive profits from the XAU/USD (Gold vs. Dollar) market! 🔥
🎯 The Heist Plan (Long Entry Setup)
Entry Point 📈: *"The vault is UNLOCKED! Swipe bullish loot at any price—but for a cleaner steal, set Buy Limits within 15-30M recent swing lows/highs. ALERT UP! ⏰"*
Stop Loss 🛑: "Thief’s SL hides at the nearest swing low (4H TF: 3310.00) OR below the last daily candle wick. Adjust based on your risk appetite & lot size!"
Target 🏴☠️: 3440.00 (or escape early if the cops—err, bears—show up!)
⚡ Scalper’s Quick Loot Guide:
"Only scalp LONG! Rich? Go all-in. Broke? Join the swing traders & rob slow ‘n’ steady. Use Trailing SL to lock profits!"
📊 Market Status:
XAU/USD (GOLD) – Neutral (But Bullish Sneak Attack Likely! 🐂💥)
"The heist is ON, but watch for traps—overbought zones, consolidation, and bearish robbers lurking!"
🔍 Pro Thief Moves:
✅ Fundamentals Matter! (COT Reports, Geopolitics, Macro Data, Sentiment—check our Bii0 for the full loot list!) 🔗👉🏻☝🏻 klik lin.kk
✅ News = Danger! Avoid new trades during releases. Trail your SLs to protect stolen cash! 📰🚨
💖 Support the Heist Crew!
"Hit the BOOST BUTTON 💥 to strengthen our robbery squad! More boosts = easier money steals daily!"
🚀 Stay tuned—another heist drops soon! 🐱👤💎
Xausdforex
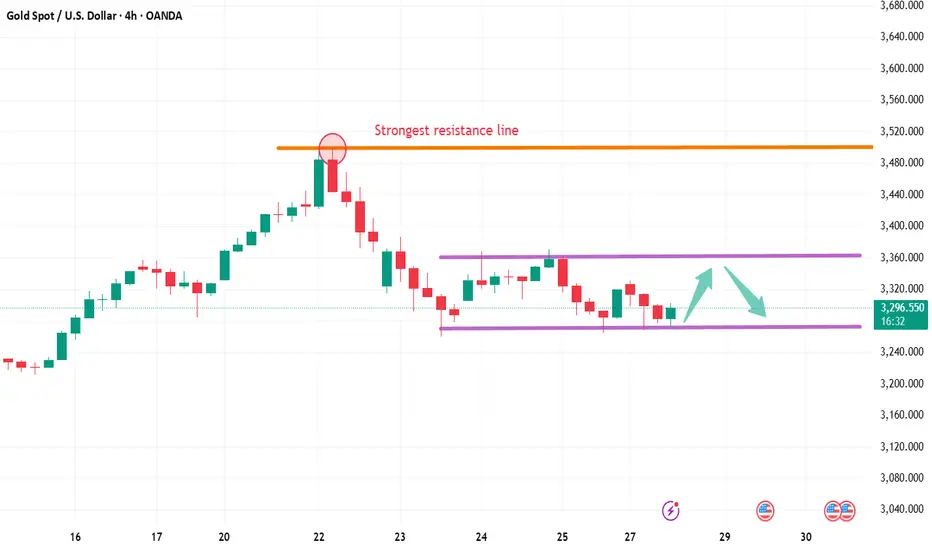
Gold (XAU/USD) Technical Outlook — July 1, 2025In the world of financial markets, few assets capture global attention like gold. A timeless store of value, gold continues to act as both a hedge against uncertainty and a battleground for technical traders seeking high-probability setups. As of today, gold (XAU/USD) is trading at $3328, a level that places it just beneath the most recent multi-month high at $3345. The recent surge in price is underpinned by both macroeconomic factors and bullish technical structure. However, as any seasoned trader knows, trends rarely move in straight lines — and gold is now approaching a technically sensitive juncture.
I. Gold’s Structural Landscape on the 4-Hour Chart
The four-hour chart reveals a textbook bullish trend. Beginning with a significant impulse from the $3194 base, gold has climbed steadily, printing higher highs and higher lows. The most recent break of structure (BOS) above $3312 confirmed the continuation of bullish intent, while the market remains firmly above key swing lows — signaling that the bullish regime has not yet been invalidated.
Price action shows clean, impulsive expansions followed by short consolidations, with buyers continuing to absorb supply at every retracement. Despite that strength, gold has now reached a potential exhaustion point, with the price reacting to overhead supply at $3345–3355, forming what could be an early-stage distribution zone.
Key Market Structure Developments:
BOS at $3312: confirms uptrend
No CHoCH (Change of Character) yet — no confirmed bearish reversal
Clean liquidity grab above $3345, followed by rejection — hinting at short-term profit-taking or internal bearish intent
II. The Fibonacci Grid: Retracement and Extension Zones
Applying Fibonacci retracement from the $3194 swing low to the $3345 high offers crucial levels of interest. The golden ratio at 61.8% ($3253) aligns perfectly with prior demand and a 4-hour bullish order block. Similarly, the 38.2% level at $3285 corresponds with a minor liquidity pool and potential reaccumulation base.
Fibonacci Level Price
23.6% $3308
38.2% $3285
50.0% $3269
61.8% $3253
78.6% $3228
On the extension side, should gold resume its rally beyond $3345, projected Fibonacci targets sit at $3372 (127.2%) and $3410 (161.8%), with both acting as measured projections for trend continuation.
III. Supply and Demand: Mapping Institutional Footprints
Institutional activity is best observed through unmitigated supply and demand zones — areas where large orders caused rapid price displacement. Gold currently trades between two such zones:
Demand Zone: $3250–$3260 — a sharp bullish rejection occurred here on the last visit, indicating strong buy-side interest and likely pending buy orders
Supply Zone: $3345–$3355 — where a sell-side liquidity grab recently occurred, followed by a strong rejection candle
These two zones bracket the market and serve as the highest probability areas for future reactions.
IV. The Smart Money Concepts (SMC) Framework
SMC theory revolves around observing the footprints of large market participants — often labeled “smart money.” In gold’s current structure, SMC tools provide a clearer roadmap than standard indicators.
Current Observations:
Break of Structure (BOS): Confirmed at $3312 (bullish continuation)
Change of Character (CHoCH): Absent (bull trend intact)
Buy-Side Liquidity Grab: Above $3345 — trapped breakout buyers likely fuel for reversal
Sell-Side Liquidity Pool: Uncollected beneath $3280 — probable magnet for a liquidity sweep
Fair Value Gap (FVG): Between $3260 and $3280 — price inefficiency offering high-probability reentry for smart money
Bullish Order Block (OB): At $3250–$3260 — final down candle before explosive up move, unmitigated
All these elements point to a high-probability pullback, rather than a full-blown reversal. Until structure is broken with a CHoCH, the base case remains bullish.
V. High-Probability Levels for 4-Hour-Based Opportunities
From this framework, we identify the following key price levels:
The highest-probability reaction is expected at $3250–$3260, where smart money is likely to re-engage if price retraces.
VI. Refinement on the 1-Hour Chart: Intraday Trade Setups
Zooming into the 1-hour chart allows us to fine-tune our execution strategy. Gold is consolidating just below $3330, forming what appears to be an ascending triangle — a common bullish continuation structure — but within the broader context of a possible short-term pullback.
Intraday Trade Idea #1 — High-Conviction Long
Entry: $3260
Stop-Loss: $3245
Take-Profit 1: $3308
Take-Profit 2: $3340
Risk–Reward: ~1:4
Rationale: Aligned with 4H demand, fair value gap, OB, and golden ratio retracement. Structure remains bullish.
Intraday Trade Idea #2 — Speculative Short (Low Conviction)
Entry: $3340–$3350
Stop-Loss: $3362
TP1: $3305
TP2: $3285
Risk–Reward: ~1:2.5
Rationale: Countertrend, only viable if bearish rejection candle forms. Not aligned with dominant 4H structure.
VII. The Golden Setup: Long from Demand + FVG Confluence
Among all technical configurations, the long setup at $3260 emerges as the most compelling. It is supported by:
An unmitigated bullish order block
A clear fair value gap
61.8% Fibonacci retracement
Untouched sell-side liquidity below
Directional alignment with trend
Institutional demand pattern
This setup offers both superior risk-to-reward and a technical foundation that aligns with Smart Money’s modus operandi. It represents a low-risk, high-reward opportunity for traders who wait for price to re-enter the value zone and confirm with bullish order flow (e.g., a bullish engulfing or BOS on 15m).
VIII. Final Thoughts and Tactical Summary
As of July 1, 2025, the gold market reflects strong bullish momentum, albeit entering a corrective phase that should not be mistaken for reversal. While intraday volatility and range compression may tempt countertrend trades, the smartest play remains to wait for a discounted reentry into a zone of value.
Until structure shifts significantly, the dominant trading thesis remains: “Buy the dip into institutional zones”. Patience, not aggression, will separate the retail trader from the professional in today’s complex market structure.
Gold is expected to rise in the US market
🌐 Driving factors
Geopolitical situation: US President Trump's special envoy Witkov held a three-hour meeting with Russian President Putin in Moscow last Friday to discuss the US plan to end the war in Ukraine. The Kremlin said that the positions of the two sides have become closer.
Iran and the United States said on Saturday that they have agreed to continue nuclear talks in the coming week, but Iranian Foreign Minister Abbas Araqchi was "extremely cautious" about whether the negotiations aimed at resolving the decades-long deadlock can be successful. US President Trump expressed confidence in reaching a new agreement with Iran to prevent the country from developing nuclear bombs.
Latest news: Russian President Putin announced on the 28th that a ceasefire will be implemented from 0:00 on May 8 to 0:00 on May 11.
Bullish sentiment in the market cools down
📊Comment analysis
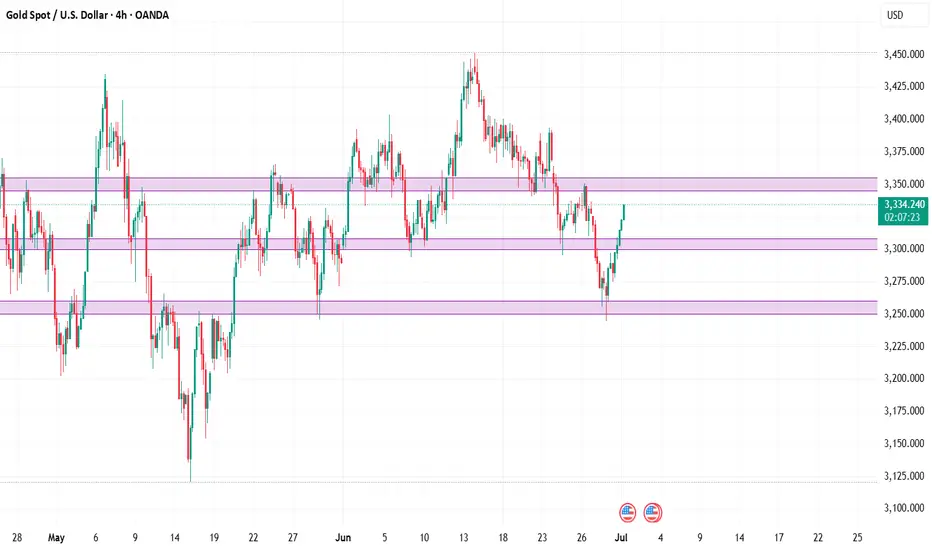
After the Asian session gold gapped up and opened, it began to fall back quickly to around 3267. After a small rebound in the European session, it continued to retreat. It is currently maintained near 3290. It may continue to fall in the short term, and the support below is maintained near the previous low of 3265-3260 US dollars. This position will also determine the trend of the long and short positions in the later period. It is very likely to retreat again near this position in the evening and continue to make directional choices in the later period. Once the support is effective, the US session may usher in a rebound again, and the key suppression area above is maintained near the integer level of 3300. This position is also the high point of the rebound in the European session, and it will also be the key suppression position of the US session. The operation idea of the US session is very simple. Continue to maintain a certain fluctuation in this range. Once it breaks through, consider stopping loss and exiting.
🔷Technical side:
For the current gold, the 4-hour chart is fluctuating widely between 3330-3270, and is currently near $3295.
✔Operational suggestions, keep short-term trading:
US gold operation strategy:
If you try to go long at 3265-60 first, the target is around 3280-3290, and the loss is 3255. If you first pull back to 3295-00, go short with a light position, and the target is around 3270-3265, and the loss is 3205. In the short term, the long and short positions may continue to pierce, so you need to operate with caution!
💥Risk warning
Liquidity risk: The market may be bearish in early May, and price fluctuations may be amplified.
Policy black swan: Trump may suddenly change tariff policies or personnel changes at the Federal Reserve, causing violent market fluctuations.
Technical false breakthrough: There are a large number of stop-loss orders near $3350, so be wary of reversals after inducing longs.
Summary: This week, the gold market will be affected by geopolitics, the Fed's policies and the trend of the US dollar, and the fluctuation range is expected to be between $3260 and $3350. Investors need to pay close attention to key support and resistance levels and adjust their strategies flexibly.
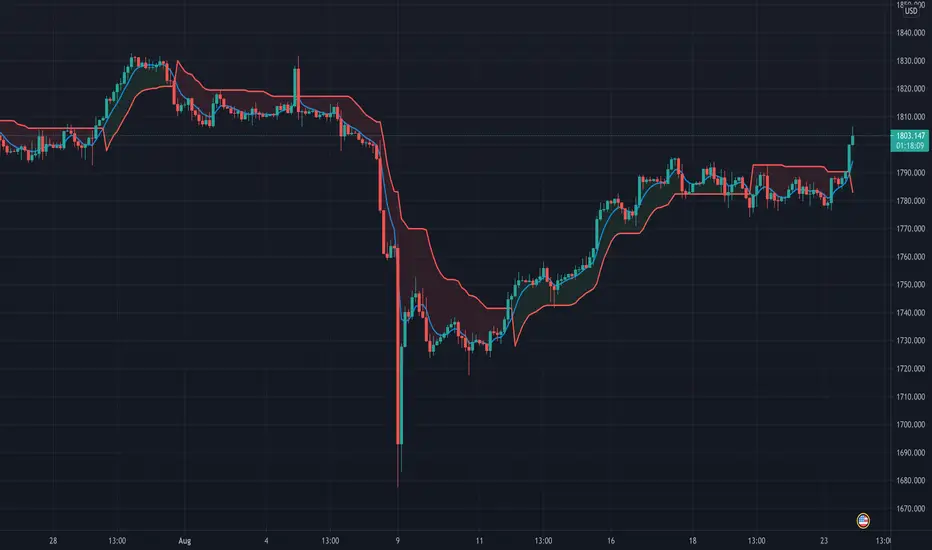
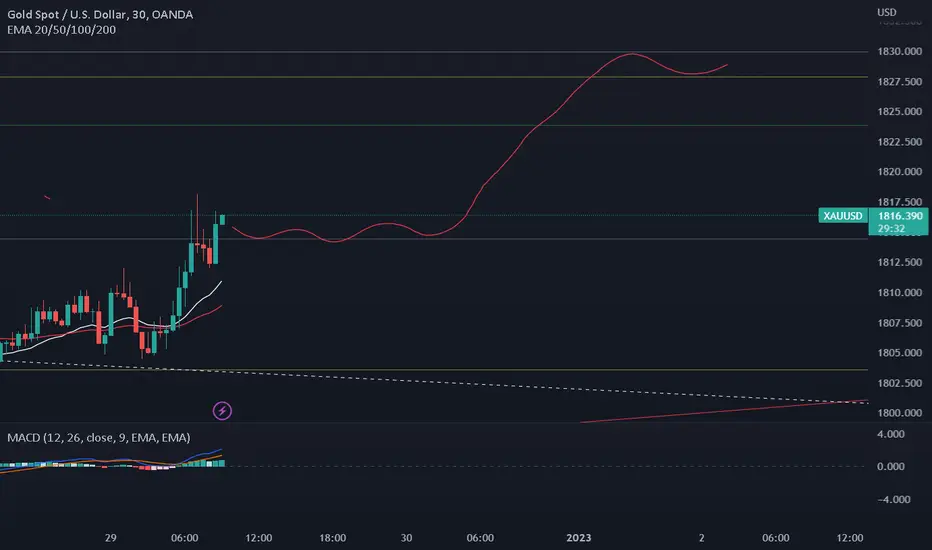
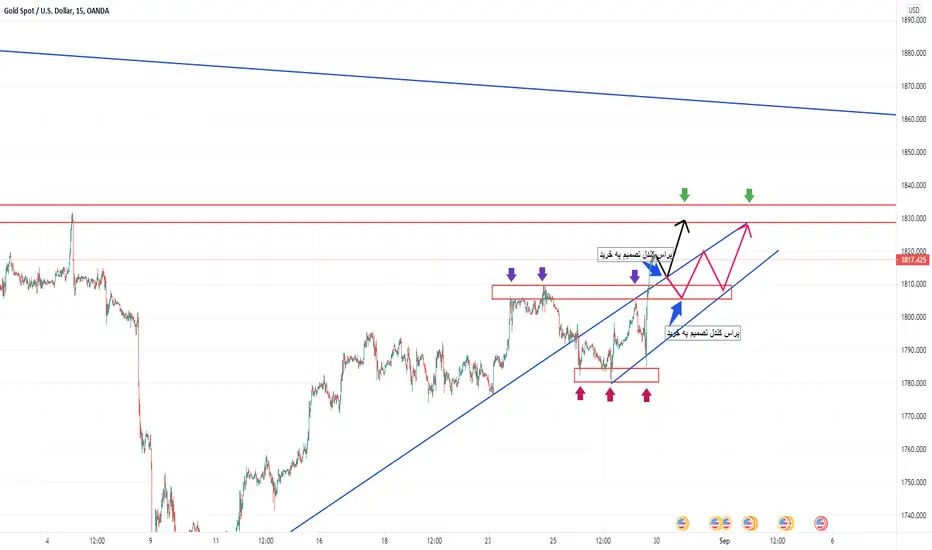
XAUUSD addAdding into my buy position if we can get a retest at 1814 then we can probably see gold sit above 1827.8 before end of tommorow
1814 should be a okay support 1812 sl
or gold can lose it can come back down to 1803
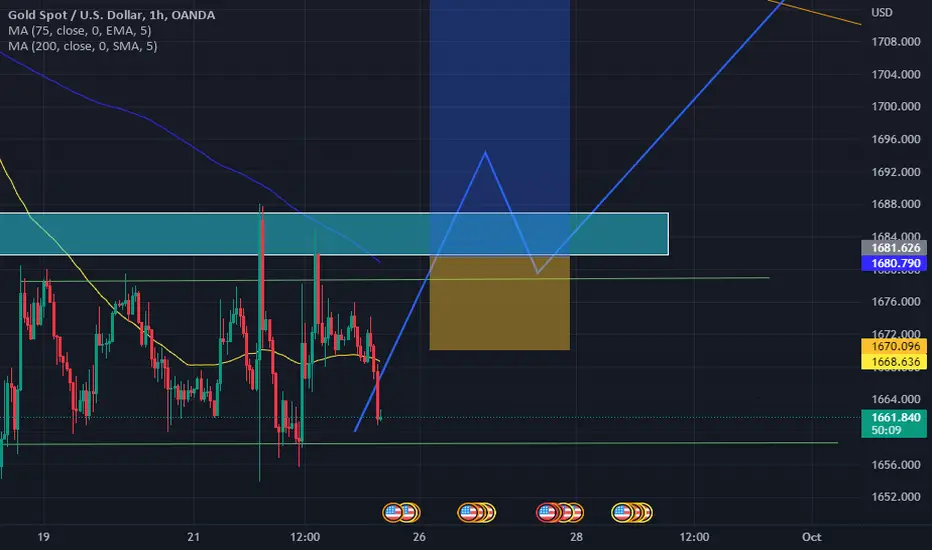
XAUUSD LongAccording to the higher time frames, there is a falling channel which is a major indication of the bullish trend.
Now it has reached a major support zone, which is the previous lower low of the channel.
According to the lower time frames, there is a ranging market which might give us the go ahead of either a bullish or bearish momentum.
Let us wait for the price to move further.
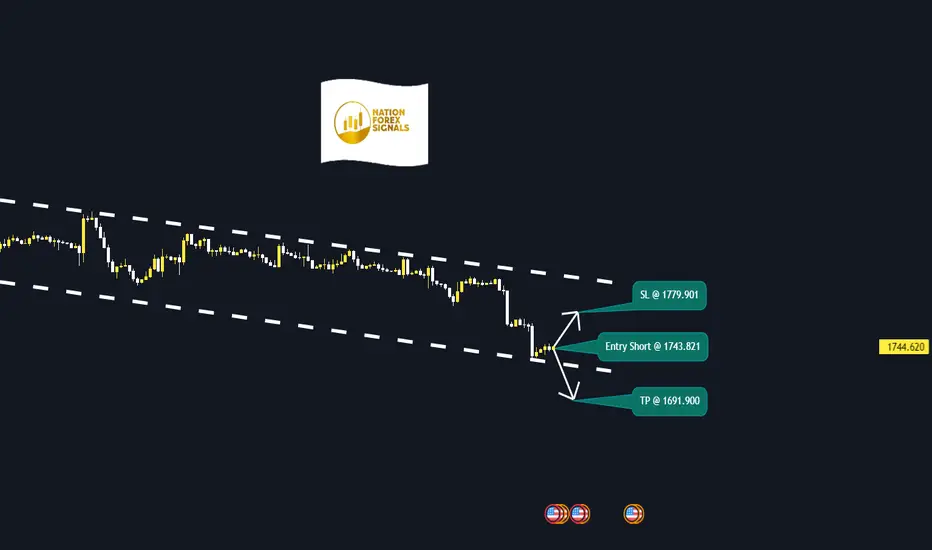
XAUUSD ShortTime Frame: 4H
Symbol: XAUUSD
Entry: 1743.821
TP: 1691.900
SL: 1779.901
Bias: Short
This is obvious that the the pair is tilting down slowly creating a selling atmosphere. Our bias is bearish after a thorough technical and fundamental study. We are looking for shorting opportunity.
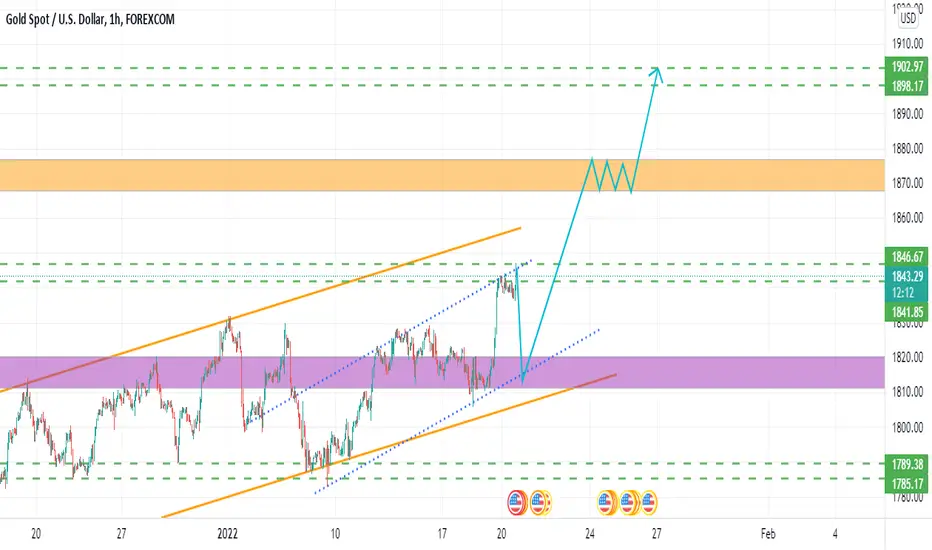
XAUUSD ShortAccording to m y analysis the H1 is on a key level of resistance which I strongly believe will hold thus creating room for bears to run their business before the bulls take over the rally.
Technical analysis of goldAccording to my personal analysis
Gold reaches the specified limits and I expect to climb to the specified targets
Male write to me about this analysis?
Clear path for gold to grow, its the starting only, Long GOLDPrice is above 200 ema. and also atr based indicator just flashed buy signal(swing), Grab gold with low risk. The target is 1000 pips.