TACO trading reappears. Gold is down.The news that Trump intends to fire Powell caused a decline in US stocks and bonds, and gold prices soared in response. But then Trump denied the news, and the market subsequently fell back to stabilize.
On Wednesday, the Asian market began to fluctuate and rise in the early trading. It rose to a high of 3343 in the European market and then fell to 3319 in the US market. Then it rose sharply due to the news. It rose to a high of 3377 and then fell to 3336. It fluctuated around 3350 in the late trading. The daily line closed with a positive line with an upper shadow line.
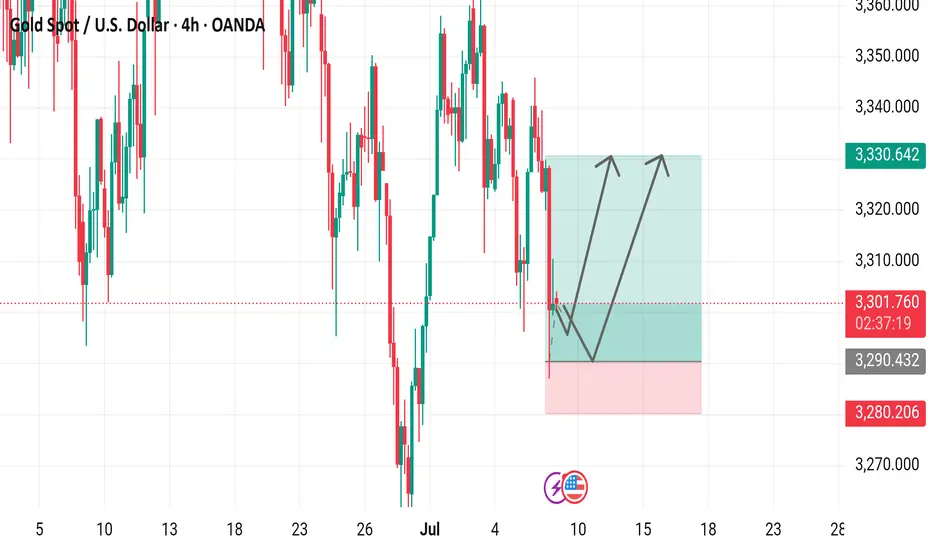
The recent market trend fluctuated violently. Since last Wednesday, there have been three consecutive positive rises. This week, there have been two consecutive negative declines on Monday and Tuesday. On Wednesday, it closed positive after washing up and down. At present, the MA5 and 10-day moving averages have formed a golden cross, but the direction is unclear. The Asian market opened above the moving average on Thursday. The overall pattern needs to pay attention to the breakthrough of the key points of long and short positions.
Today, the focus below is on the support near the low point of 3320, followed by the support near 3315 and 3310. This position is the trend line support formed by the previous low point connection. If it breaks down, we need to pay attention to the position of 3280. The upper resistance level is mainly concerned with the resistance near 3355, which is the rebound high point after the US market hit 3377.
Today, the operation needs to adjust the strategy according to the breakthrough of key points. In the volatile market, we need to be vigilant about the sudden fluctuations caused by the news. After breaking the key support or resistance, the trend direction may be further clarified.
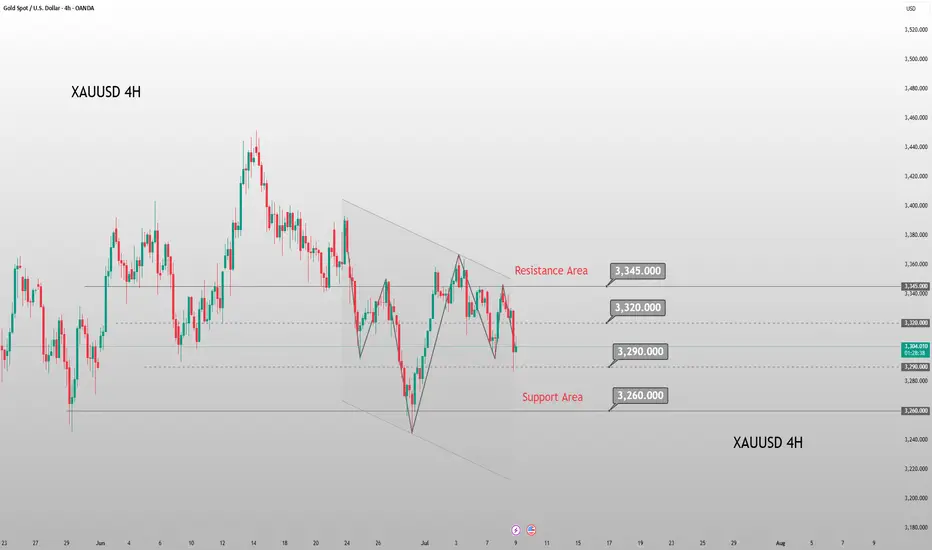
Xauusd4h

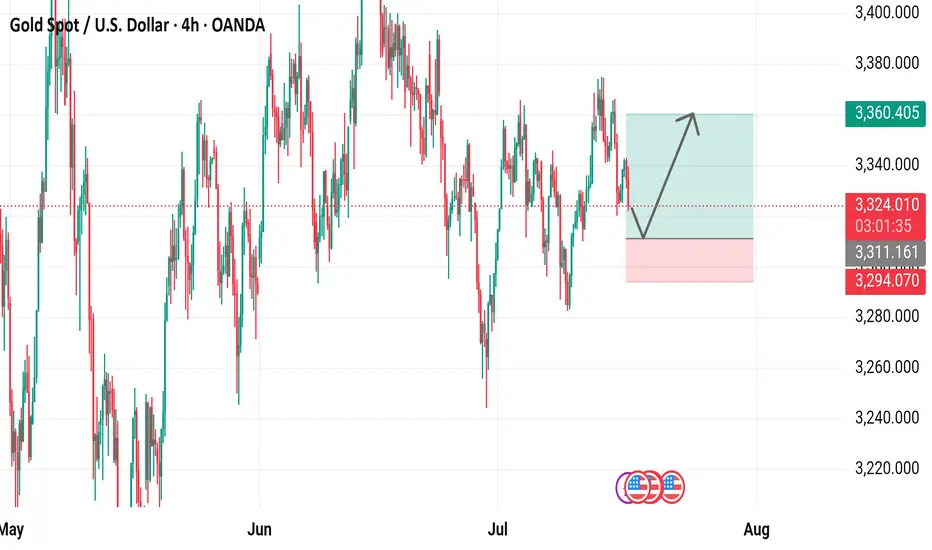
Gold Spot Price (USD) - 4-Hour Chart (OANDA)4-hour performance of the Gold Spot price against the U.S. Dollar (OANDA). The current price is $3,223.660, reflecting a 1.3% decrease. Key levels include a resistance zone around $3,360.405 and a support zone near $3,294.070, with recent price action showing a potential breakout or reversal within these ranges.
7/16: Will Gold Reclaim 3350 or Fall to 3250?During today’s session, gold briefly broke through the 3352–3358 resistance zone, but due to news-driven pressure during the pullback, bullish momentum weakened, and the price retreated to the MA60 support level on the daily chart.
Given the significant retracement, there is a possibility that a short-term bottom may form during the upcoming Asian session, potentially leading to a retest of the 3337-3343/3352-3358 resistance area:
If the price breaks above this zone and holds above it after a pullback, the bullish trend could resume;
However, if it fails to break through or is rejected again, caution is warranted, as this could signal a larger-scale downtrend on the weekly chart, possibly targeting the 3250 area.
Affected by tariffs, gold rose again.On Saturday, Trump announced that he would impose a 30% tariff on goods imported from the European Union and Mexico from August 1. This news triggered a rise in risk aversion in the market. As a traditional safe-haven asset, gold was once again sought after. The price continued the rise on Friday and continued to open high in the early Asian session. As of now, the highest price reached around 3373.
From the current market point of view, after breaking through the triangle pattern last Friday, there was a sharp rise. The price successfully stood on the short-term moving average, showing an overall bullish trend. However, it should be noted that the short-term moving average has not yet formed an upward cross, which means that there is a high possibility of a confirmation process in the future. Looking back at the trend in the past two months, gold rarely opens high and then continues to rise. Most of them open high and go low. Therefore, under the current situation, although it is bullish overall, it is not advisable to blindly chase more. It is more suitable to wait for a decline before arranging more orders. The key lies in grasping the decline position.
From the perspective of pressure level, 3380-3385 is the first pressure level, and the second pressure level is 3395-3400. The support level below is around 3345, which is also the pressure level that has been emphasized in the early stage, and the top and bottom conversion position. For today's operation, Quaid recommends low-to-long.
Operation strategy:
Short near 3380, stop loss 3390, profit range 3360-3345
Long near 3345, stop loss 3335, profit range 3360-3380
Market Structure & Technical Context 14 July 20241. Price Action & Market Structure
Gold has broken recent swing highs above ~$3,360, marking a bullish Break of Structure (BOS) and signaling upward momentum continuity
Recent pullback zones around $3,350–$3,340 formed a clear Higher Low (Change of Character) — textbook price action confirmation.
2. Fibonacci Retracement / Extension
Measuring from the last swing low near ~$3,326 to swing high ~3,374:
38.2% retracement at ~$3,352 coincides with the current bounce zone.
50% retracement at ~$3,350 aligns with key structure support.
Upside extension targets: 1.272 at ~$3,396, 1.618 at ~$3,425 — overlapping major resistance zones
3. ICT & Smart Money Concepts (SMC)
Order Blocks (OBs) identified near $3,340–$3,342 (prior resistance turned support) — ideal demand zone.
A recent Buy-side liquidity grab eclipsed above $3,360, sweeping stops and gathering liquidity before the breakout — classic ICT setup .
A Fair Value Gap (imbalance) lies around $3,345–$3,350 — zone to expect value-driven retracement.
Higher timeframe has clear SMC alignment: BOS above 3,360 with CHoCH already formed.
4. Major Supply / Demand & Support / Resistance Zones
Demand: $3,340–$3,352 (OB + Fib + BOS confluence).
Supply: $3,380–$3,385 (intraday swing high resistance), followed by zone at $3,396–$3,400.
Key resistance at $3,360–$3,362 — confirmed supply pocket that needs to be reclaimed
5. Moving Average Confirmation
The 4‑hour SMA/EMA 100–200 band is sloping up just below current price (~$3,340–$3,350), reinforcing the bullish context .
1‑Hour Intraday Setups (Aligned with HTF Bullish Bias)
Setup A: Pullback into 4‑Hour OB / Fair Value Gap
Entry: Limit buy at $3,345–$3,350.
Stop: Below $3,335 (below imbalance & BOS).
TP1: $3,362 (former resistance).
TP2: $3,380 (next supply block).
Setup B: Breakout Retest of 3,360
Entry: Buy on retest of broken resistance at $3,360.
Stop: Below $3,356.
TP1: $3,380.
TP2: $3,396 (Fib extension confluence).
Setup C: Momentum Continuation Fresh Breakout
Entry: Market buy on clear H1 BOS above $3,365.
Stop: Below breakout candle low (~$3,360).
TP: $3,396 (1.272 Fib) – extend to $3,425 if momentum strong.
The Golden Setup:
Setup A—buy from $3,345–$3,350—has strong confluences:
4‑hour demand OB + fair value gap,
38.2–50% Fib retracement,
SMC BOS/imbalance alignment,
ICT-style order block zone.
This offers high edge with confluence clusters.
✔ Summary Report: Direction & Key Zones
Directional Bias:
Medium-term (4H): Bullish, confirmed by BOS above 3,360, higher lows, OB and Fibonacci alignment.
🔹 Primary Buy Zones:
$3,345–$3,350 — 4H OB + fair value gap + Fib.
$3,360 on retention — breakout retest zone.
Momentum entry >$3,365.
🔹 Key Target Zones:
First resistance: $3,360–$3,362.
Next supply: $3,380–$3,385.
Extension target: $3,396 (1.272 Fib), then $3,425 (1.618 Fib).
🔻 Watchdownside Risk:
Daily invalidation if drop below $3,335 (4H OB break).
Next support at $3,326–$3,330.
📋 Consolidated Table: Setups at a Glance
Setup Entry Zone Stop Targets
Golden $3,345–$3,350 $3,335 TP1: $3,362 / TP2: $3,380
Breakout Pullback $3,360 retest $3,356 $3,380 → $3,396
Momentum BOS >$3,365 (H1 BOS) < $3,360 $3,396 → $3,425
Final Thoughts
On the 4‑hour chart, price is firmly in a bullish regime, supported by price structure, SMC, ICT concepts, and Fibonacci confluence. The $3,345–$3,350 zone is the highest‑probability entry for buyers, offering excellent risk/reward. The Golden Setup targets ~$3,380 and beyond, combining structure, gap fill, and liquidity strategy.

Gold Price Analysis - 4-Hour Chart4-hour candlestick chart for the Gold Spot price in U.S. Dollars (XAUUSD), sourced from OANDA. The chart displays the price movement over time, with green candles indicating an increase in price and red candles indicating a decrease. The chart also features various technical indicators and annotations, including a trend line and a support level.
7/9: Failure to Break Above 3321 May Lead to a Drop Toward 3220Good morning, everyone!
Yesterday, gold tested support and attempted a rebound but failed to break through resistance, followed by a second leg down that broke the support zone, invalidating the potential inverse head-and-shoulders pattern and resulting in a drop below the 3300 level.
On the daily (1D) chart, price has now broken below the MA60, signaling a further confirmation of the bearish structure.
However, due to the sharp drop, a double bottom or multi-bottom structure is forming on the 30-minute chart, which may be building momentum for a potential test of the 3321 resistance zone.
📌 Key focus areas:
If 3321 is broken and held, there is room for a short-term rebound to extend;
If 3321 holds as resistance, the current rebound is likely a short-selling opportunity.
Technically speaking, without the support of bullish news, if gold fails to reclaim and sustain above 3321, there is a strong chance of a further move lower—potentially down to 3220, where the weekly MA20 is located. A deeper decline could even test the 3200–3168 support zone.
📉 Therefore, the primary trading bias remains bearish, with sell-on-rebound as the preferred strategy until a stronger bullish signal emerges. Monitor the 3321 zone closely for direction confirmation.
Wednesday's Gold Trend Analysis and Trading RecommendationsGold surged on Tuesday but then kept pulling back during the U.S. session, hitting a recent new low, with intense seesawing between bulls and bears currently. The fluctuating U.S. tariff policies have triggered volatility in risk-averse sentiment, while the over 95% probability that the Federal Reserve will keep interest rates unchanged in July has provided support to the U.S. dollar.
Technically, focus should be on the key support level around 3260 and the strong resistance range of 3320 above. The hourly chart shows short-term moving averages diverging downward, with candlesticks under pressure and showing short-term weakness, suggesting there is still a need for a pullback tomorrow. The current bull-bear watershed lies at the 3390 mark; if gold fails to break through and stabilize above 3315 effectively, any short-term rebound can be seen as a good opportunity to enter short positions.
The 4-hour chart indicates that gold found support near 3287 and slowly recovered losses, but it remains trapped in a consolidation pattern recently. Although the 3287 support is effective, the consolidation range has not been broken. The future direction depends on the actual defensive strength of the 3260 support level and the direction of the range breakout.
For Wednesday's trading, the main strategy is to go short on rebounds. Focus on the resistance zone of 3315-3320, where short positions can be established. The downside targets are 3270 and the key support level of 3260 in sequence. If 3260 is broken through effectively, it may open up more downward space.
XAUUSD
sell@3315-3320
tp:3300-3280-3260
Investment itself is not the source of risk; it is only when investment behavior escapes rational control that risks lie in wait. In the trading process, always bear in mind that restraining impulsiveness is the primary criterion for success. I share trading signals daily, and all signals have been accurate without error for a full month. Regardless of your past profits or losses, with my assistance, you have the hope to achieve a breakthrough in your investment.
7/8: Inverse Head and Shoulders Pattern, Support at 3321–3312Good morning, everyone!
Yesterday, gold broke below the 3321 support during the session, dropped to around 3296, then staged a strong rebound back toward the opening price—forming a classic deep V-shaped reversal and regaining support above the MA60 on the daily chart.
The market remains in a consolidation phase between the MA20 and MA60 on the 1D chart, with no clear directional breakout yet.
On the 30-minute chart, the previous head-and-shoulders top pattern has been completed with the recent decline. The current structure can be tentatively viewed as the formation of a head-and-shoulders bottom.
If this bullish reversal pattern holds:
The 3321 level must act as valid support during any pullback; deeper confirmation may come from 3312, which corresponds to the previous left shoulder low. Although this was partially driven by a data-related spike, most candle bodies remained around 3321—so 3321 is the primary support, and 3312 is the backup.
If confirmed, the price may advance toward the 3360 target zone.
If the pattern fails, watch for the development of a double bottom formation, with MA60 on the daily chart remaining a key support level.
📌 For today, focus on trading within the 3312–3352 range, using a buy-low/sell-high approach, and stay flexible in response to evolving chart patterns.
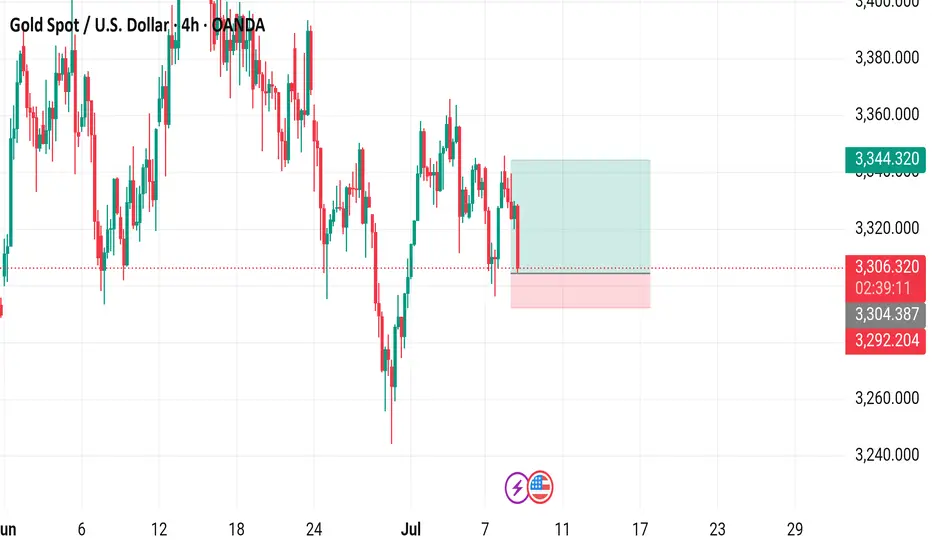
Gold Spot / U.S. Dollar (XAUUSD) 4-Hour Chart - OANDA4-hour chart from OANDA displays the price movement of Gold Spot (XAUUSD) against the U.S. Dollar. The current price is $3,805.780, reflecting a decrease of $30.660 (-0.92%). Key levels include a sell price of $3,305.390 and a buy price of $3,305.940. The chart highlights recent volatility with a shaded area indicating a potential support or resistance zone around $3,344.320. The time frame spans from late June to early July 2025, with the latest data point at 02:41:15 on July 8, 2025.
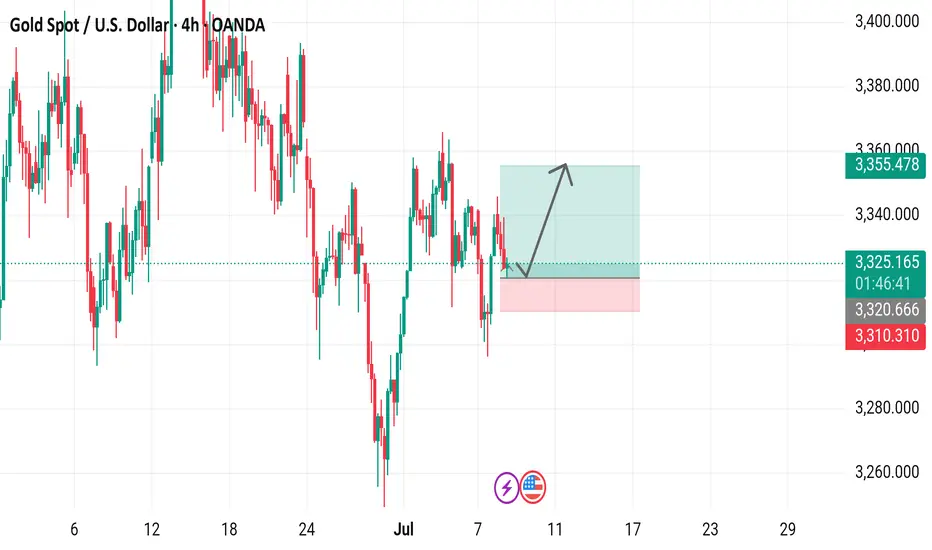
Gold Spot / U.S. Dollar (XAU/USD) 4-Hour Chart4-hour chart from OANDA displays the recent price movement of Gold Spot (XAU/USD) against the U.S. Dollar. The current price is $3,325.120, reflecting a decrease of $11.320 (-0.34%). The chart highlights a recent upward trend with a buy signal at $3,325.410 and a sell signal at $3,324.830, indicating a potential trading range. A shaded area suggests a possible price target or support/resistance zone around $3,355.478, with historical price levels marked on the right side. The timeframe covers the period around July 7-8, 2025.
4‑Hour Technical Framework- 8th July 2025Current Price: ~$3,330
Timeframe Focus: 4‑Hour and 1‑Hour
Directional Bias: Neutral-to-Bearish
Methodologies Used:
✅ Price Action, Fibonacci Levels, Support & Resistance
✅ Supply & Demand Zones
✅ ICT / Smart Money Concepts (BOS, CHoCH, Liquidity, OB, FVG)
4‑Hour Market Structure Analysis
Gold has shifted into a neutral-to-bearish regime on the 4‑hour timeframe, after a decisive Break of Structure (BOS) below prior swing lows at ~$3,345 and a clear Change of Character (CHoCH) as bulls failed to sustain above the ~$3,350 level. Price currently hovers around ~$3,330, consolidating within a bearish Fair Value Gap (FVG) left by the recent impulsive drop.
Key Observations:
A liquidity grab above $3,349 (stop sweep) preceded a sharp reversal, validating this as a sell-side liquidity zone.
The 4H supply zone / bearish Order Block (OB) at $3,345–$3,350 remains unmitigated and likely to attract sellers.
Immediate downside is cushioned by a 4H demand zone & FVG at $3,300–$3,305, which has acted as support during the prior dip.
A deeper daily demand zone rests around $3,280–$3,290, which aligns with historical support and unmitigated buy‑side liquidity.
Key 4‑Hour Levels to Watch
Price Level Type Notes
$3,360–$3,365 Supply / Fib 61.8% Strong resistance
$3,345–$3,350 Supply / OB + 50% Fib Primary sell zone
$3,330–$3,334 Bearish FVG Active imbalance
$3,300–$3,305 Demand / FVG Primary buy zone
$3,280–$3,290 Demand (daily OB) Secondary buy zone
The neutral-to-bearish bias is reinforced by the fact that price has failed to reclaim prior support and continues to respect supply zones.
1‑Hour Intraday Trade Ideas
Zooming into the 1‑hour chart, we align intraday setups with the broader 4H directional bias: selling into supply and covering into demand.
Setup 1: Short at 4H Imbalance
Entry: ~$3,332–$3,334 (inside active FVG)
Stop-Loss: Above $3,335
Targets:
TP1: $3,305
TP2: $3,280
Confluences: BOS + CHoCH, 4H FVG, sell‑side liquidity above.
Setup 2: Short on Retracement
Entry: ~$3,345–$3,350 (50% Fib + OB)
Stop-Loss: Above $3,352
Targets: Same as Setup 1.
Setup 3: Aggressive Long (Countertrend)
Entry: ~$3,300–$3,305 (demand + FVG)
Stop-Loss: Below $3,295
Target: $3,327
Note: Only valid if strong bullish reaction occurs in demand.
The Golden Setup
Sell at ~$3,332–$3,334 (active 4H imbalance) with a target of $3,300.
This setup offers maximum confluence — bearish FVG, BOS, and supply rejection — with tight risk parameters and favorable reward/risk ratio.
Summary Table
Bias Levels of Interest
Directional Bias Neutral-to-Bearish
Strong Sell Zones $3,330–$3,334 and $3,345–$3,350
Strong Buy Zones $3,300–$3,305 and $3,280–$3,290
Closing Notes
Gold continues to respect Smart Money footprints on the 4‑hour chart, suggesting more downside unless bulls reclaim $3,350 decisively. Today’s focus remains on short opportunities at premium levels into supply and imbalances, targeting well‑defined demand areas below.
Watch price action closely in the $3,332–$3,334 zone for the highest‑probability short entry of the session — The Golden Setup.

XAUUSD Outlook: How Risk Sentiment Could Shape the Next MoveI’m currently analysing XAUUSD (Gold) 🟡, which has come under bearish pressure 📉, showing signs of downside momentum. In the video 🎥, we also explore the inverse correlation between Gold and risk assets like the NASDAQ 📊.
Keep a close eye on NASDAQ movements—if risk assets break bullish 🚀, we may see further weakness in Gold. On the other hand, if risk sentiment shifts and risk assets break bearish 🛑, Gold could attract safe-haven demand and gain strength 💪.
We also dive into the price action, market structure, and pull up the volume profile 🧩. Gold is currently trading around the Point of Control (POC) ⚖️—a key level where significant volume has accumulated. A clean break above or below this area could act as a technical trigger for the next move 📈📉.
As always, this is not financial advice ⚠️—just my market view.

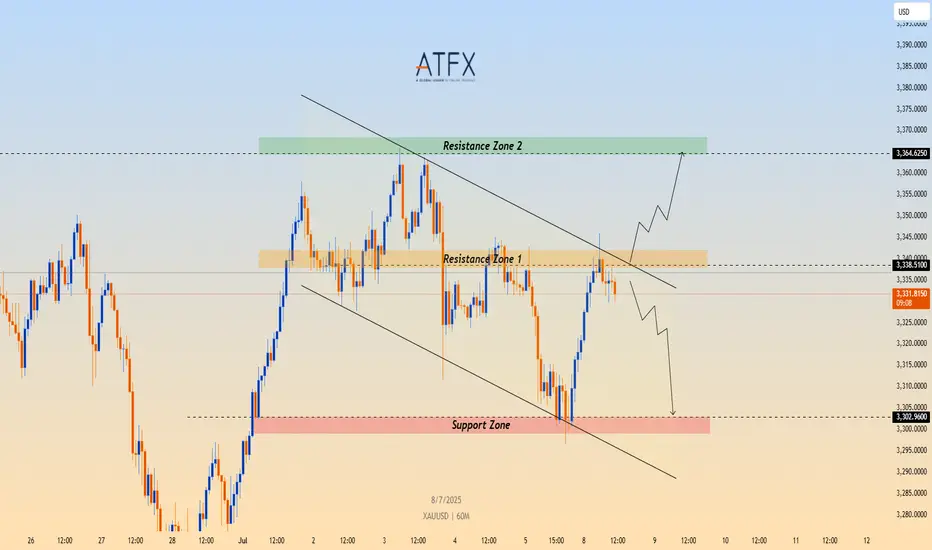
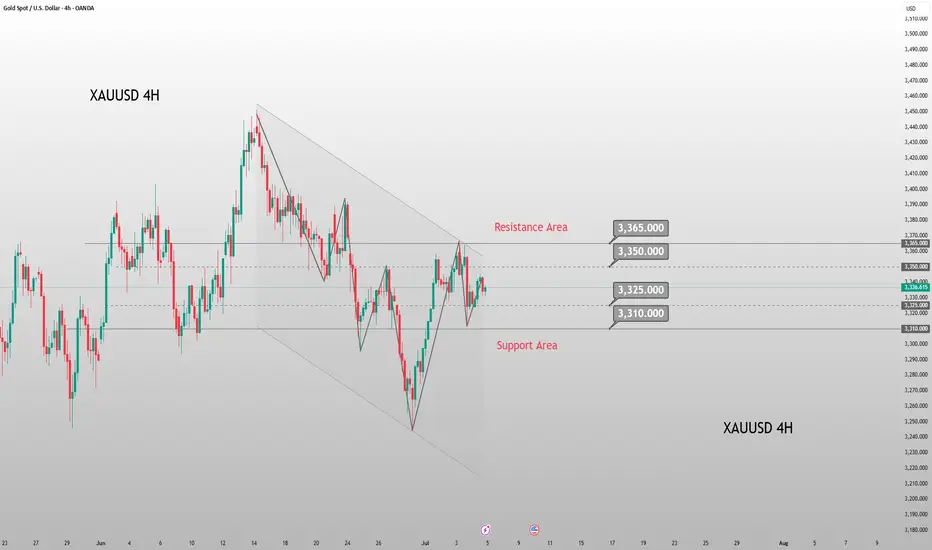
XAU/USD Eyes Key Resistance Amid Fresh Tariff Fears🟡 TVC:GOLD Gold Price Forecast: XAU/USD Eyes Key Resistance Amid Fresh Tariff Fears
OANDA:XAUUSD Spot gold (XAU/USD) is recovering from intraday lows near $3,296, now trading around $3,330 as fears over renewed U.S. tariffs fuel safe-haven demand. President Trump has begun issuing formal letters announcing fresh import tariffs—25% on South Korea, additional measures on Japan, and a 10% universal tariff on countries aligning with BRICS. With the 90-day tariff pause expiring August 1 and no trade progress in sight, geopolitical and economic uncertainty continue to support gold’s floor.
📉 Technical Structure
XAU/USD remains within a descending channel on the 1H chart, with price currently approaching the $3,338–$3,340 Resistance Zone 1. A clean breakout above the upper channel boundary could trigger a move toward the broader $3,364 Resistance Zone 2. Conversely, failure to break above Resistance Zone 1 would keep the bearish channel intact, with downside targets toward the $3,302–$3,305 support zone.
📌 Key Technical Zones
Resistance Zone 1: $3,338–$3,340
Resistance Zone 2: $3,364
Support Zone: $3,302–$3,305
Channel Structure: Bearish unless broken to the upside
📘 Strategy Summary
XAU/USD is showing signs of short-term recovery, but remains technically capped unless it breaks through $3,340 resistance. As long as the descending channel holds, rallies may be sold into. A confirmed break above $3,340 could shift bias toward $3,364, while rejection may reopen the path to $3,305 and potentially lower.
⚠️ Disclaimer
This analysis is for informational purposes only and does not constitute investment advice. Please consult a licensed financial advisor before making trading decisions.
7/7: Key Zone – 3320 to 3350Good morning, everyone!
Due to the U.S. market closure on Friday, price movement remained relatively subdued, and the week concluded with modest gains. As of this morning, gold opened higher but has since pulled back, and the price remains in a consolidation phase.
Key technical levels for today:
Resistance: around 3350
Support: near 3321
Short-term traders may focus on range-bound strategies between these levels. If a breakout occurs, follow the trend accordingly:
If price breaks above and stabilizes above 3338, the market may shift its focus toward the 3400 psychological level;
If price drops below and holds under 3332, there’s potential for a retest of the 3260 support zone.
In terms of broader trend analysis, the MA20 and MA60 on the daily chart should be watched closely, as they currently serve as key dynamic resistance and support levels.
Lastly, stay alert to any developments related to trade tariffs, as such news may significantly impact market sentiment and gold price direction.

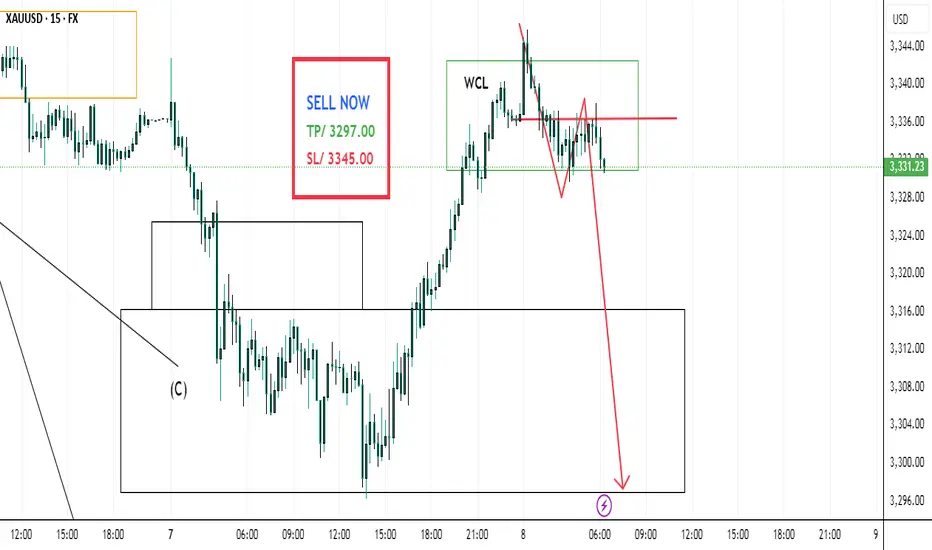
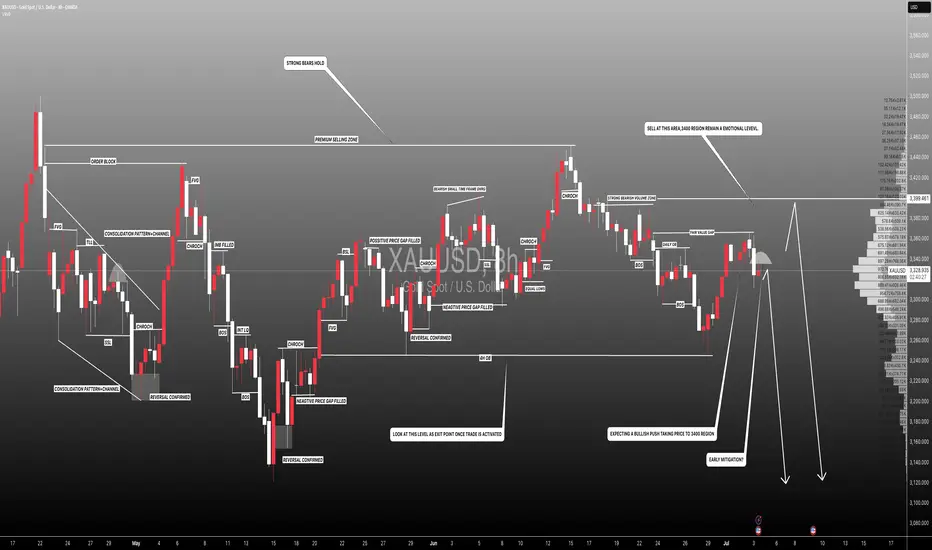
#XAUUSD: Early Mitigation Or Sellers Trap! Let's See Gold dropped after touching 3365 taking price to 3318.Currently ranging market showing confusion over how gold would react to NFP data which is coming out tomorrow. At this moment we are quite certain that price would drop tomorrow either from entry one or entry two. Please use accurate risk management while trading.
Good luck and trade!
Team Setupsfx_
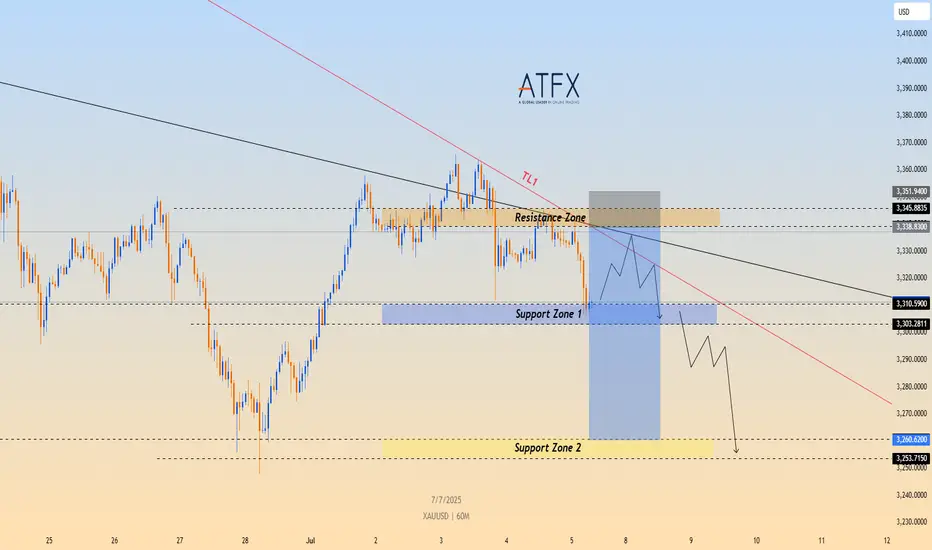
Consolidating Below Trendline Resistance, Bearish Bias IntactTechnical Structure:
OANDA:XAUUSD Gold (XAU/USD) continues to trade below the descending trendline TL1, having failed multiple times to breach the $3,338–$3,345 resistance zone. After retesting Support Zone 1 ($3,303–$3,310), the price is showing signs of a short-term bounce. However, the broader structure remains bearish unless the price can break above TL1.
Key Technical Levels:
Resistance Zone: $3,338 – $3,345
Support Zone 1: $3,303 – $3,310
Support Zone 2: $3,260 – $3,253
Trendline: TL1 continues to act as dynamic resistance
Strategy Insight:
If TVC:GOLD gold remains below the descending TL1, bearish pressure is likely to resume. A short opportunity may arise if the price retests the resistance area and stalls. A confirmed break below Support Zone 1 would expose targets at $3,260 and $3,253.
Disclaimer:
This analysis is for educational purposes only and does not constitute investment advice. Please consult a qualified financial advisor before making trading decisions.
Trump's new tariffs are coming, will gold soar?
✏Hello everyone, let's comment on the gold price next week (July 7, 2025-July 11, 2025)
. ⭐️Gold Information:
This week, the spot gold price showed a trend of rising first and then falling. From Monday to Wednesday, driven by safe-haven demand and the weakness of the US dollar, the gold price recorded three consecutive increases, climbing rapidly from US$3,271/ounce to the intraday high of US$3,365/ounce on Wednesday afternoon, showing strong upward momentum. However, on Thursday, before the release of the June non-farm payrolls data, market sentiment turned, and the gold price plummeted to US$3,312/ounce, the largest single-day drop in the week. On Friday, affected by the light trading during the US Independence Day holiday, the gold price fluctuated between US$3,330 and US$3,355/ounce, closing at around US$3,337/ounce, up about 1.91% for the week.
U.S. President Donald Trump announced that the U.S. will begin sending formal letters to trading partners on Friday, ahead of a July 9 deadline, outlining new tariffs ranging from 10% to 70%, which will take effect on August 1. Treasury Secretary Scott Bessant added that a series of trade agreements are expected before the deadline, with an estimated 100 countries facing reciprocal tariffs of at least 10%. He also hinted that some agreements will be announced soon.
⭐️Labaron personal comment:
Gold prices continue to consolidate sideways, fluctuating in the 3242-3450 range
The following important key areas have been identified:
Resistance: $3362, $3393, $3446
Support: $3312, $3279, $3241
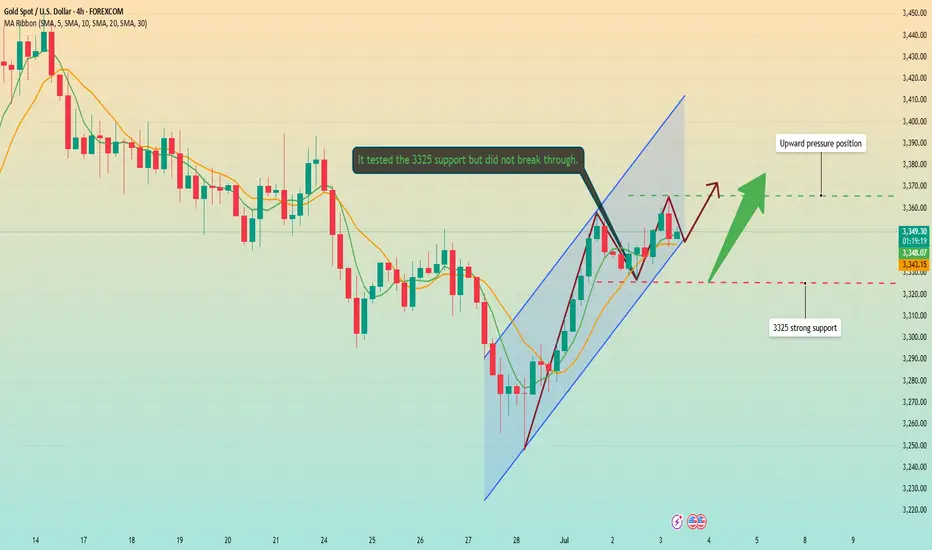
Gold lacks downside momentum: Next week's analysis & adviceGold trading is relatively light today due to the U.S. Independence Day holiday. On the downside, we continue to focus on the short-term support at the 3325 level, while the key resistance above remains in the 3345-3350 range, which was yesterday's breakdown point. The market has closed early today, and price action has been stuck in a range-bound consolidation.
After plunging $40 on the back of bearish non-farm payroll data, gold stabilized and rebounded, recouping nearly half of the losses. This performance confirms that the downside space is limited. Currently, the market has returned to a oscillating upward pattern, and the weekly chart is likely to continue range-bound fluctuations. From a technical perspective, the 3325 level has formed a key support. The secondary retest overnight confirmed the bottom structure, and the gradual lifting of early session lows has also released a bullish signal. Looking ahead to next week, gold is expected to continue its bullish trend. If the 3325 support level below remains unbroken, one can look for opportunities to establish long positions.
XAUUSD
buy@3325-3330
tp:3340-3360-3380
Investment itself is not the source of risk; it is only when investment behavior escapes rational control that risks lie in wait. In the trading process, always bear in mind that restraining impulsiveness is the primary criterion for success. I share trading signals daily, and all signals have been accurate without error for a full month. Regardless of your past profits or losses, with my assistance, you have the hope to achieve a breakthrough in your investment.
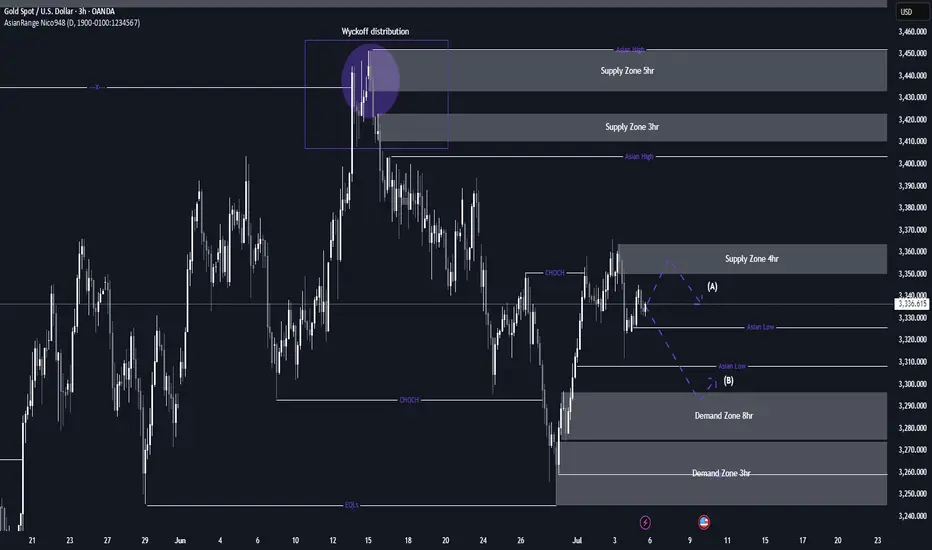
XAU/USD possible shorts from 3,350 towards 3,290 longsThis week, my focus is on a potential sell setup that could form within the 4-hour supply zone, which is currently near price. I’ll be patiently watching for signs of Wyckoff distribution within this point of interest (POI), which could confirm a short opportunity.
Given that price action has been bearish, this would be a pro-trend setup, especially with the visible liquidity resting below that we can look to target. Additionally, there is an 8-hour demand zone further below, which may provide a potential long opportunity once price reaches that level.
Confluences for GOLD Sells:
- Bearish market structure: Gold has been trending downward and has recently left behind a clean, unmitigated 4-hour supply zone, which could prompt a bearish reaction.
- Liquidity targets below: There's significant liquidity under recent lows, including Asia session lows and the 8-hour demand zone, which can be targeted.
- DXY correlation: The dollar has reacted strongly from a notable demand zone, suggesting potential upside for DXY, which may add bearish pressure on gold.
- Higher timeframe Wyckoff: A Wyckoff distribution pattern has also formed on the higher timeframe, which may indicate temporary bearish order flow.
P.S. If price disrespects the current 4-hour supply zone, I will shift focus to an extreme 3-hour supply zone above. Until price reaches that level, I may look for short-term buy setups to trade the move up.
Wishing everyone a great and profitable trading week! Stay disciplined and manage risk accordingly.
Non-farm data is coming. Upward breakthrough?Information summary:
ADP data supports the rise of gold. Secondly, the weaker-than-expected non-farm data has triggered people's hope that the Federal Reserve will cut interest rates earlier. The gold price hit the 3360 mark, then fell back slightly, and is currently fluctuating around 3350.
This Friday is the Independence Day holiday in the United States. The non-farm data will be released on Thursday. Today, we will focus on this data, which will trigger a new trend.
Market analysis:
From the 4-hour chart, gold is currently in a suppressed state. However, it is not ruled out that it will be supported at the bottom as before, and then break through the upper suppression position again with the help of non-farm data.
Therefore, the most critical position today is not above, but near the support of 3325 below. On Wednesday, the support near 3325 was tested many times but did not break down. If the price remains above this position today, the probability of an upward breakthrough is very high.
Based on the current market conditions and the data to be released soon, Quaid recommends that everyone wait and see for a while and wait for the new trend to come. Of course, according to the current forecast data, this will support the rise of gold. A radical approach can also try a long strategy around 3345.
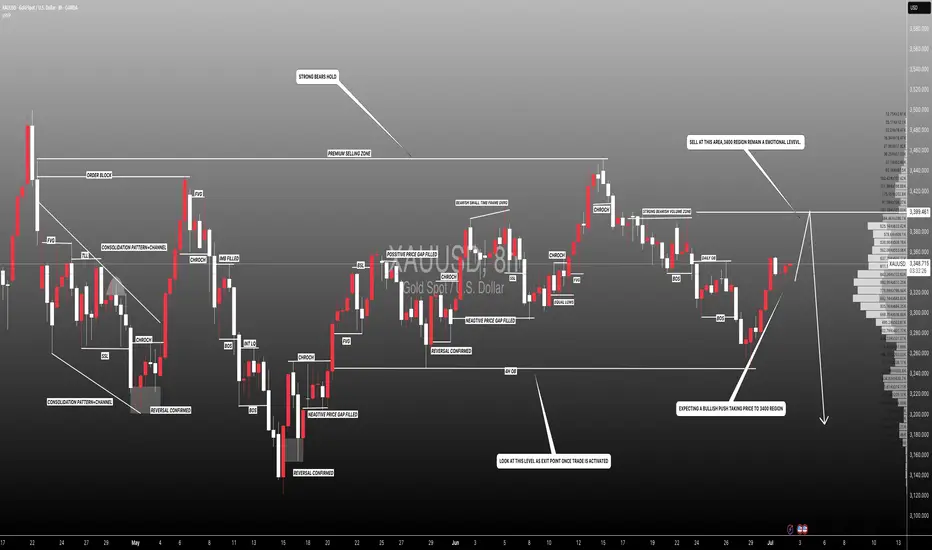
#XAUUSD: +2000 Swing Sell In Making! Get ReadyGold has dropped to the 3330 region but has now reversed and is currently trading at 3350. The next potential move could be at 3380, followed by 3400. Our sell entry is at 3400, where we believe the price will reverse. Our long-term view is that gold will head towards 3100, but our first target will be 3200. Please use accurate risk management when trading gold, as it can cause serious financial issues if not planned properly. This analysis does not guarantee any price movement.
Good luck and trade safely!
Team Setupsfx!