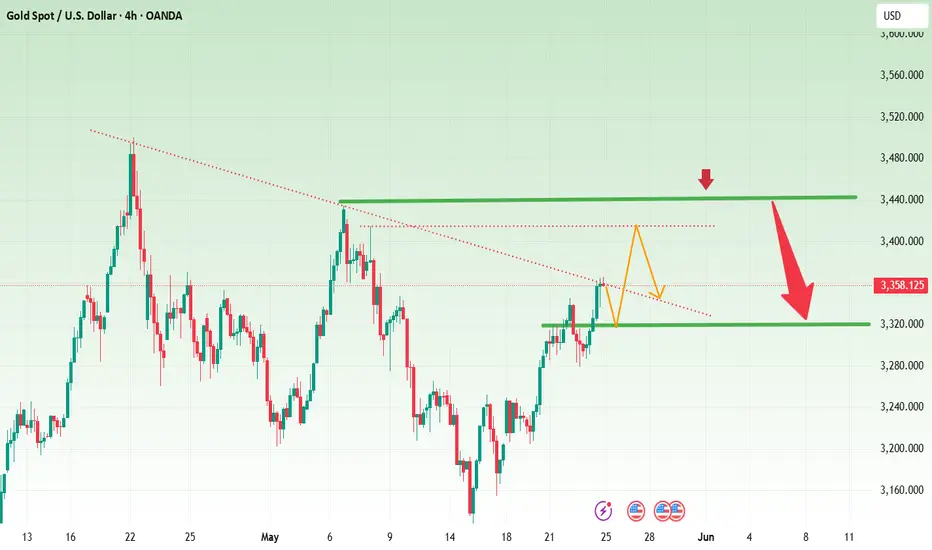
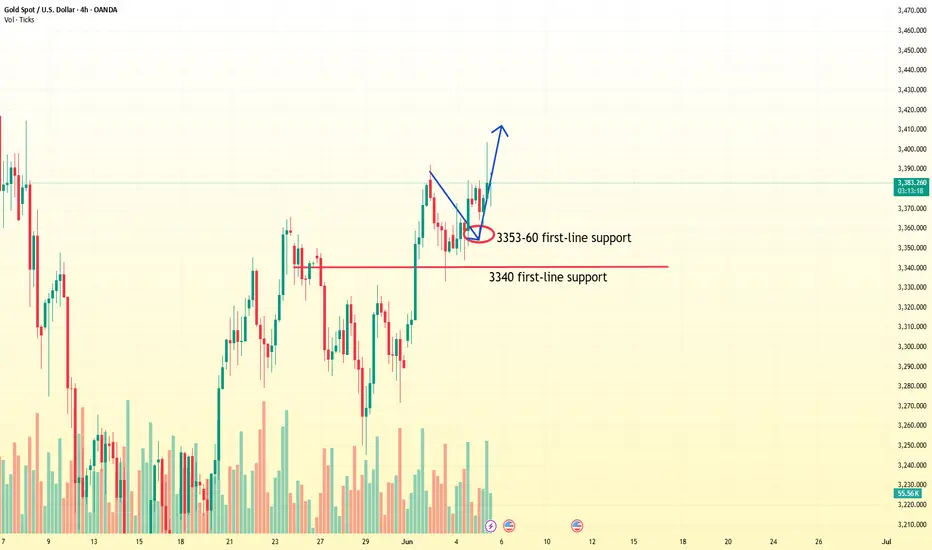
As long as gold falls, you can continue to buyNow we continue to pay attention to the short-term support of 3353-60. Today, we focus on the important support position of 3338-45. The trend is still mainly to do more after stepping back. We must operate under the premise of following the general trend. Only in this way can we achieve stable operation. If your current gold operation is not ideal, I hope I can help you avoid detours in your investment. You are welcome to communicate with me!
From the 4-hour analysis, the short-term support below focuses on the 3354-62 line. The daily level stabilizes at this position and continues to see the strong upward rhythm of bulls. Focus on the support of 3338-45. Pay attention to the suppression of 3395-3400. Keep the main tone of low-multiple participation around this range during the day. In the middle position, watch more and move less and be cautious in chasing orders, and wait patiently for key points to enter the market. I will remind you of the specific operation strategy during the trading session, and pay attention to it in time.
Gold operation strategy:
1. Buy when gold falls back to 3353-3362, and buy when it falls back to 3340-45, stop loss at 3336, target at 3395-3400;
Xauusd4h
Gold intraday trading strategyFrom the 4-hour line analysis, today's lower support continues to focus on around 3170-75, strong support is at the 3150 mark, and upper pressure is around 3253-60. Relying on this range as a whole, the main tone of high-altitude and low-multiple cycles remains unchanged. In the middle position, watch more and do less, be cautious in chasing orders, and wait patiently for key points to enter the market.
Gold operation strategy:
1. If gold falls back to 3170-75 and does not break, hold a light long position; if it falls back to 3150-55, add a long position; stop loss at 3144; target at 3226-3230; continue to hold if it breaks;
2. If gold rebounds to 3240-45 and does not break, hold a light short position; if it rebounds to 3253-60, add a short position; stop loss at 3266; target at 3275-80; continue to hold if it breaks;

Russia-Ukraine deadlock, tariff gold will rise 3400 this weekRecently, the escalation of the Russian-Ukrainian conflict and global trade tensions has pushed the international gold price to rise strongly. Although the second round of negotiations between Russia and Ukraine reached a consensus on the exchange of prisoners on Monday, the ceasefire agreement is still deadlocked. Coupled with the US announcement of additional steel tariffs, geopolitical risks and economic uncertainties have stimulated risk aversion. The price of gold rose violently from around $3,290 at the beginning of the week, with a single-day increase of more than $100 to $3,392, setting a new stage high.
From a technical point of view, the C wave upward trend of gold from $3,120 is clear. After breaking through $3,340 on Monday, it accelerated to the 61.8% Fibonacci resistance level of 3,396, but the pressure of the 3,400 integer mark is significant. If it cannot be effectively broken through, the gold price may enter the range of $3,396-3,340 for consolidation. Current market sentiment and technical signals suggest that the bullish trend has not changed.
At noon, the gold price was around 3,353. The lower support of 3,353-3,350 can be deployed for long orders with a stop loss of 7 points. The general trend is bullish

Gold-Asian market rises, what is the trend?Event summary:
On Wednesday in the Asian market, spot gold fluctuated slightly and is currently trading around $3,370/ounce.
There are two reasons for the strong rise in the Asian market: 1. Ukraine directly blew up 41 Russian fighter jets; 2. The tariff storm re-emerged, and Trump is expected to impose a 50% tariff on steel and aluminum. The tense international situation and tariff storm have become important factors that disrupt the market.
Market analysis:
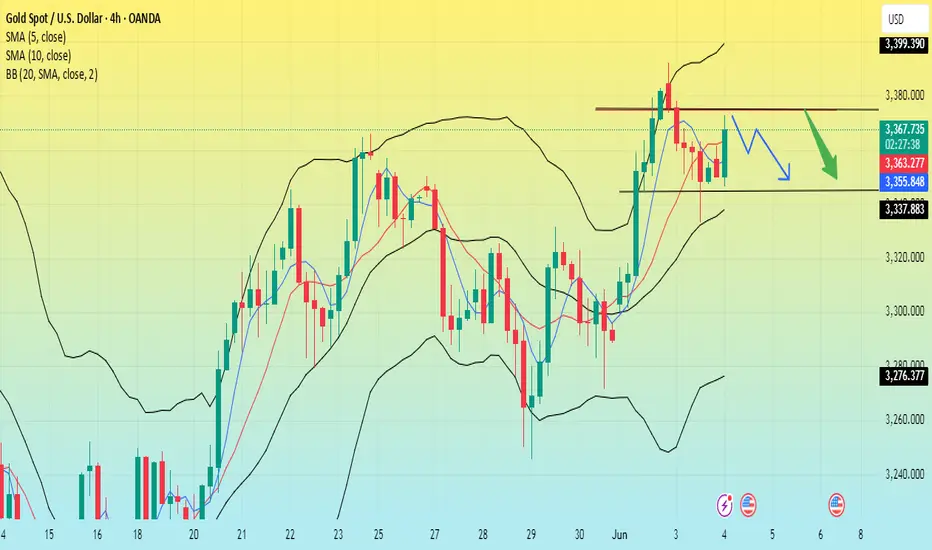
The four-hour chart shows that the current price is still running above the middle track of the Bollinger Band channel, and the MA10-day moving average and the 5-day moving average are running above 3,340. Due to the wide fluctuations in the market, short-term participation is the main option. Intraday callbacks are still mainly low and long.
Gold rebounded directly in the early trading, and the center of gravity of the low point of the rebound is also constantly moving up. From the current market, the short-term gold price has stabilized above the top and bottom conversion position of 3,340, and it also remains above the rising trend line, and the bulls are strong.
In the early trading, the gold price fell back to the lowest level of 3346, and it formed a Yang-enclosing-Yin pattern, which means that the bulls' energy is relatively strong. We only need to pay attention to two points in the early trading, namely the key level of 3330 and the short-term support level of 3346. If it falls back to around 3350 during the trading session, we will start to go long.
Operation strategy:
Short at 3375, stop loss at 3385, target 3340-3320;
Long at 3345, stop loss at 3333, target 3370-3400;
Here's a weekly buy-side analysis🟢 Bias: Bullish (Buy)
Gold remains in a long-term uptrend, with fundamental and technical factors supporting continued upside.
50 & 100 EMA: Price is well above both EMAs, confirming bullish momentum.
RSI: Around 60–70 on the weekly; no bearish divergence yet.
MACD: Histogram ticking upward with bullish crossover in play.⚠️ Risk Factors
Sudden USD strength due to surprise Fed hawkishness.
Strong U.S. labor or inflation data that pushes bond yields higher.
Gold profit-taking near ATH could cause sharp but temporary pullbacks.
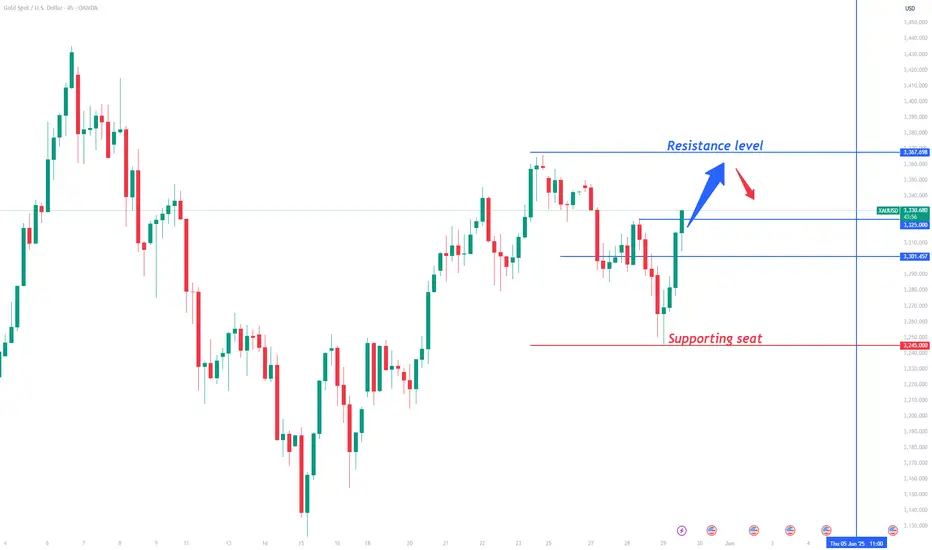
Trade conflicts are re-emerging, will gold rise?Information summary:
Gold prices rose slightly in early Asian trading on Monday, affected by the long-term uncertainty of tariffs and international geopolitical conflicts, which increased the demand for safe-haven assets.
Trump made a statement earlier that China had violated the Sino-US trade negotiation regulations in a big way; then the US Treasury Secretary assured that the United States would never default. This has once again led to tensions in Sino-US trade relations, and investors are also cautious about this news.
This news has undoubtedly disrupted the international market and supported the rise in gold prices.
Traders need to pay attention to the May ISM manufacturing report to be released by the United States today, which may affect the new trend of gold.
Trading analysis:
I think the repeated emotions of the United States on tariffs will cause gold prices to rebound after a downward adjustment, and then fall slightly.
If gold cannot break through the upward 3350 cycle pressure level strongly and stabilize above this position. Then the price will fall back below this position.
Operation strategy:
Long at 3340, stop loss at 3330, take profit at 3350.
Short at 3350, stop loss at 3365, profit range is around the early support level of 3300-3390.
If you want to trade steadily, you can continue to wait and see for some time, because there are too many black swan events in the Asian market today, and the market is full of uncertainty.

Gold price rebounded. Strategy is coming.Gold rose yesterday under the stimulus of risk aversion; gold did not continue the upward trend today, which means that the risk aversion sentiment of gold has been digested. The 4-hour moving average of gold formed a dead cross, and MACD also formed a dead cross. Then gold is likely to maintain the morning support position near 3290 for oscillation.
I think we can continue to short after gold rebounds. After the opening of the US market, the rise of gold has been under pressure at the 3310 line and cannot break through. Gold rebounded under pressure at 3310 and continued to short on rallies.
The market situation is changing all the time. We cannot always use the same trading strategy. If the price fails to rise, we will implement a short strategy; in line with the changes in the market, we can make profits faster.
Operation strategy:
Short near 3305, stop loss 3315, profit range 3270-3260.

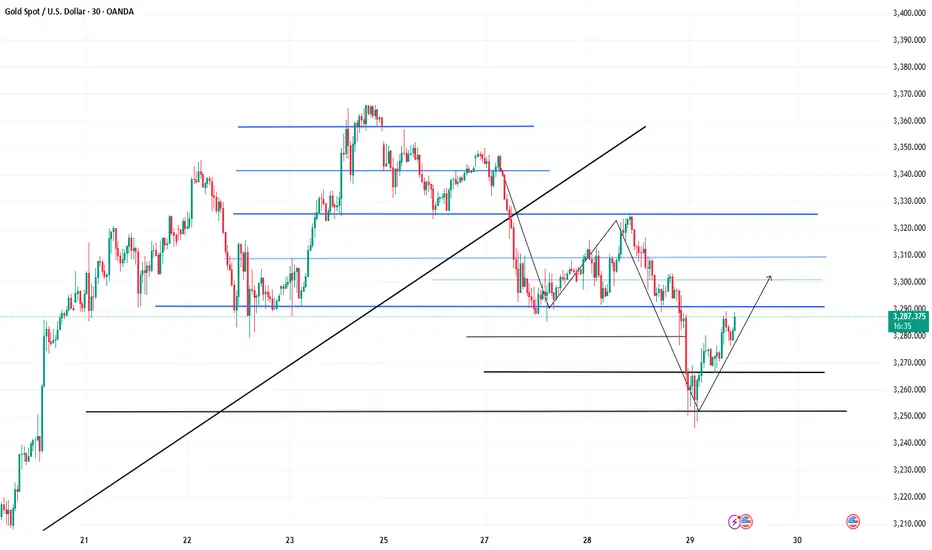
5/30 Gold Analysis and Trading SignalsGood morning everyone!
Yesterday, we successfully executed short at 3290 and long at 3250, and also entered the 3316–3328 short zone near the close. All signals were hit, and profits were solid ✅.
📉 Technical Outlook:
The 1-hour chart remains in a clear bearish trend, indicating that this pullback is not yet complete.
Initial support at 3296 is very likely to break
Focus shifts to 3278 support, though it appears technically weak
If price hits 3278, a minor bounce is expected, but it's likely just a retracement, not a reversal
🗞 Fundamental Watch:
The U.S. Consumer Confidence Index will be released during the U.S. session today.
Market reaction is expected to be similar to yesterday’s initial jobless claims — possibly triggering short-term moves, but not changing the broader trend.
📈 Trade Plan for Today:
📉 Sell in the 3316–3328 zone (key resistance)
📈 Buy in the 3238–3221 zone (key support area)
🔁 Scalp/flexible trading zones:
3303 / 3288 / 3276 / 3265 / 3252 / 3238
Stick to proper risk management, and stay alert during U.S. data releases.
Trade with the trend and close the week strong!
Additionally, on the 30-minute chart, gold appears to be forming a potential inverse head and shoulders pattern. If this pattern completes and breaks the neckline successfully, the price may surge toward the 3336–3352 area, or even up to 3360.
For those considering short positions, it’s crucial to control position size and avoid entering too early. Try to wait for price action to reach higher resistance levels before making a move. Don’t worry about missing a perfect entry — even if one trade is missed, it won’t affect your overall profitability for the week.
The market always offers opportunities. Stay calm, stick to your strategy, and remember: consistency and patience lead to long-term success.

Data is out. Gold is fluctuating.Information summary:
On Wednesday, US time, the Trade Court ordered an immediate halt to tariffs; the next day, the Federal Court of Appeals immediately resumed the policy. At the same time, the Trade Court was required to respond by June 5, and the government by June 9. Tariff policies are back and forth, and it is difficult to figure out. In other words, don't expect the US government to come up with any good news.
Today, the annual rate of the US core PCE price index in April was 2.6% in the previous value and 2.5% in the expected value. The expectation seen at the beginning of the week was 2.6%. Now the expectation is directly lowered. Is it to leave room for this announcement? If the increase is not higher than the previous value, it is not a significant increase, but it leaves room for interest rate cuts. For gold, the increase is not higher than the previous value, and the short position is limited.
This mediocre data can directly provide a basis for speculation on the current economic situation in the United States.
After yesterday's strong rise, with a very long lower shadow left on the middle track of the Bollinger Band, after stabilizing the middle track, the fast and slow lines further converged and flattened, indicating that the main funds are also hesitating. From this perspective, today's market may continue to fluctuate within the middle track.
At the same time, the closing line is also the most critical, which is around 3285-90 near the middle track.
Operation strategy:
Today's trading needs to pay attention to the cycle suppression position of 3315-3330 on the upper side, and the cycle support level of 3385-3380 on the lower side. This range can be maintained for scalping trading.
If the gold price breaks through strongly upward or downward, the new trend will be realized in a very short time, so traders need to make profits and stop losses in time.

Gold Price Action Update – Smart Dip Buy Pays Off!Yesterday, gold dipped to around 3290, followed by a minor rebound.
Today, as expected, it broke down through the 3280 level decisively—just as we discussed:
🔻 A break below 3280 likely means a gap fill toward 3259.
✅ For those who followed the plan and went long below 3266, the trade worked beautifully—
Gold dropped to a low of 3245, effectively filling the gap, and has since rebounded back to the 3280 area.
📈 What’s next?
Now that the gap is filled, gold is likely to retest the $3300 zone in the short term.
With price currently around 3280, there is still room to the upside.
➡️ If you're holding long positions, you can consider holding a bit longer for potential further gains.
🚨 BUT—this was only a single bottom test.
That means there's still a chance of a second dip before the trend fully reverses. So:
🛡 Risk management remains crucial.
If you're okay with some profit pullback, it's fine to stay in.
If not, consider securing partial profits and setting trailing stops.
🎯 Key levels to watch:
🔼 3300 – Main resistance zone; focus on whether it breaks or rejects;
🔽 3276–3263 – Support range on any pullback; good zones to watch for fresh entries if support holds.
📌 Trading Strategy Outlook:
For now, continue to buy on dips as long as support holds, and monitor 3300 resistance closely.
If price fails to break above, we may see a pullback—but as always, with proper planning, we stay profitable.
Gold drops to support then rebounds; 3325-3330 key bull-bear levAnalysis of Today's Gold Volatility 🔥
The ruling on Trump's tariff overreach and the Fed's cautious stance on rate cuts have delivered a double blow 💥, instantly "freezing" market risk aversion 🧊! Gold prices plunged to a low of 3245 intraday, with the 3245-3250 zone acting as a "safety air cushion" 🛡️ that firmly halted the decline. The price is now rebounding to test resistance near yesterday's high, where the 3325-3330 level has become a "life-or-death line" ⚔️ for bulls and bears, with a showdown imminent!
Trading Strategies (Emoji Signal Guide 📌)
1. Short on Rebound 🚀➡️📉
Entry: Lightly short in the 3325-3330 range (Bearish "sniper zone" 🎯)
Stop Loss: 3335 (Break above resistance? Run 🏃♂️!)
Targets:
First target: 3280 (Bearish "first charging station" 🔋)
Second target: 3250 (Test support validity 🔍)
2. Long at Support 📉➡️📈
Entry: Lightly long after stabilizing above 3250 (Bullish "rally call" 📢)
Stop Loss: 3240 (Break below support? Retreat fast 🚑!)
Targets:
First target: 3280 (Rebound "mini-peak" ⛰️)
Second target: 3300 (Challenge "mid-fortress" 🏰)
Risk Warning ⚠️: Beware of volatile swings from Fed speeches! Exit immediately if prices break above 3330 or below 3240. Control positions and avoid emotional trading 🚗💨!
Professional trading strategies are pushed daily 📊
Lock in precise signals amid market fluctuations 🚀
Confused about market trends? Stuck in strategy bottlenecks?
Real-time strategies serve as your "trading compass" 🌐
From trend analysis to entry/exit points, dissect market logic comprehensively
Refer now 📲
Help you move steadily forward in investments ✨
👇👇👇
5/29 Gold Analysis and Trading SignalsGood morning everyone!
Yesterday, gold rose first and then declined. Our long positions targeting 3318–3326 were completed successfully, and we timely shifted to short positions, resulting in another round of solid profits.
📉 Technical Outlook:
Gold remains in a bearish trend, and is now very close to the 3275 support level. Based on the current price structure, a break below this level is highly probable.
If $3275 is breached, focus on key support at 3258–3238
Resistance levels to watch: 3298–3318
The daily (1D) chart is currently in an indicator correction phase, so today's trading bias is selling from higher levels
🗞 News Focus:
Watch for U.S. initial jobless claims data today. It may offer short-term support for gold, but is unlikely to reverse the broader bearish trend.
📈 Today’s Trade Plan:
📉 Sell in the 3316–3328 zone (resistance zone)
📈 Buy in the 3245–3232 zone (key support area)
🔁 Scalp/flexible trading levels:
3303 / 3288 / 3276 / 3258 / 3247
Stay adaptive and combine news with price action at key levels for best results.
Wishing everyone a successful and profitable trading day!

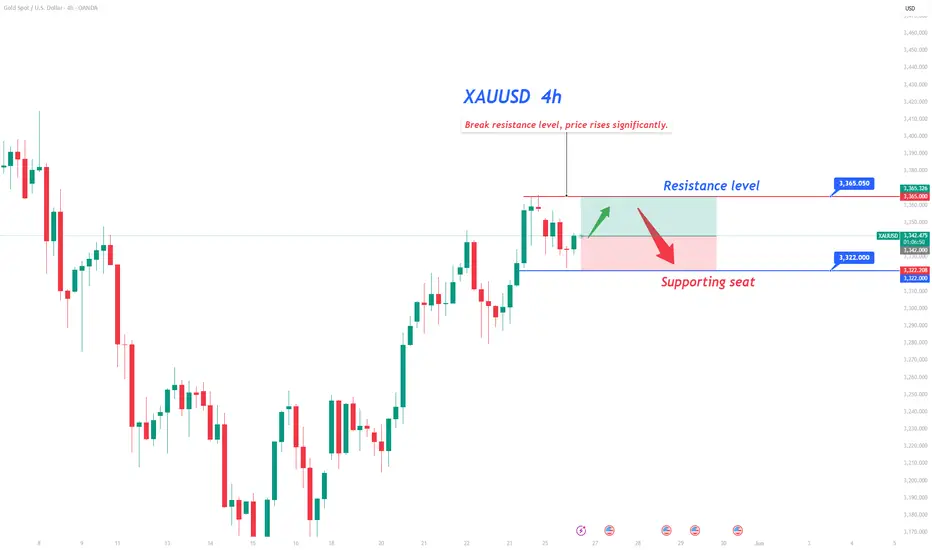
XAUUSD Idea: Structure, Fibonacci Setup & S&P 500 Correlation📉 XAUUSD Trade Outlook 🧠🔍
Currently analyzing Gold (XAUUSD), and things are getting interesting. On the daily timeframe, we’ve seen a clear bearish break of market structure, and this shift is also evident on the 4-hour chart. 🕰️📉
I’m watching closely for a bullish retracement into my key Fibonacci 61.8% level, where I’ll be looking for confirmation of a bearish structural break to initiate a short position. 🎯🔽
When we compare this setup to the US500 (S&P 500), it becomes even more compelling. The indices have rallied hard and appear overextended — a correction seems likely. 📊🧾
If we do get that pullback in the indices, gold may rally temporarily, but my overall bias remains bearish. If the indices resume their uptrend after a pullback, I expect gold to weaken further, aligning with my current short-side outlook. ⚠️📉
🛑 This is not financial advice. Always do your own analysis and manage risk according to your trading plan.
💬 What are your thoughts on gold right now? Are you leaning bullish or bearish? Let me know in the comments! 👇

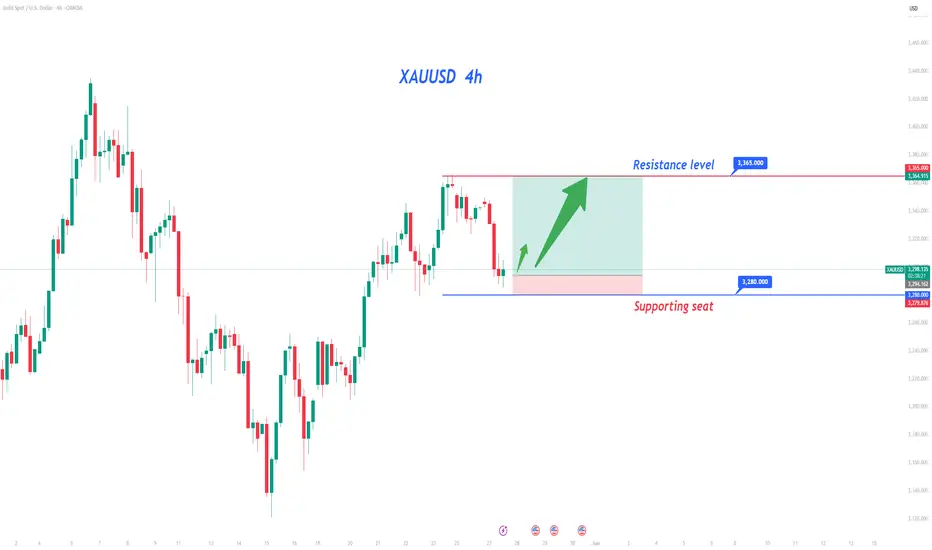
Gold Bull vs. Bear Battle: Trading Guide Between Support at 32804-hour chart bullish trend, support at 3280-3285, resistance at 3360 ⭐️.
Long Positions:
Go long on pullback to 3280-3290 📊🎯.
Stop loss: 3270
Targets: 3320 → 3330
Add positions if price holds above 3330 🌟.
Targets: 3350 → 3360
Short Positions:
Short on rally to 3350-3360 ⚠️📉.
Stop loss: 3370
Targets: 3330 → 3320
Risk Control:
Always use stop loss and take profits in batches ✨.
Professional trading strategies are pushed daily 📊
Lock in precise signals amid market fluctuations 🚀
Confused about market trends? Stuck in strategy bottlenecks?
Real-time strategies serve as your "trading compass" 🌐
From trend analysis to entry/exit points, dissect market logic comprehensively
Refer now 📲
Help you move steadily forward in investments ✨
👇👇👇

Will the gold market usher in a new trend?The Trump administration postponed the imposition of a 50% tariff on the European Union and extended the implementation date to July 9. This unexpected decision became the fuse for the violent market fluctuations. The European Union responded positively, and the US-EU trade negotiations ushered in a buffer period, but the global market has been affected, and the gold market has fallen into a dilemma of long and short interweaving.
On Tuesday, the overall gold price showed a downward trend. The price rose to $3,349.85 on the day, and the lowest price reached $3,285.21, closing at $3,300.4. After the opening of the US market, the price fluctuated upward in the short term, and the price ended in a big negative on the day. It is not suitable to be bearish at present before the price falls below the daily support.
From the daily level, the current daily level support is around $3,275, and the price may fluctuate upward above this position. At the same time, from the four-hour level, yesterday's price fell below the four-hour support of $3,320, and then continued to fall below the important support position of $3,300 on the daily line; and the short-term pressure is relatively large, so it is necessary to pay attention to the 3275-3320 range for the time being; this fluctuation range is also the middle area between the 5-day MA moving average and the 10MA moving average, and the price will continue after breaking through the range.
Operation strategy:
Scalping transactions are carried out in the fluctuation range of $3,290-3,315.
Quaid reminds all traders: You need to always pay attention to the direction of price trends, take profits in time, and avoid losses caused by unexpected events affecting price trends.

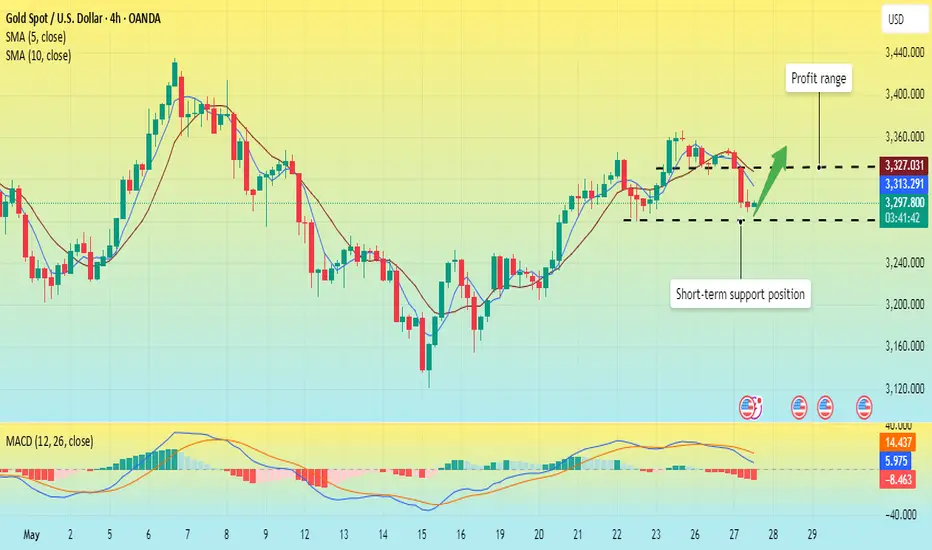
Gold retracement adjustment. Pay attention to the timing.Gold prices continued to fall today, hitting a low of $3,285, and are currently recovering briefly.
I think there is room for profit in the long strategy, but the hourly line is only a single positive rise. Overall, the probability of volatility correction is still high. Compared with the short-term resistance position of 3,320, the correction is still within the normal range.
From the 4-hour chart, the 60-day MA of $3,320 has a certain suppression position on the upward trend, followed by the 90-day MA of $3,285, which provides strong short-term support. Today's price drop also failed to break through this support position; so this week will continue to fluctuate sharply, and the large fluctuations up and down are to accumulate momentum for the next wave of rise. The basic operation strategy of the bulls has not changed, but just a halftime break.
Operation strategy:
Buy near $3,295, stop loss at $3,285, and the profit range is $3,320-3,330.

Gold Bull vs. Bear Battle: Trading Guide Between Support at 3280Bullish on the 4-hour chart, support at 3280-3285, resistance at 3365 ⭐️.
Long Positions:
Go long on pullback to 3280-3290 📊🎯.
Stop loss: 3270
Targets: 3320 → 3330
Add positions if price holds above 3320 🌟.
Targets: 3355 → 3365
Short Positions:
Short on rally to 3350-3360 ⚠️📉
Stop loss: 3370
Targets: 3320 → 3330
Risk Control:
Always use stop loss and take profits in batches ✨.
Gold Trading Strategies
buy@3280-3290
tp:3320-3330
sell@3350-3360
tp:3320-3330
Professional trading strategies are pushed daily 📊
Lock in precise signals amid market fluctuations 🚀
Confused about market trends? Stuck in strategy bottlenecks?
Real-time strategies serve as your "trading compass" 🌐
From trend analysis to entry/exit points, dissect market logic comprehensively
Refer now 📲
Help you move steadily forward in investments ✨
👇👇👇
Economic data released. Start of a new trend?The international gold market suffered a sharp sell-off, and the spot gold price once fell below the key psychological mark of $3,300/ounce, reaching a low of $3,392.59, as the US dollar index rebounded from a low of more than a month and concerns about the international trade situation cooled down.
The gold price is currently in a short-term recovery phase, and the downside risk is temporarily lifted. In the long run, the expansion of the US fiscal deficit may support the gold price; but in the short term, according to the latest data released by the United States, it is conducive to the long operation of gold, and the gold price will rise briefly.
Gold is strong in the short term, but traders need to take profits in time to avoid unexpected events that cause trend changes.
Overall, the short-term trend of gold prices is still subject to the US dollar, interest rate expectations and economic data, and the competition for the $3,300 mark will become the key.
The US economic data is within the expected range, and gold has a short upward trend.
Operation strategy:
Buy near $3290, stop loss at $3280, profit range at $3320-3330.
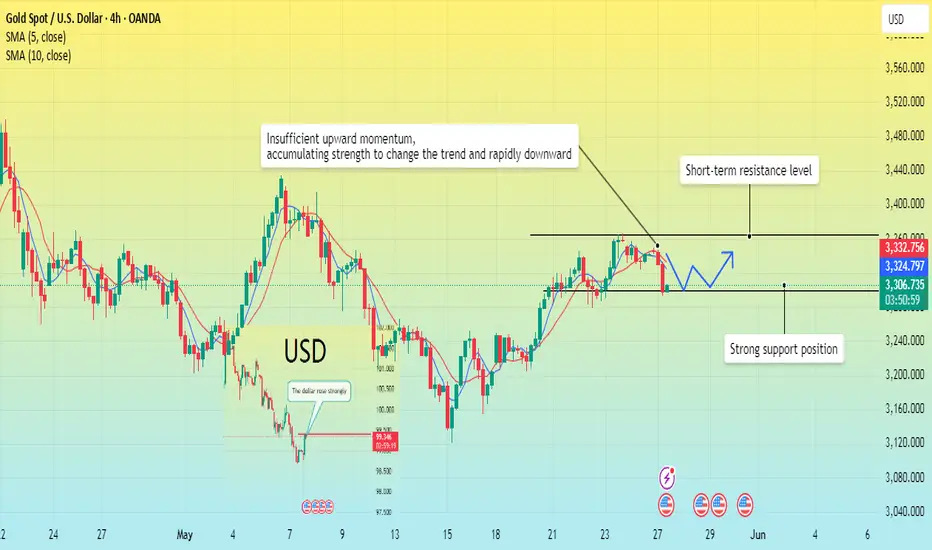
Gold plummeted? Here comes the latest analysis.Today, the gold market continued its downward trend. It failed to break through the key resistance level of $3,365 in the early stage, and then fell under pressure. It is a normal price adjustment for the Asian market to break through the previous support level. The current price fluctuates around the strong support of $3,300. Coupled with several news to be released in the United States, the price trend is full of uncertainty. In this period of time, I don’t think it is suitable for shorting.
From the 4-hour chart, gold has insufficient upward momentum. After failing to break through the upward resistance level for a long time, it began to decline.
In the market last week, the price has always fluctuated between $3,330 and $3,365. In the narrow range of fluctuations, once a new trend appears, whether it is upward or downward, it may accelerate the price fluctuation range in a very short time; this is an instant release after accumulating energy. This is why the Asian markets suddenly started to move downward.
From the current market situation, the bulls are under great pressure, which is completely different from the strong upward pattern last week. At present, the trend of gold is more dominated by weak fluctuations.
Based on the current trend, we still follow the strategy of high-altitude and low-volume trading in our operations.
Gold Trading Strategy for the 27thOn the 4-hour chart today, the bullish trend of gold remains intact ⭐️✨📈 ⚠️📉
The current price is facing resistance at 3365 near the previous high. Due to the excessive release of early bullish momentum, a period of adjustment is usually required 📉
However, with further news-driven stimuli this week, gold may still surge sharply 🚀
The key lies in the morning session's trend, so timing is crucial when judging the strength of bulls and bears ⏰
It is expected that gold will continue the pattern of oscillating upward movement, and pullback opportunities can be captured 📈
Resistance is at 3365, and support is at the 3320 level 🔍
Long Position Strategy:
If the gold price retracts to the 3320-3325 range, consider opening a long position 📊 Set the stop-loss at 3317, with targets at 3340-3350 🎯
If the price holds above 3320, try opening a long position 🌟 The initial target is 3345, and if 3345 is successfully broken through, further targets will be 3350-3360 ⚡️
Short Position Strategy:
When the price rises to the 3360-3365 range, try opening a short position ⚠️ Set the stop-loss at 3370, with targets at 3340-3330 📉
Gold Trading Strategies
sell@3360-3365
tp:3330-3340
buy@3320-3325
tp:3350-3360
Professional trading strategies are pushed daily 📊
Lock in precise signals amid market fluctuations 🚀
Confused about market trends? Stuck in strategy bottlenecks?
Real-time strategies serve as your "trading compass" 🌐
From trend analysis to entry/exit points, dissect market logic comprehensively
Refer now 📲
Help you move steadily forward in investments ✨
👇👇👇
5/26 Gold Trading SignalsGood afternoon everyone!
I just returned from a weekend trip and apologize for the late update today — thank you all for your patience and continued support!
Gold has shown mild downward movement in a one-sided consolidation pattern today. This is a technical pullback after reaching a key resistance zone, reflecting selling pressure at higher levels. Today is Memorial Day in the U.S., which explains the low volatility and reduced trading volume.
🔎 Technical Outlook:
Once gold reached around 3360, it entered a significant resistance zone. If bulls intend to maintain the current uptrend, then the support around 3272 will be a critical level during this pullback. Before that, we should also keep an eye on 3322, 3318, and 3298.
On the 2-hour chart, a bearish divergence has formed, which needs to be resolved, possibly through sideways consolidation or a further pullback.
🗞 Fundamental Outlook:
The news is relatively quiet today, but important economic data and speeches will begin tomorrow, which may trigger larger market moves.
📈 Today’s Trading Plan:
📉 Sell in the 3352–3368 zone (resistance area)
📈 Buy in the 3292–3272 zone (support zone)
🔁 Flexible intraday levels to watch:
3348 / 3332 / 3323 / 3312 / 3305 / 3296
Stay flexible and manage risk accordingly. If you have any questions or want to discuss your trading strategy, feel free to reach out. Wishing everyone a smooth and profitable session!

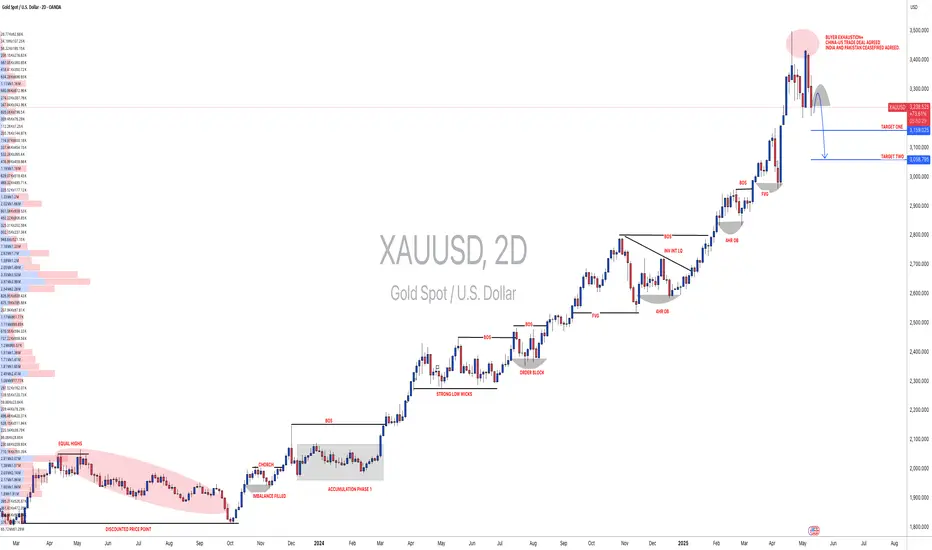
#XAUUSD: +2000 Pips Correction US-China Trade Deal ConfirmedGold has experienced a significant decline in recent days, primarily due to fundamental market factors that have caused its price to fall from 3430 to 3209, resulting in a loss of approximately 2210 pips. Consequently, we recommend that you consider selling Gold if it aligns with your analysis and assessment. It is imperative that you implement strict risk management measures while trading Gold.
It is important to note that this analysis does not guarantee a price decline or that the market will behave as described. Therefore, we strongly advise you to conduct thorough trade planning before making any trading decisions.
We extend our sincere gratitude for your unwavering support over the years.
Our primary objective is to assist you in making well-informed decisions. Therefore, we encourage you to contact us if you have any inquiries or require further information.
Additionally, we would be delighted to receive your insights on which cryptocurrency pair you would like to explore next. Please do not hesitate to share your preferences.
Best regards,
Team Setupsfx_
Gold prices remain strong as tariffs heat up again
Hey everyone, let's comment on the gold price next week from May 26, 2025 to May 30, 2025,
📌 Driving Events
Gold prices resumed their upward momentum on Friday, surging nearly 2% on the day and up more than 5% for the week as the dollar weakened amid renewed trade tensions. Gold prices rebounded from an intraday low of $3,287 to $3,359 as escalating rhetoric from Washington fueled investor demand for safe-haven assets.
U.S. President Donald Trump has intensified the trade standoff with the European Union, declaring that negotiations are "going nowhere" and threatening to impose a 50% tariff on EU imports from June 1. For months, Fed policymakers have made it clear that they want more clarity on the response from fiscal and trade policies and the economy before taking further action on interest rates. Over the past month, this cautious stance has prompted traders to withdraw their bets on a rate cut in the June meeting, and the market now expects the policy pause to continue until the July meeting. However, futures market positions show that the probability of a rate cut before the end of September is still slightly above 50%. This is essentially a bet that the situation will become clearer in the next four months: either slowing inflation paves the way for policy easing, or the economic deterioration forces the Fed to increase stimulus.
📊Comment Analysis
Tariff news has begun to heat up again, and the United States and the rest of the world have not yet reached a consensus on negotiations, and gold prices have benefited from this rise. The big time frame shows that the price is breaking out and continuing the upward trend
Technical:
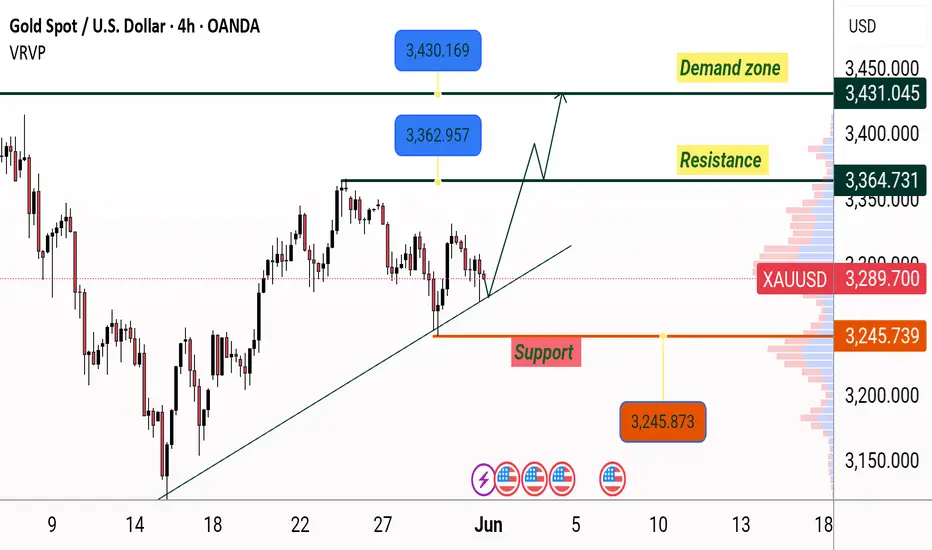
Based on the resistance and support levels of gold on the 4-hour chart, Labaron has identified the following important key areas:
Resistance: $3412, $3436
Support: $3315, $3280, $3245
⭐️ Note: Labaron hopes that traders can properly manage their funds
- Choose a lot size that matches your funds
- Profit is 4-7% of the capital account
- Stop loss is 1-3% of the capital account