XAU/USD Chart Analysis: Bulls Break Important ResistanceXAU/USD Chart Analysis: Bulls Break Important Resistance
When analysing the XAU/USD chart last week, we:
→ noted that the ADX indicator had reached its lowest level since the beginning of 2025 – a clear sign of declining gold price volatility;
→ highlighted the formation of a large-scale triangle with its axis around the $3,333 level, bounded by a resistance line (marked in red) and the lower boundary of the ascending channel.
Since then, the price has climbed above $3,400 – reaching its highest level since mid-June. According to media reports, the uptick in demand may be driven by escalating geopolitical risks, renewed optimism regarding potential monetary policy easing in the US, and consistent gold buying from central banks.
This suggests that the balance has shifted in favour of the bulls, who have made an attempt to break through the resistance line – an attempt that, so far, appears promising and points towards a potential resumption of the upward trend.
However, today's XAU/USD chart shows that the bulls are now facing a key resistance level at $3,440 – a level that has reversed gold prices downward both in May and June. What will happen in July?
It is possible that, following a prolonged consolidation near the lower boundary of the channel, the bulls have built up sufficient momentum to finally break through this critical level and push gold prices towards line Q, which divides the lower half of the long-term channel into two quarters.
This article represents the opinion of the Companies operating under the FXOpen brand only. It is not to be construed as an offer, solicitation, or recommendation with respect to products and services provided by the Companies operating under the FXOpen brand, nor is it to be considered financial advice.
Xauusdanalysis

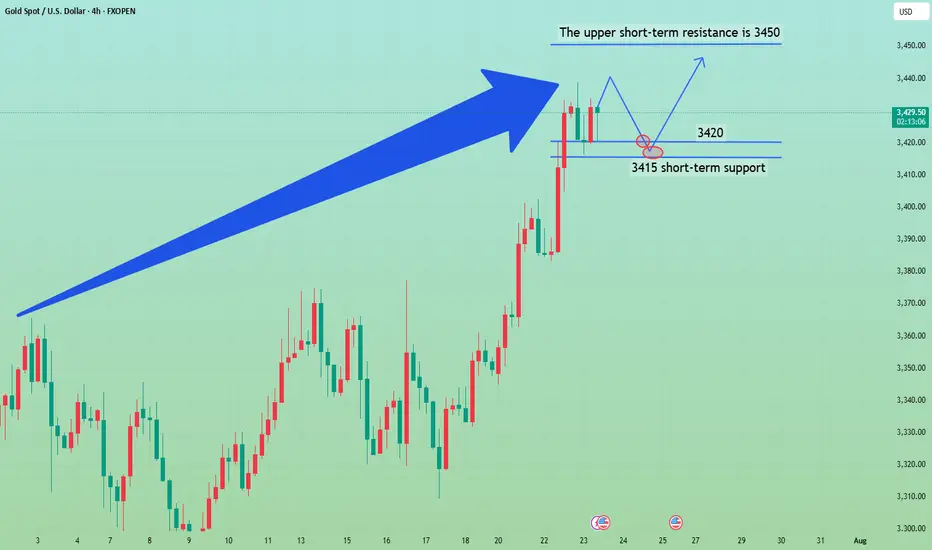
Seize the opportunity to go long when the price falls backFrom a technical analysis, the current bullish trend is clear and has continuity. In recent trading days, the market has shown the characteristics of "easy to fall but difficult to rise". Even if there is a correction, it is difficult to sustain. The price will rise quickly after a slight adjustment. Therefore, going long with the trend has become the core strategy, and any decline is an opportunity to arrange long orders. In terms of support, the daily level near 3400 constitutes a key support. If the price is close to this area, you can arrange long orders; the hourly level near 3420 also has a supporting role, which is suitable for entering the market to go long. For short-term operations, Mr. Weng suggested waiting for the price to rebound above 3450 before considering shorting in the short term. Judging from the current strong pattern, if 3450 is effectively broken, it is only a matter of time before it will rise to 3500. Therefore, it is not advisable to be overly bearish. Strict stop loss and trend trading are the prudent strategies.
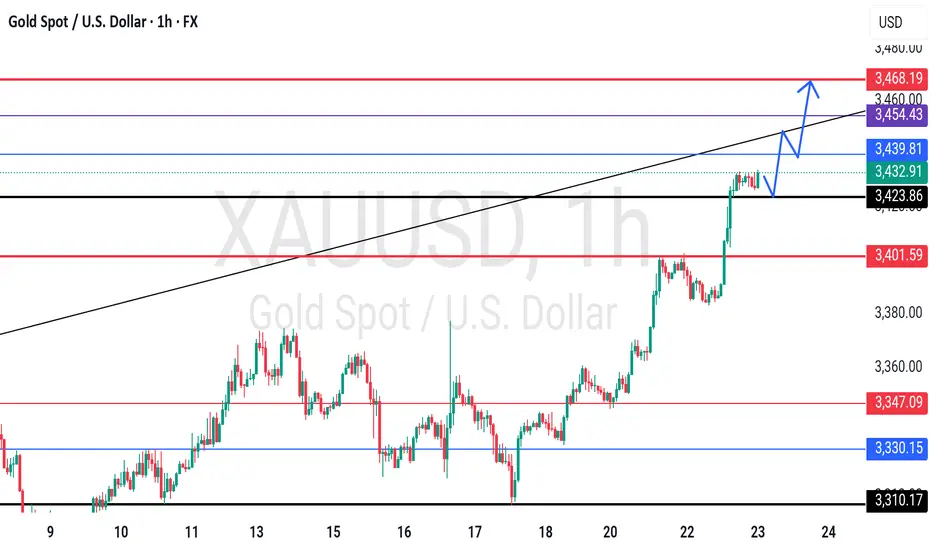
GOLD - single supporting area, further bounce??#GOLD - market perfectly moveed as per our video analysis and above our cut n reverse area as well.
Now market have single supporting area, tha tia around 3423-24
Keep close it and if market hold it then upside further bounce expected.
Good luck
Trade wisely
XAUUSD 30-Min Chart Analysis: Bullish Move Toward Resistance This 30-minute chart of XAUUSD (Gold vs. USD) shows key support and resistance levels. The price is currently around 3,422.615. Resistance is marked at 3,447.337, while the first and second support levels are at 3,412.474 and 3,404.985, respectively. The chart suggests a potential bullish move toward resistance.

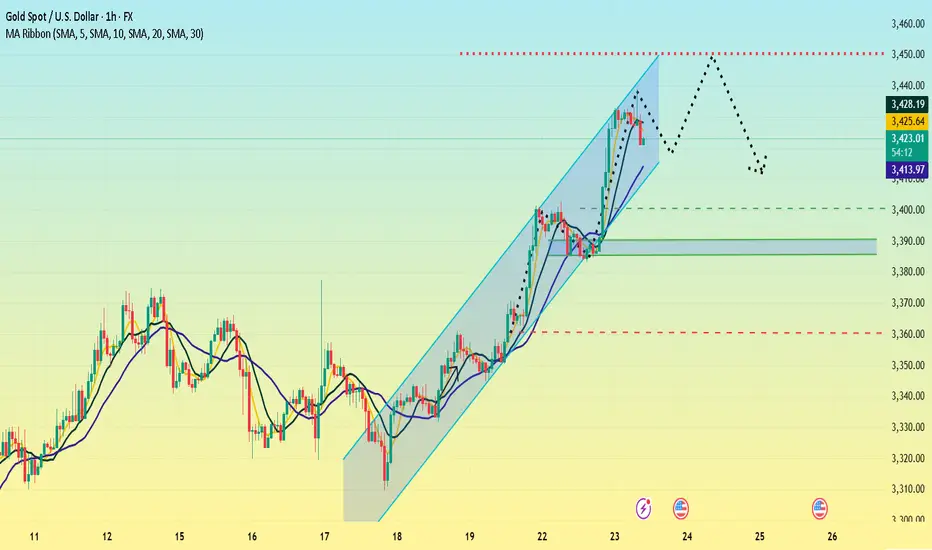
Bullish Channel in Play Key Trading Zones and Strategy for JulyOn the 1-hour chart, XAUUSD is clearly moving inside a well-defined ascending price channel, with price respecting both the channel boundaries and the midline as dynamic support/resistance. The pair continues to print higher highs and higher lows, confirming short-term bullish structure.
Trend Channel: Since July 18, gold has been steadily climbing within an ascending channel, bouncing off the lower boundary and riding above the midline.
EMA Support: The 10-period EMA (purple) has been acting as a dynamic support. Price has yet to close below it during this bullish swing.
Candle Behavior: Recent bullish candles with strong bodies show that buyers still have control, although price is stalling near the upper boundary of the channel.
Technical Level
3,459 USD. Major Resistance. Top of the channel – potential reversal or take-profit zone
3,423 USD.Immediate Support. EMA10 and current consolidation area
3,400 USD. Mid-Channel Support. Key pullback zone if price rejects near highs
3,360 – 3,365 USD. Major Support. Bottom of the ascending channel – break may invalidate bullish setup
Scenario 1 – Buy the Dip (trend continuation):
Wait for price to retest the 3,400 – 3,410 USD area or EMA10.
Look for bullish confirmation (e.g., pin bar, bullish engulfing).
Target: 3,445 – 3,459 USD
Stop loss: below 3,395 USD
Scenario 2 – Short at Channel Top (mean-reversion setup):
Monitor price behavior near 3,455 – 3,459 USD resistance.
If bearish reversal candles appear (e.g., shooting star, bearish engulfing), consider shorting.
Target: 3,420 – 3,410 USD
Stop loss: above 3,465 USD
As long as price remains inside the rising channel, buying pullbacks is the preferred strategy.
Stay alert to macroeconomic catalysts (Fed comments, PMI data, labor market releases) that could increase volatility.
Gold remains in a strong short-term uptrend on the 1H chart. Trading in the direction of the trend with proper risk management continues to offer the best opportunities for intraday traders.
If you found this analysis useful, don’t forget to follow for more trading strategies and ideas!

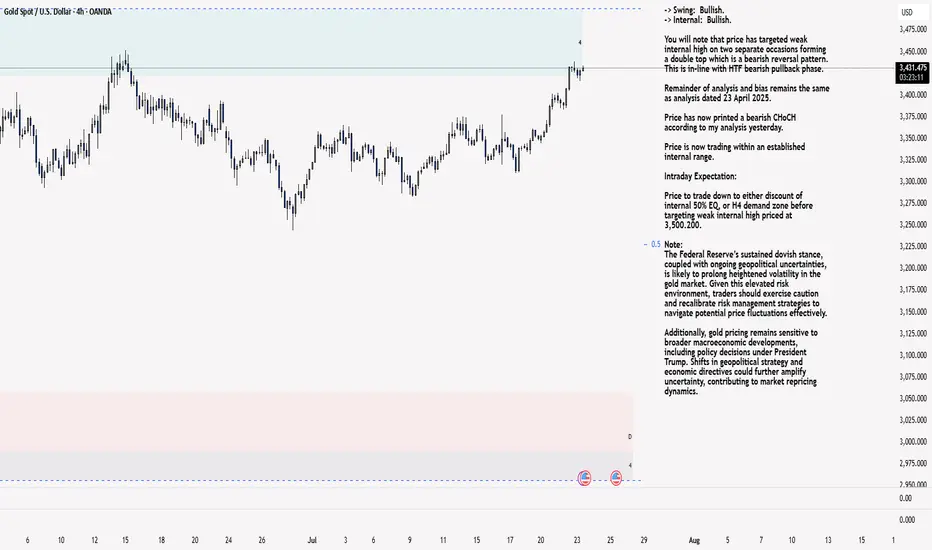
XAU/USD 23 July 2025 Intraday AnalysisH4 Analysis:
-> Swing: Bullish.
-> Internal: Bullish.
You will note that price has targeted weak internal high on two separate occasions forming a double top which is a bearish reversal pattern. This is in-line with HTF bearish pullback phase.
Remainder of analysis and bias remains the same as analysis dated 23 April 2025.
Price has now printed a bearish CHoCH according to my analysis yesterday.
Price is now trading within an established internal range.
Intraday Expectation:
Price to trade down to either discount of internal 50% EQ, or H4 demand zone before targeting weak internal high priced at 3,500.200.
Note:
The Federal Reserve’s sustained dovish stance, coupled with ongoing geopolitical uncertainties, is likely to prolong heightened volatility in the gold market. Given this elevated risk environment, traders should exercise caution and recalibrate risk management strategies to navigate potential price fluctuations effectively.
Additionally, gold pricing remains sensitive to broader macroeconomic developments, including policy decisions under President Trump. Shifts in geopolitical strategy and economic directives could further amplify uncertainty, contributing to market repricing dynamics.
H4 Chart:
M15 Analysis:
-> Swing: Bullish.
-> Internal: Bullish.
H4 Timeframe - Price has failed to target weak internal high, therefore, it would not be unrealistic if price printed a bearish iBOS.
The remainder of my analysis shall remain the same as analysis dated 13 June 2025, apart from target price.
As per my analysis dated 22 May 2025 whereby I mentioned price can be seen to be reacting at discount of 50% EQ on H4 timeframe, therefore, it is a viable alternative that price could potentially print a bullish iBOS on M15 timeframe despite internal structure being bearish.
Price has printed a bullish iBOS followed by a bearish CHoCH, which indicates, but does not confirm, bearish pullback phase initiation. I will however continue to monitor, with respect to depth of pullback.
Intraday Expectation:
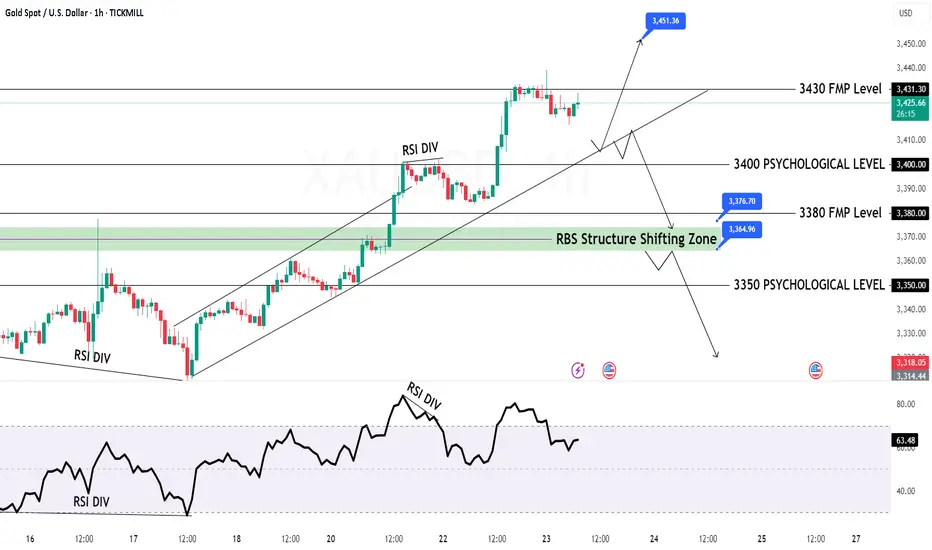
Price to continue bearish, react at either M15 supply zone, or discount of 50% internal EQ before targeting weak internal high priced at 3,451.375.
Note:
Gold remains highly volatile amid the Federal Reserve's continued dovish stance, persistent and escalating geopolitical uncertainties. Traders should implement robust risk management strategies and remain vigilant, as price swings may become more pronounced in this elevated volatility environment.
Additionally, President Trump’s recent tariff announcements are expected to further amplify market turbulence, potentially triggering sharp price fluctuations and whipsaws.
M15 Chart:
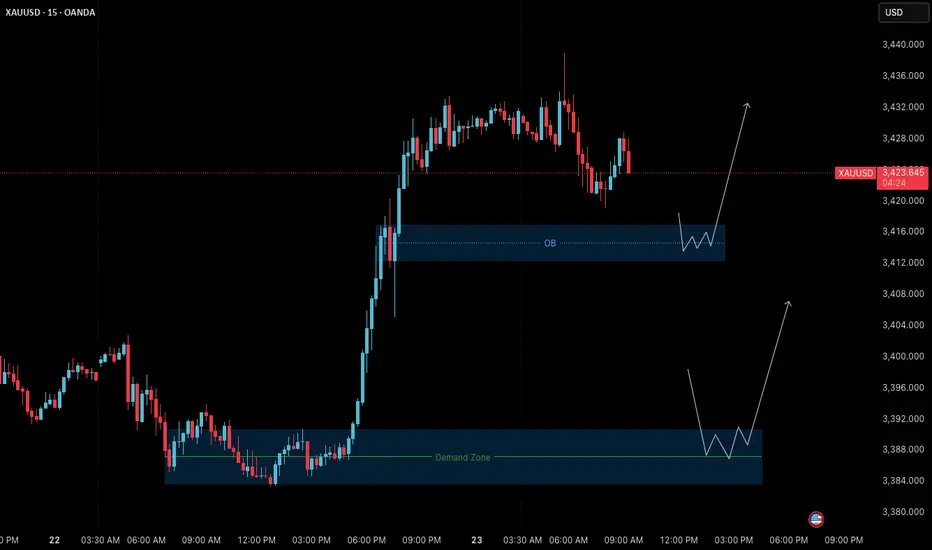
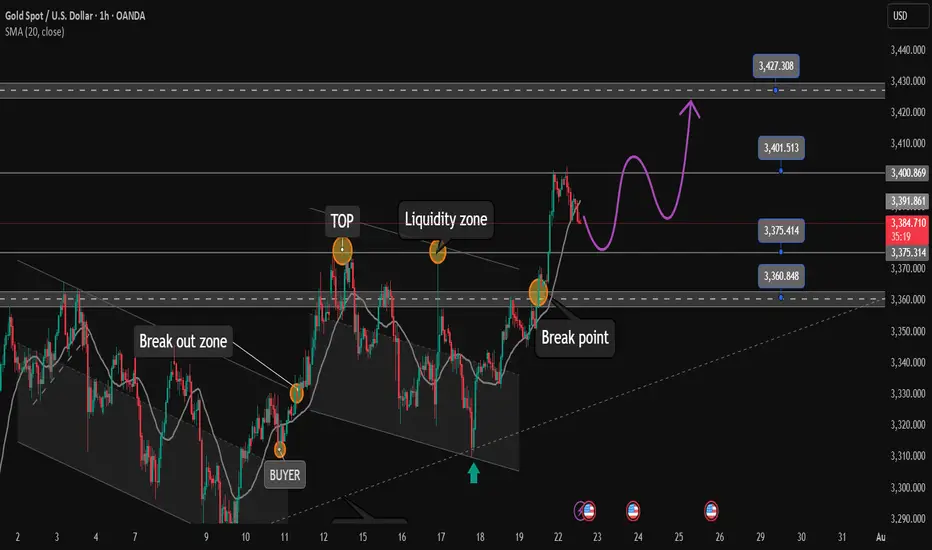
Gold Outlook (23 July): Bullish Structure Retesting Key ZonesGold (XAUUSD) – 23 July Analysis
Structure, patience, and precision define today's opportunity
The market remains in a clear uptrend , and the current M15 structure is undergoing a healthy pullback phase following yesterday’s strong bullish breakout. This retracement brings the price into key zones where continuation setups may form — if confirmed.
📊 Market Structure Overview
• Bullish Breakout: On July 22, price made a strong impulsive move upward from the demand base at 3384–3390 , confirming bullish strength and shifting short-term structure to the upside.
• Current Pullback: After printing a local high around 3439 , the market is retracing toward lower support zones. The pullback is expected and may offer long entries if price respects key areas and confirms.
🔑 Key Reversal Zones to Watch
1. Order Block (OB) Zone
Range: 3417 – 3412
– This zone is the origin of the last bullish impulse.
– Price is nearing this key zone.
– If M1 confirms with internal structure shift + BoS , we may have a valid long setup.
– Target: Previous high at 3438–3440
2. Deeper Demand Zone
Range: 3390 – 3384
– This is the base of the prior impulsive leg.
– If price breaks below the OB with momentum, this deeper zone may act as stronger support.
– Potential swing entry zone with better R:R
📌 Trade Scenarios for Today
🔹 Scenario 1: Rejection from OB Zone (Likely Intraday Setup)
– Wait for M1 to confirm via micro ChoCh + BoS inside 3417–3412 zone.
– If confirmed, plan for long entry with SL below zone.
– Target: 3438–3440
🔹 Scenario 2: Break Below OB → Retest at Deeper Demand Zone
– If OB zone fails, wait for price to drop into 3390–3384.
– Look for M1 confirmation before executing any long position.
– This setup may offer a higher-quality entry with improved R:R.
📈 Trade Plan:
– Wait for confirmation before entry (e.g., M1 structure shift + BoS)
– SL: 40 pips | TP: 120 pips
– Risk-Reward: Always 1:3 minimum
– No confirmation = No trade
🎯 Summary
• Primary Bias: Bullish — monitoring OB zone (3417–3412) for long setup
• Alternative Setup: Buy from 3390–3384 demand if deeper retracement unfolds
• Discipline: Let the market validate your plan. Never force a trade.
📘 Shared by @ChartIsMirror
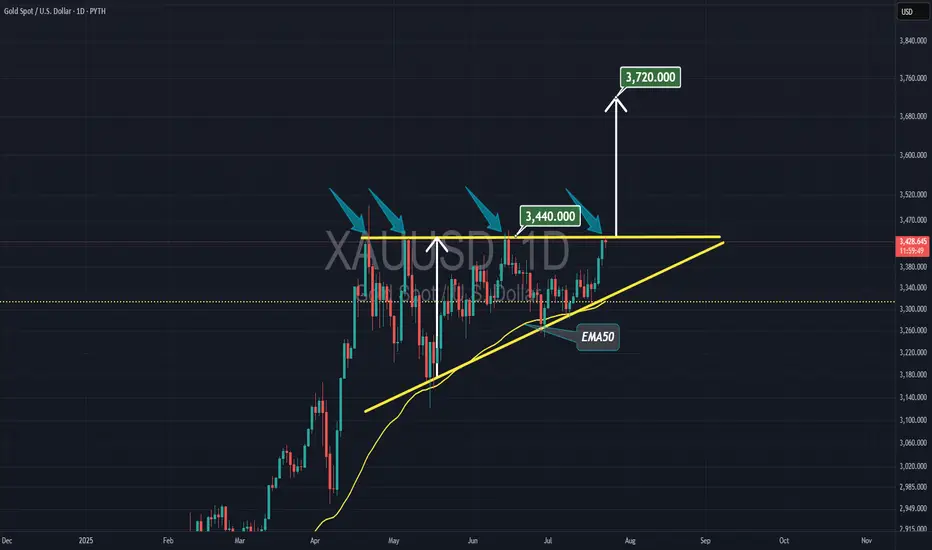
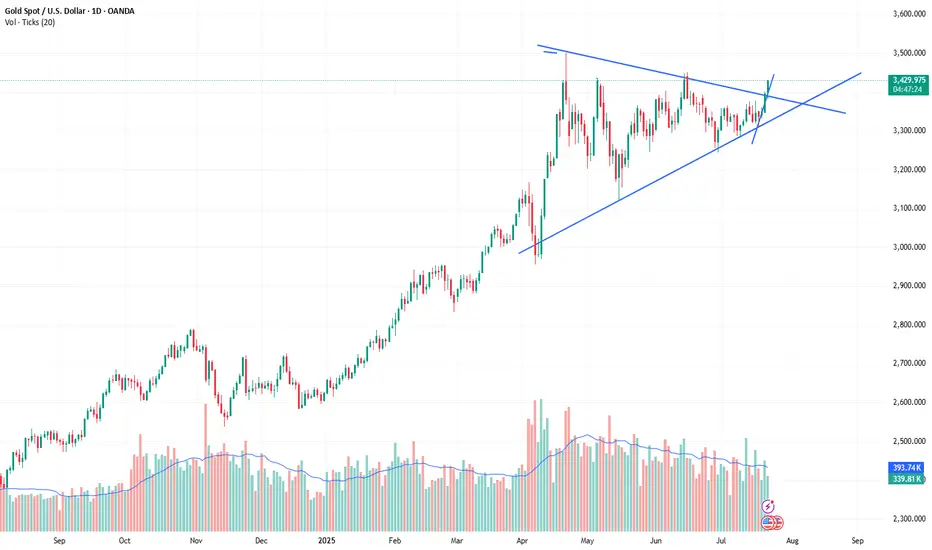
Gold to $3720Gold has been trading within an ascending triangle since late April, staying above the support line and the 50-day EMA. This is the fourth time Gold is testing the resistance line at $3440, and it will likely break soon. The breakout FOMO should push Gold to around $3720, IMO.
3400 has been reached, wait patiently for a pullback to go longGold opened on Monday with a volatile rise. After breaking through the 3360-65 area, the bulls turned strong. After breaking through the 3375~80 area in the evening, the bulls accelerated their rise, reaching the highest point of 3402. It fluctuated sideways in the late trading, and the daily line closed at around 3397 with a big positive line! Gold temporarily broke the small range oscillation pattern, but the bulls were not strong, and it still fluctuated upward.
From the perspective of the intraday cycle, after yesterday's rapid rise, the market fell into a serious overbought state; however, yesterday's $60 big positive line supported the bulls, and it is expected that the market will fluctuate; the next focus is still the 3400 mark area. The pressure in the 3400~05 area was dense last night, and adjustments may be made at any time before the breakthrough; and since the rise of 3282, it has just touched the upper edge of the parallel channel. The big sweep will continue, but the range is constantly changing!
So although gold broke the recent volatility yesterday and hit the 3400 mark with a big positive line; however, if it cannot stand above it, then it will continue to fall; recently we have repeatedly and many times emphasized the importance of the 3400 mark. If it stands here, the market will gradually rise to 3420~25 and break through to the 3450 area before looking for a decline.
Today we will continue to focus on the 3400 mark area. First, we will rush to the high altitude, with the goal of retracement to the 3375 and 3356 regional support platforms, and then pay attention to long opportunities; if the bulls stand above the 3400 mark, they will further bullishly impact 3420~25 and break through the 3450 area before falling back.
OANDA:XAUUSD
Gold bulls are on the offensive. Can they continue to chase?On Tuesday, as trade tensions and the conflict between the White House and the Federal Reserve continued, the US dollar index continued to fall, and continued to fall in the early US trading, once hitting a low of 97.28. Gold also continued to rise, once standing above the $3,430 mark, setting a new high in more than a month. From the current point of view of gold, this week has stood firm at two levels, 3,350 and 3,400. Next, it depends on whether it can continue to stand firm at the 3,450 level.
From the current hourly chart, Monday's high is around 3,400, and yesterday's low of the US market retracement on Tuesday was around 3,405. So theoretically, 3,400-3,405 has become a support position. And from the hourly chart range, the bottom trend line support is also about 3,400-3,405. Therefore, it is not ruled out that it will oscillate and retrace like yesterday, and then rise and stretch again.
Secondly, from the daily chart:
After gold stabilized at 3400, the current daily range has become 3400-3450. As we can see above, there have been three times of falling back after touching 3450. If it breaks and stabilizes above 3450 this time, the historical high of 3500 will most likely be refreshed. On the contrary, if it still cannot break through 3500 this time, the possibility of further pullback cannot be ruled out. For the next operation, I suggest paying attention to 3400-3405.
If it can retreat and stabilize at 3400-3405 during the European session, you can continue to enter the market and go long to around 3450. On the contrary, if it falls below 3400 today, then don't go long, as there may be a possibility of further retreat in the future.

XAU/USD Intraday Plan | Support & Resistance to WatchGold has continued its rally, breaking through the 3,416 resistance and pushing into the next upside zone.
Price is now trading around 3,421, just below the 3,440 resistance cluster.
The structure remains bullish with price holding firmly above both the 50MA and 200MA, which are acting as dynamic support.
A confirmed break and hold above 3,440 would open the path toward 3,458 and potentially the higher‑timeframe target at 3,478 if momentum extends.
If price fails to sustain above 3,416–3,440 and begins to fade, watch the initial pullback toward 3,400.
A deeper move below that would shift focus to 3,383 - 3,362 and then the Pullback Support Zone.
Failure to hold there could expose price to the lower Support Zone if bearish pressure builds.
📌 Key Levels to Watch
Resistance:
‣ 3,440
‣ 3,458
‣ 3,478
Support:
‣ 3,416
‣ 3,400
‣ 3,383
‣ 3,362
‣ 3,336
🔎 Fundamental Focus
⚠️Not much on the calendar today. Still, manage your risk and stay prepared for any unexpected volatility.

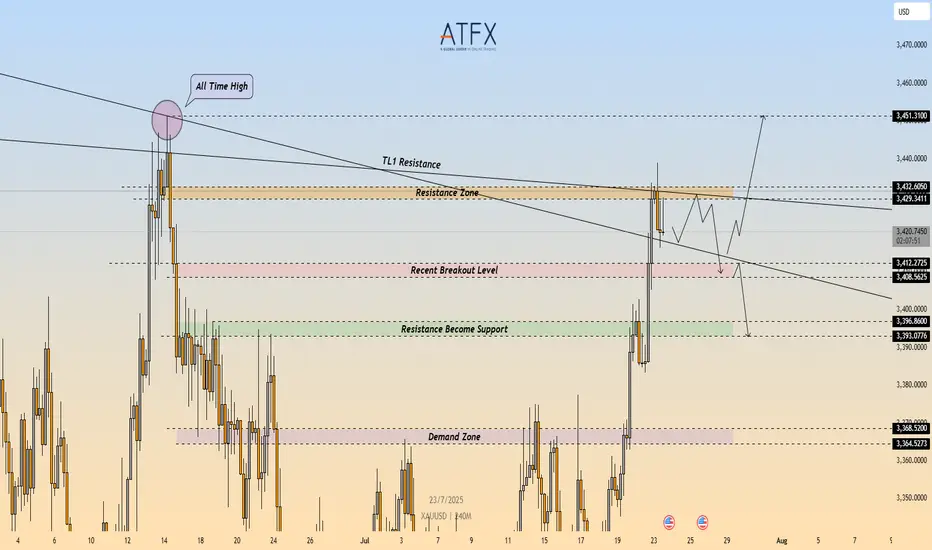
XAU/USD: Bearish Rejection at $3,432 – Short Setup in Play🔴 XAU/USD – Bearish Rejection at Key Resistance Zone ($3,432)
🔍 Technical Outlook
Gold (XAU/USD) failed to break through the $3,429–$3,432 resistance zone, which aligns with a descending trendline (TL1) and prior swing high. The rejection from this confluence zone is reinforcing bearish pressure, with price now carving out lower highs on the 4H timeframe.
A clean break below $3,412 would confirm bearish continuation and open the door toward the $3,400 area, followed by the demand zone at $3,368–$3,365.
🔻 Short Setup
Entry: 3,432
Stop Loss: 3,436
Take Profit 1: 3,412
Take Profit 2: 3,396
R\:R Ratio: ≈ 1 : 6.95
Invalidation: Close above 3,436
📌 Key Levels
Resistance: 3,429 – 3,432
Support 1: 3,412
Support 2: 3,368 – 3,365
Trendline: Long-term descending resistance acting as ceiling
📘 Summary
Gold remains capped beneath a critical resistance cluster. The rejection around $3,432 could trigger a deeper pullback toward $3,396, especially if sellers push price below $3,412. Bearish bias remains valid while price holds under the trendline.
📉 Bias: Bearish
📈 Confirmation Trigger: Break below $3,412
⚠️ Invalidation Level: Above $3,436
GOLD Intraday Chart Update for 23 July 25Hello Traders
First of all i hope you were enjoying yesterday move with 400 Pips Reward
For today we have 3400 Psychological remains in focus if market breaks below 3400 then it will move towards 3364-76 zone otherwise we are remain buyers above 3400 Level
Strong Resistance zone for intraday is at 3445-3465 if market cross 3465 the it will move towards ATH test which is around 3500
Disclaimer: Forex is Risky
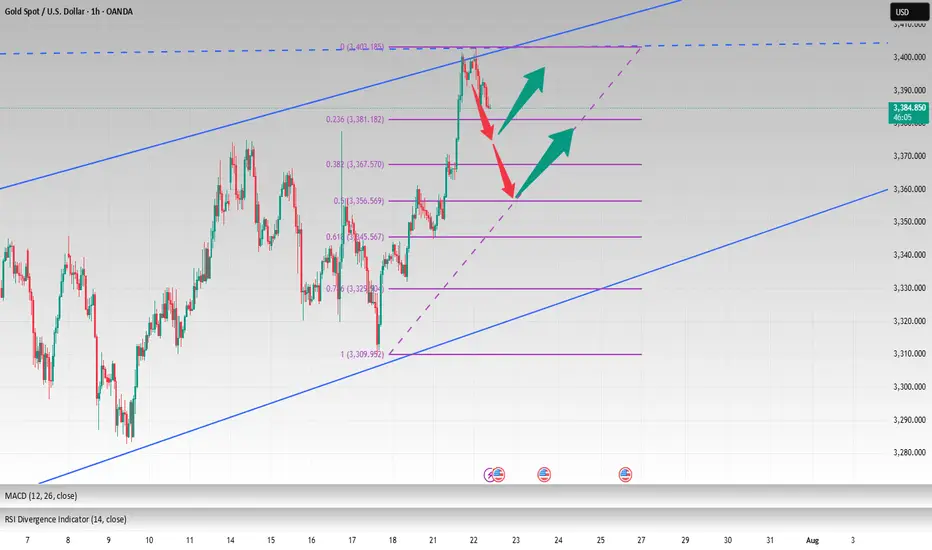
XAUUSD SEEMS TO ESTABLISH NEW BULLISH IMPULSEXAUUSD SEEMS TO ESTABLISH NEW BULLISH IMPULSE
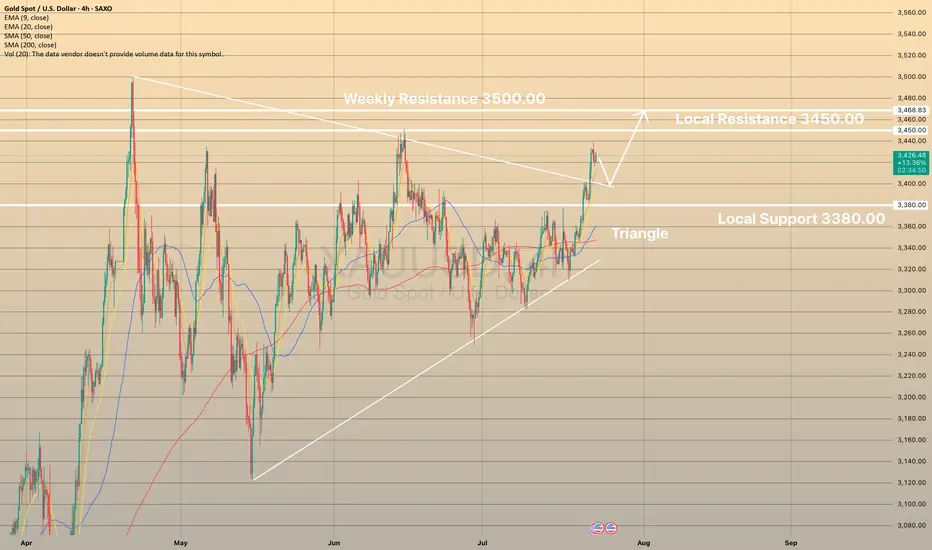
The recovery of the gold market appears to have gained momentum in recent days. This has resulted in the precious metal surpassing what appears to be a triangular pattern.
What is a triangle pattern?
A triangle pattern is a chart pattern with converging trendlines, signaling consolidation before a breakout. Types: Ascending (bullish, flat top, rising bottom), Descending (bearish, flat bottom, declining top), Symmetrical (neutral, both trendlines converge). To trade: Identify the pattern (two touches per trendline), wait for a breakout with volume, enter after confirmation, set stop loss below (long) or above (short) breakout, and target the triangle’s height projected from the breakout.
From here, a break above the June high of 3,450.00 would increase the probability of a further rise toward the record high near 3,500.00. But before that slight decline towards upper border of the symmetrical triangle with further rebound is expected.
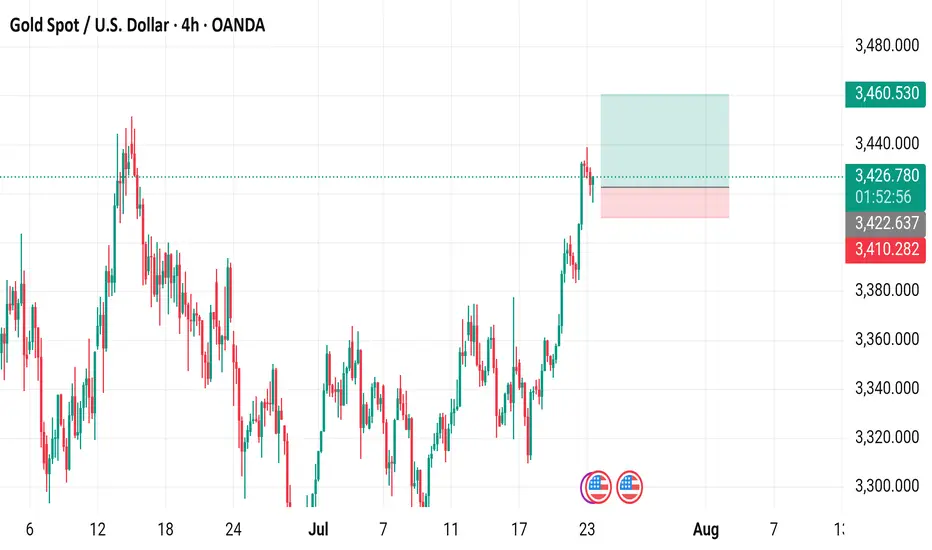
Gold Spot / U.S. Dollar (XAUUSD) - 4 Hour Chart (OANDA)4-hour chart from OANDA displays the price movement of Gold Spot (XAUUSD) from late July to early August 2025. The current price is 3,426.260, with a recent decrease of 5.185 (-0.15%). The chart shows a buy price of 3,426.580 and a sell price of 3,425.950, with a resistance level around 3,460.530 and support near 3,410.282. The data reflects trading activity as of 01:54:22 on July 23, 2025.
xauusd:3450-3500?Combined with the trend of the US dollar index, the probability of continuing to fall in the short term is high. Today, the manufacturing industry is significantly bullish for gold prices, which is expected. Powell's speech in an hour will be the key factor in today's New York market.
The pressure of interest rate cuts is imminent. Will Powell continue to insist on not cutting despite all objections? This is what we need to pay attention to. Make two plans. First, continue not to cut interest rates, the US dollar will be supported, and gold will retreat. If there is a retracement of 3400-3410 points, it needs to be paid attention to. Second, it is not discussed. Or interest rate cuts are beneficial to gold prices. This is the driving force for gold prices to hit 3500-3450.
To be honest, the conclusion of the Band Trading Center Research Institute tends to the latter. So if you buy, you need to set TP/SL strictly.
Gold is strong. Can it continue?On Tuesday, the overall gold price showed an upward trend. The highest price rose to 3433.32 on the day, and the lowest price fell to 3383.21, closing at 3431.46. On Tuesday, gold prices fluctuated during the early trading session and then corrected downward. During the European session, the price fluctuated mainly and fell weakly. It rose before the US session and hit the high point of the week again in the US session, and finally ended with a big positive line.
From the four-hour level, the technical adjustment needs, but the speculation of risk aversion suppressed this demand. There is a contradiction between the fundamentals and the technical aspects, and it is necessary to wait for the market sentiment to stabilize before clarifying the direction.
In the early Asian session, it hit a high of 3438 and then fell back. It is necessary to pay attention to the possibility of reaching the top. The support position is 3400-3405. If it falls to 3400, it may continue to adjust to around 3385. The probability of closing the negative line today is relatively high. If the price stabilizes above 3400, it is likely to maintain high fluctuations.
Today's market is complicated. Although the bullish trend has not changed, it is not advisable to be overly bullish. The operation is mainly shorting on rebounds, supplemented by long positions on pullbacks. The upper pressure position focuses on 3440-3450.
Operation strategy:
Short near 3440-3450, stop loss 3460, profit range 3420-3410.
Long near 3390, stop loss 3380, profit range 3420-3430.

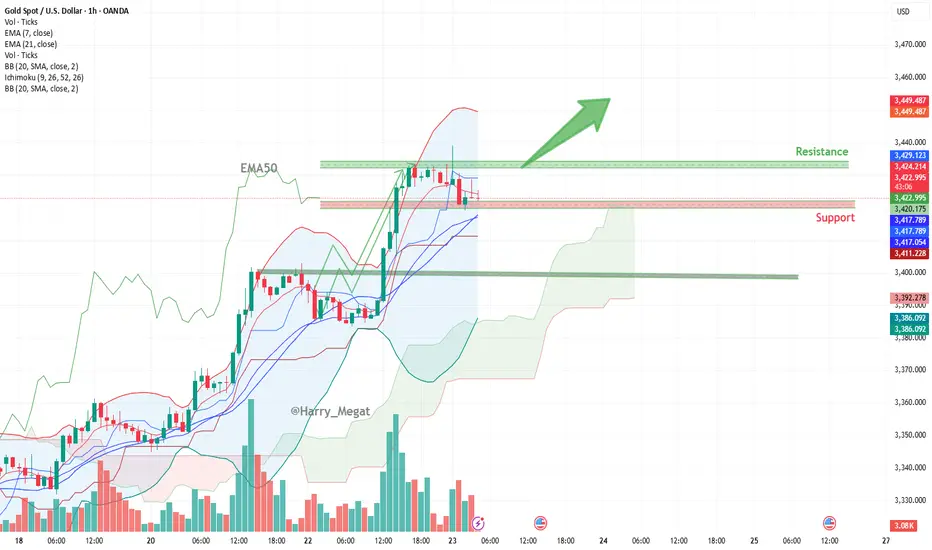
Gold Spot (XAU/USD) Chart analysis Gold Spot (XAU/USD) Chart analysis
**Chart Overview**
* **Current Price:** \~\$3,423.68
* **Recent Trend:** Bullish (Strong upward movement before recent consolidation)
* **Timeframe:** 1-hour chart
* **Indicators Used:**
* EMA 7 (Blue)
* EMA 21 (Purple)
* Bollinger Bands (Red/Green lines)
* Volume bars at bottom
**Bullish Momentum Signals**
1. **Strong Uptrend**:
* Price surged rapidly above \$3,400, breaking multiple resistance levels.
* Higher highs and higher lows confirm bullish structure.
2. **EMA Crossover**:
* The shorter-term EMA (7) is above the longer-term EMA (21), signaling a bullish bias.
* Price is currently near the EMAs, suggesting a possible retest of dynamic support.
3. **Bollinger Bands**:
* The price touched the **upper band**, indicating strong momentum.
* Bands are widening — a sign of increased volatility and continuation potential.
**Support and Resistance Zones**
* **Resistance Zone**: \~\$3,430–\$3,435
* Price was rejected here multiple times, indicating strong selling pressure.
* A breakout above this could send price toward the next level at \~\$3,450.
* **Support Zone**:
* Minor: \~\$3,417–\$3,418 (aligned with EMAs and lower Bollinger Band)
* Major: \~\$3,400 zone (previous breakout area and volume support)
**Bullish Setup**
* The **green arrow** suggests a bullish breakout is anticipated above \$3,430.
* If price holds above \$3,417 (EMA + BB support), the bulls could push it to **\$3,445–\$3,450** short-term.
**Risk**
* A break below \$3,417 and especially below \$3,400 could invalidate the bullish scenario and invite a correction.
* Watch for volume confirmation on any breakout to confirm strength.
**Conclusion**
Gold is in a **consolidation phase** after a strong rally. If support around \$3,417–\$3,418 holds, a breakout above \$3,430 could trigger a move to **\$3,445–\$3,450**. However, a break below EMAs would shift momentum back to neutral or bearish.
Gold (XAU/USD) 4‑Hour Technical Analysis: July 23, 2025Gold continues to trade in a bullish structure on the 4‑hour timeframe, holding above $3,420 after a steady advance from early July lows. At the time of writing, XAU/USD stands at $3,423.8, confirmed by Investing.com. This analysis employs a comprehensive blend of globally‑recognized technical tools — ranging from price action and classical indicators to institutional concepts — to identify the most probable trading zones and a high‑conviction setup.
Current Price Structure and Trend
On the 4‑hour chart, gold maintains a clear bullish market structure, consistently printing higher highs and higher lows since early July. The current price action unfolds within a well‑defined rising channel, bounded approximately between $3,400 on the lower side and $3,450 on the upper. Twice in the past week, price has tested and respected the channel’s lower boundary, confirming its validity.
Support and resistance levels are evident: immediate support lies at $3,410, coinciding with the 50% Fibonacci retracement of the July impulse wave. Below that, $3,390–$3,395 offers secondary support at the channel’s base and a longer‑term Fibonacci cluster. Resistance is concentrated at $3,445–$3,450, aligning with the channel top, upper Bollinger Band, and prior swing highs, while a secondary ceiling may emerge near $3,468–$3,470, corresponding to an Elliott Wave 3 extension target.
Candlestick, Volume, and Momentum
Recent price action has been supported by bullish candlestick formations. Notably, a strong bullish engulfing bar formed at $3,410 earlier this week, affirming institutional demand at that level. Volume profile analysis shows the heaviest transaction cluster between $3,410–$3,420, confirming this area as a smart money accumulation zone.
Volume‑weighted average price (VWAP ) currently runs near $3,418, with price holding above it, reflecting institutional positioning in favor of the bulls. Momentum indicators support the trend: MACD on the 4‑hour has just crossed bullish, RSI prints at 60 — strong but not overbought — and ADX climbs to 24, indicating a trend strengthening phase.
Indicators, Patterns, and Institutional Concepts
Trend indicators reinforce the bullish view. The 50‑ and 100‑period exponential moving averages converge around $3,415–$3,420, providing dynamic support. Ichimoku analysis shows price well above the Kumo (cloud), with a bullish Tenkan‑Kijun configuration. Bollinger Bands are widening, and price is leaning toward the upper band — a classic signal of volatility expansion in trend direction.
Classical and harmonic patterns offer further evidence. The current consolidation resembles a bull flag, suggesting continuation. Elliott Wave analysis points to a third wave in progress, with an upside projection into the $3,448–$3,468 area. Smart money concepts confirm that the recent break above $3,420 constituted a bullish break of structure (BOS), with price now retracing into a favorable gap (FVG) and a 4‑hour bullish order block anchored around $3,410–$3,415.
Liquidity and stop‑clusters likely sit above $3,445 and $3,468, making these logical targets for bullish campaigns.
Market Context and Sentiment
Gold is benefiting from a softening US dollar and a drop in volatility indexes. Seasonal tendencies also lean bullish into late summer. Sentiment on professional platforms aligns with this view: TradingView top authors and FXStreet analysts favor buying pullbacks into $3,410–$3,415 and targeting $3,450–$3,468, which harmonizes with this analysis. No major divergence from consensus is noted, adding to confidence.
Identified Trading Zones
Two strong buy zones emerge on the 4‑hour chart. The most immediate and highest‑confidence zone is $3,410–$3,415, supported by channel support, Fibonacci retracement, VWAP, moving averages, and an order block. Below this lies a secondary buy zone at $3,390–$3,395, tied to deeper Fibonacci support and the rising channel’s lower boundary.
On the other hand, clear sell zones are defined at $3,445–$3,450, where upper channel resistance, Bollinger bands, and prior highs converge, and a secondary zone at $3,468–$3,470, aligned with wave targets and round‑number psychological resistance. These areas are likely to attract profit‑taking and potential reversals.
The Golden Setup
Among the findings, one trade stands out as the highest‑conviction setup:
A long position at $3,415, with a stop loss at $3,405 and a take profit at $3,450.
This trade is backed by strong confluence: price pulling back into a well‑defined demand zone ($3,410–$3,415) that features order block support, Fibonacci retracement, VWAP alignment, EMA cluster support, and a rising channel boundary. The target sits just below the first significant resistance band ($3,445–$3,450), offering a favorable risk‑to‑reward ratio. The confidence level on this setup is rated at 8/10, given the multi‑method alignment and consistent sentiment from professional sources.
Summary Table
Category Levels / Details
Buy Zones $3,410–$3,415, $3,390–$3,395
Sell Zones $3,445–$3,450, $3,468–$3,470
Golden Setup Long @ $3,415 / SL $3,405 / TP $3,450 (Confidence: 8/10)
In conclusion, gold maintains a constructive technical outlook on the 4‑hour timeframe. The prevailing bullish structure, reinforced by classical and institutional methodologies, supports a continuation toward the $3,450–$3,468 region. The suggested Golden Setup provides a disciplined, high‑probability entry at a key inflection zone, consistent with both technical evidence and prevailing market sentiment.

After reaching FULL TP. Relax and wait for strong support zone✏️Continuing yesterday's bullish wave structure, Gold has reached the Target level of 3400. In the European session, there is a possibility of a correction to some important support zones. And the US session will continue to aim for a level higher than 3400. Today's strategy is still quite similar to yesterday's strategy when waiting for the areas where buyers confirm to enter the market to FOMO according to the main trend.
📉 Key Levels
Support: 3375 - 3363
Resistance: 3400-3427
Buy Trigger: Rejects the support zone 3375 and reacts to the upside
Buy Trigger: Rebound from 3363
BUY DCA: Break and trading above 3400
Target 3427
Leave your comments on the idea. I am happy to read your views.
Price channel break. Will the downtrend take place?✏️USDCAD broke the price channel and started forming a bearish wave. The resistance zone of 1.370 played an important role in starting the bearish wave. 1.365 is the immediate support zone that the pair faces. If it wants to extend the decline, it needs to close the h1 candle below this price zone. The convergence between the trendline and the resistance of the Asian session will be a reliable support point for a downtrend to take place.
📉 Key Levels
Support: 1.365-1.356
Resistance: 1.370
SELL Trigger: Rejects bellow 1.370
SELL DCA Trigger: Break support 1.365
Target 1.356
BUY Trigger: Break and trading above resistance 1.370
Leave your comments on the idea. I am happy to read your views.

Gold stabilizes. Sets a new high?Gold continues to rise, with uncertainty in trade negotiations and the outcome of the Federal Reserve meeting being key variables. If no agreement is reached before August 1, the high tariffs imposed by the United States on major trading partners may trigger greater risk aversion demand, pushing gold prices further up; if the negotiations make a breakthrough, the market risk appetite will rebound, and gold prices may face correction pressure.
Gold has shown a strong upward trend recently. It closed with a small positive on Friday last week and closed with positive for two consecutive trading days this week, forming a three-day positive trend, with strong short-term momentum. In terms of indicators, the moving average diverges upward, with obvious bullish trend characteristics, and the support below needs to focus on the moving average performance. At present, the gold price has broken through the trend line formed by connecting the previous high points. The primary focus on the upside is near the previous high of 3452, which is an important short-term resistance level. The upper focus is on the previous high of 3452, which is an important short-term resistance level.
The first support below is the 3390-3385 area, which is close to yesterday's low and is also an early trading intensive area. The second support focuses on the vicinity of 3360.
In terms of operation, it is still mainly low-long, and short selling is not considered before the upward trend reaches 3450.
Operation strategy:
Short around 3450, stop loss 3460, profit range 3430-3310
Long around 3400, stop loss 3390, profit range 3420-3430
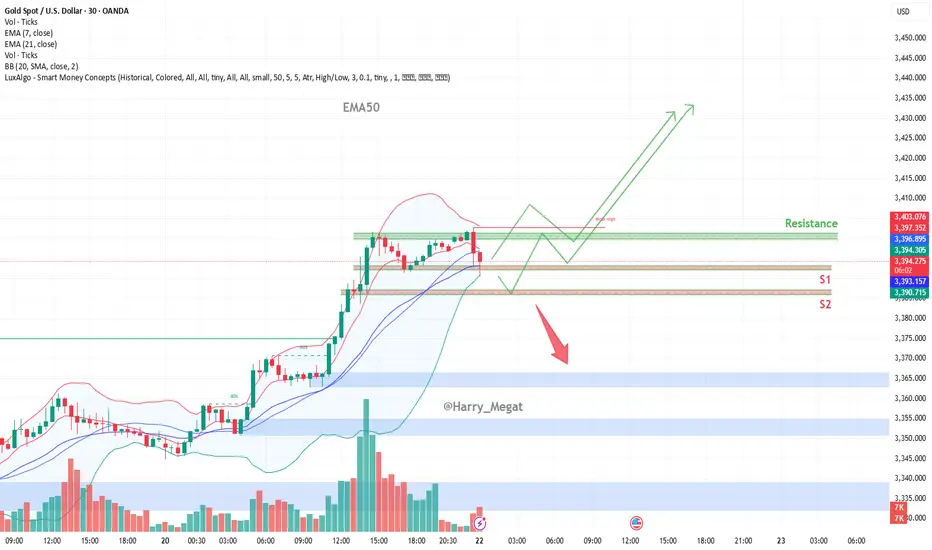
XAU/USD (Gold vs. USD) chart structureXAU/USD (Gold vs. USD) chart structure
**Chart Overview**
* **Current Price:** \~\$3,393
* **Indicators Used:**
* EMA 7, EMA 21 (short-term momentum)
* Bollinger Bands (20 SMA, 2 Std Dev)
* **Support Zones:**
* **S1:** \~\$3,392 – recent demand zone and confluence with EMAs
* **S2:** \~\$3,380 – deeper demand zone below
* **Resistance Zone:** \~\$3,403 – recent swing high and upper Bollinger Band
**Structure & Price Action Analysis**
**Bullish Impulse**
* A strong uptrend is visible prior to the current retracement, with consecutive higher highs and higher lows.
* Volume surged during the breakout around July 21, confirming strong bullish participation.
**Current Pullback**
* Price has rejected the **\$3,403 resistance**, causing a drop back to the **S1 demand zone**.
* This pullback is landing near the **EMA21 and lower Bollinger Band**, where buying interest may reappear.
**Possible Scenarios**
1. **Bullish Scenario (Green Path):**
* Price holds **above \$3,390–\$3,392 (S1)** support zone.
* Forms a **higher low** and reattempts a move toward **\$3,403** and potentially **\$3,420–\$3,435**.
* Confirmation: Bullish engulfing or reversal candles with volume near S1.
2. **Bearish Scenario (Red Arrow Path):**
* Price breaks below **S1 and EMA21**, losing bullish momentum.
* Next support is **S2 near \$3,380**, and if broken, it opens downside toward **\$3,365–\$3,350** zones
**Technical Confluence**
* **EMA Support:** EMA21 and EMA7 are still bullish-aligned but price is now testing them.
* **Bollinger Bands:** The price touched the upper band and is now mean-reverting. If it finds support at the midline or lower band, the bullish trend can continue.
* **Volume:** Volume spike during the breakout; recent drop is on lower volume, suggesting it may be just a pullback.
**Conclusion**
The structure remains bullish **as long as price stays above \$3,390/S1**. A bounce here could lead to continuation toward \$3,420+. However, **a break below \$3,390** may shift the structure toward bearish correction, targeting \$3,380 or lower.