XAUUSD: Mid-Term Analysis🪙 XAUUSD Analysis
You don’t need to guess. You can join from the blue box or the movement I’ve drawn on the chart.
📈 Context (The Story)
Treasury yields just fell for the 5th session, boosting the bullish case for XAUUSD as investors look for safety and positioning ahead of next week’s Fed meeting.
🚦 The Plan
✅ If price returns to the blue box, I will look for:
Footprint absorption (buyers defending the level)
CDV support or divergence
Structure reclaim to confirm entry
✅ If momentum continues along the drawn movement, I will join with risk-managed entries on clear reclaim setups.
⚡ Why It Matters
“People don’t like to be sold, but they love to buy.” – Jeffrey Gitomer
Today’s bullish backdrop is clear, but you only benefit if you enter with clarity, not FOMO.
🎯 Action Point
No predictions. No chasing. Let the setup align with:
Today’s bullish news as a backdrop
Technical confirmation in the blue box or reclaim areas
If it aligns, execute decisively with clear risk. If not, let it go.
The market rewards those who wait for the right price and the right moment. This may be that moment if the setup confirms.
📌I keep my charts clean and simple because I believe clarity leads to better decisions.
📌My approach is built on years of experience and a solid track record. I don’t claim to know it all but I’m confident in my ability to spot high-probability setups.
📌If you would like to learn how to use the heatmap, cumulative volume delta and volume footprint techniques that I use below to determine very accurate demand regions, you can send me a private message. I help anyone who wants it completely free of charge.
🔑I have a long list of my proven technique below:
🎯 ZENUSDT.P: Patience & Profitability | %230 Reaction from the Sniper Entry
🐶 DOGEUSDT.P: Next Move
🎨 RENDERUSDT.P: Opportunity of the Month
💎 ETHUSDT.P: Where to Retrace
🟢 BNBUSDT.P: Potential Surge
📊 BTC Dominance: Reaction Zone
🌊 WAVESUSDT.P: Demand Zone Potential
🟣 UNIUSDT.P: Long-Term Trade
🔵 XRPUSDT.P: Entry Zones
🔗 LINKUSDT.P: Follow The River
📈 BTCUSDT.P: Two Key Demand Zones
🟩 POLUSDT: Bullish Momentum
🌟 PENDLEUSDT.P: Where Opportunity Meets Precision
🔥 BTCUSDT.P: Liquidation of Highly Leveraged Longs
🌊 SOLUSDT.P: SOL's Dip - Your Opportunity
🐸 1000PEPEUSDT.P: Prime Bounce Zone Unlocked
🚀 ETHUSDT.P: Set to Explode - Don't Miss This Game Changer
🤖 IQUSDT: Smart Plan
⚡️ PONDUSDT: A Trade Not Taken Is Better Than a Losing One
💼 STMXUSDT: 2 Buying Areas
🐢 TURBOUSDT: Buy Zones and Buyer Presence
🌍 ICPUSDT.P: Massive Upside Potential | Check the Trade Update For Seeing Results
🟠 IDEXUSDT: Spot Buy Area | %26 Profit if You Trade with MSB
📌 USUALUSDT: Buyers Are Active + %70 Profit in Total
🌟 FORTHUSDT: Sniper Entry +%26 Reaction
🐳 QKCUSDT: Sniper Entry +%57 Reaction
📊 BTC.D: Retest of Key Area Highly Likely
📊 XNOUSDT %80 Reaction with a Simple Blue Box!
📊 BELUSDT Amazing %120 Reaction!
📊 Simple Red Box, Extraordinary Results
📊 TIAUSDT | Still No Buyers—Maintaining a Bearish Outlook
📊 OGNUSDT | One of Today’s Highest Volume Gainers – +32.44%
📊 TRXUSDT - I Do My Thing Again
📊 FLOKIUSDT - +%100 From Blue Box!
📊 SFP/USDT - Perfect Entry %80 Profit!
📊 AAVEUSDT - WE DID IT AGAIN!
I stopped adding to the list because it's kinda tiring to add 5-10 charts in every move but you can check my profile and see that it goes on..
Xauusdanalysis

Completion of rising wedge Gold is currently still holding rising channel along with the swing moves we were on buy at 3410 and my optimal target was 3425-3430 which is achieved now I'm expecting the reversal move!!
What's possible scanarios we have?
▪️I'm looking for sell opportunity from 3430-3435 area by following our structural strategy, also we have previous moves on Rising channel, market always respect its prevoius BOS and my Selling trade target will be 3405 then 3395 in extension.
▪️if H4 candle closing above 3435-3438 this Parallel moves will be invalid.

GOLD: Price Made A New HHLooking to buy gold, market structure is bullish on the H1 and H4. I went over 2 different scenarios in the video...
1. Pullback Entry (Preferred)
🟢Entry Zone: 3365–3380
TP1: 3432
TP2: 3450
TP3: 3475–3500 (extended target if momentum holds)
2. Breakout Buy (Aggressive)
Trigger: M15 breaks and closes above 3405–3410 with strong displacement.
Entry: Retest of breakout zone at 3402–3405
Same Targets
Don't forget to set those price alerts!

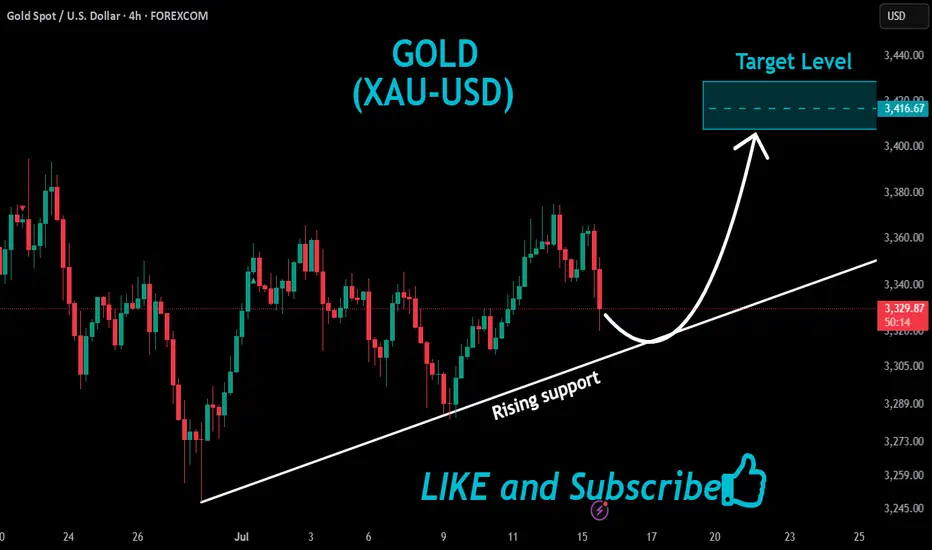
GOLD Will Keep Growing!
HI,Traders !
#GOLD keep trading in
An uptrend along the rising support
So as the pair is approaching
A the support we will be
Expecting a bullish rebound !
Comment and subscribe to help us grow !
XAUUSD (Gold) Buy Setup✅ Entry: As marked on chart
🎯 Take Profit 1 (TP1): Highlighted on chart
🎯 Take Profit 2 (TP2): Highlighted on chart
🎯 Take Profit 3 (TP3): Highlighted on chart
🛑 Stop Loss (SL): Defined below recent swing low
📊 Technical Insight (Dow Theory):
Gold is currently in a primary uptrend, confirmed by a series of higher highs and higher lows on the daily chart.
Recent price action shows a secondary retracement that has respected the previous swing low, maintaining structural integrity.
A bullish reversal has emerged at a key demand zone, signaling potential continuation of the primary trend.
Momentum indicators align with the trend, and volume analysis suggests accumulation, supporting bullish bias.
📍 As long as price remains above the stop loss level, we anticipate a drive towards TP1 and potentially TP2, TP3 as the next leg of the uptrend unfolds.
🚨 Conservative traders may wait for a confirmed breakout above the last minor high for further validation.

XAUUSD Breakout Structure | Smart Money Bullish Roadmap 🚨 XAUUSD 2H | Smart Money Concept Setup
Price perfectly tapped into demand zone and showed a strong bullish reaction — now forming a clear BOS (Break of Structure).
📍 Key Liquidity Zones:
• Price swept previous lows and is now targeting major liquidity levels marked as “Target Points.”
• Bullish momentum is expected to push price towards 3410 – 3425 range 📈
🔁 Expect possible consolidation before a continuation to upper targets.
💡 Strategy:
Wait for a minor pullback near the 3380–3390 level for confirmation, then ride the momentum to higher targets.
🎯 Target Levels:
1. 3398 ✅
2. 3410 🚀
3. 3425+ (Final Target)
📌 Like, Follow & Save if you caught this early 📊
#XAUUSD #SMC #LiquidityGrab #GoldSetup #TradingViewIdea #SmartMoney #Breakout

Bulls are still the main theme, 3400 is not the high point📰 News information:
1. Fed Chairman Powell delivers a welcome speech at a regulatory conference
2. The tariff deadline is approaching
📈 Technical Analysis:
Today's opening high reached around 3402, and did not effectively break through the upper resistance of 3405-3415. As I said yesterday, a decline and return to the moving average is an inevitable result. The tariff issue is still there, with the deadline on August 1, and the daily MACD indicator still shows a golden cross. The general direction of short-term bullishness has not changed, but from a technical point of view, gold still has room to fall to correct the overbought part.
Below the day, we first focus on the top and bottom conversion position of 3377-3375. As time goes by, the 4H middle track will probably resonate with the 50% position of the Fibonacci line at 3355, which is also a good long position I expect. Therefore, if the price falls back to 3380-3375 for the first time during the day, you can consider going long. If the price continues to fall, pay attention to the second opportunity to go long at 3355, with the target at 3390-3410.
🎯 Trading Points:
BUY 3380-3375
TP 3390-3410
BUY 3360-3350
TP 3370-3380
In addition to investment, life also includes poetry, distant places, and Allen. Facing the market is actually facing yourself, correcting your shortcomings, facing your mistakes, and exercising strict self-discipline. I share free trading strategies and analysis ideas every day for reference by brothers. I hope my analysis can help you.
TVC:GOLD PEPPERSTONE:XAUUSD FOREXCOM:XAUUSD FX:XAUUSD OANDA:XAUUSD FXOPEN:XAUUSD
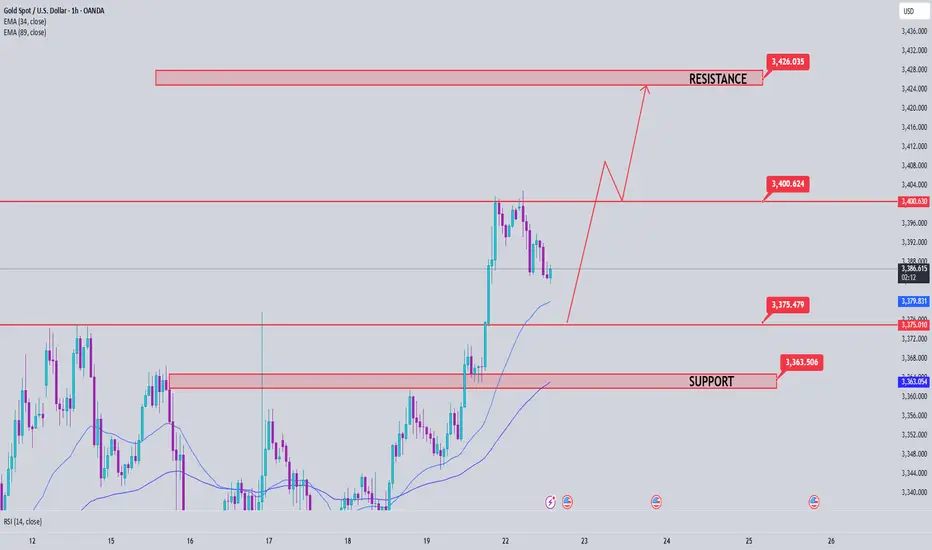
Gold Price Analysis July 22Gold continues to maintain its upward momentum as expected, and yesterday's session reached the target of 3400. This is a signal that the bullish wave structure is still holding. In today's European trading session, the price is likely to make a technical correction to important support zones before continuing the main trend in the US session.
The current trading strategy still prioritizes following the uptrend, focusing on observing price reactions at support zones to find safe entry points. Waiting for buyers to confirm participation is a key factor to avoid FOMO at the wrong time.
🔑 Key Levels
Support: 3375 – 3363
Resistance: 3400 – 3427
✅ Trading Strategy
Buy Trigger #1: Price reacts positively and rejects the support zone at 3375
Buy Trigger #2: Price rebounds strongly from the deeper support zone at 3363
Buy DCA (Moving Average): When price breaks and holds above 3400
🎯 Next Target: 3427
📌 Note: It is necessary to closely monitor price reaction at support zones to determine whether buying power is strong enough. If there is no clear confirmation signal, it is better to stay on the sidelines and observe instead of FOMOing to place orders.
Gold Breaking Previous Highs — Bullish Trend ContinuesHello everybody!
Price is continuing its bullish trend and has broken some significant resistance.
According to the market structure, we’re looking for it to go higher, up to the 3430 area.
The break of the downward trendline is a confirmation for a buy position.
Manage your risk and trade safe!
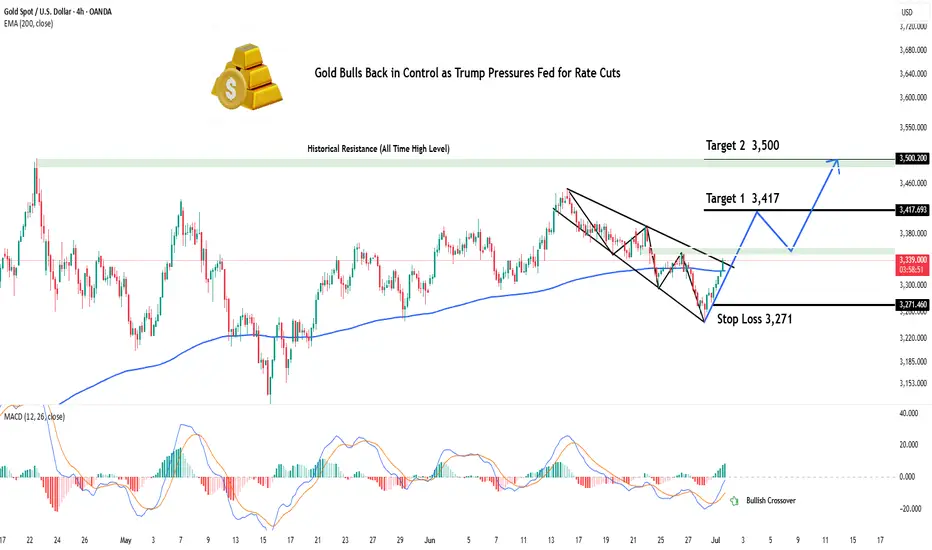
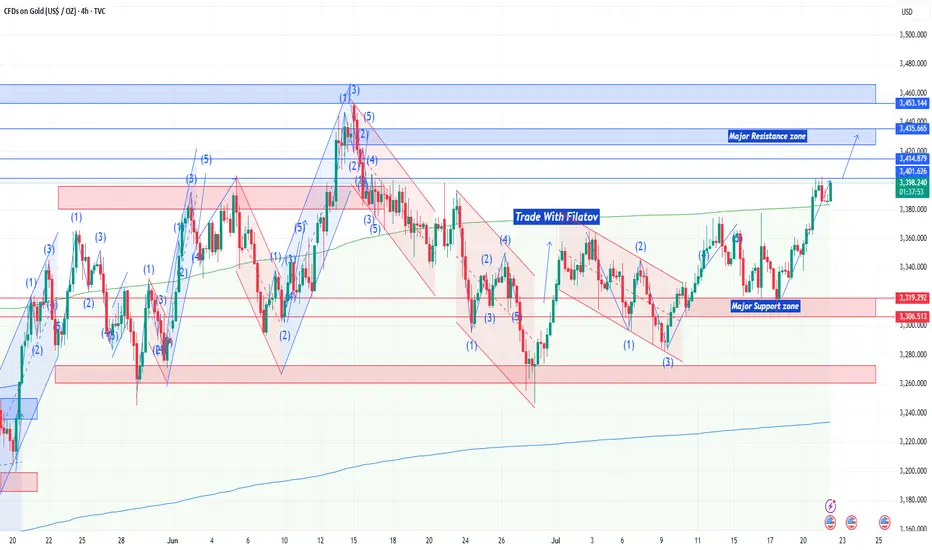
Gold Bulls Back in Control as Trump Pressures Fed for Rate CutsHey Realistic Traders!
President Trump is ramping up pressure on the Fed to cut interest rates , saying the U.S. is falling behind countries with looser policies. As several Fed officials begin to shift their stance, expectations for rate cuts are growing. That’s putting pressure on the dollar and giving gold a fresh boost.
We’ll take a closer look at what this means for OANDA:XAUUSD (Gold) through technical analysis and explore its upside potential.
Technical Analysis
On the 4-hour chart, Gold has moved above the EMA-200, signaling a shift in momentum to the upside. Price has also broken out of a Descending Broadening Wedge (DBW) pattern, which often indicates the start of a bullish trend.
The breakout was confirmed by a Bullish Marubozu candle, reflecting strong buying pressure. To add further confirmation, the MACD has formed a bullish crossover, reinforcing the upward momentum.
Looking ahead, the first target is seen at 3417. If reached, a minor pullback toward the historical resistance zone (green area) may occur, with a potential continuation toward the second target at 3500.
This bullish outlook remains valid as long as the price stays above the stop-loss level at 3271 . A break below this level would invalidate the setup and shift the outlook back to neutral.
Support the channel by engaging with the content, using the rocket button, and sharing your opinions in the comments below.
Disclaimer: "Please note that this analysis is solely for educational purposes and should not be considered a recommendation to take a long or short position on XAUUSD.
Don't chase the bullish trend,wait for the short position layout#XAUUSD
The tariff policy recently announced by the US government is undoubtedly the focus of the current gold market. Trump also tied the tariffs to the trial of former Brazilian President Jair Bolsonaro, adding to policy uncertainty. ⚖️
The implementation of the tariff policy may push up commodity prices, thereby exacerbating inflationary pressure, which is both an opportunity and a challenge for gold📊. On the one hand, rising inflation expectations may enhance the attractiveness of gold as an anti-inflation asset; on the other hand, the strengthening of the US dollar and US Treasury yields may offset this positive. 💡
At present, the lower support has moved up to the 3375-3365 area, where a top-bottom conversion position will be formed. The upper short-term resistance level is 3387-3393, the previous high. If the market touches this for the first time, you can try to see a double top fall.
🚀SELL 3385-3390
🚀TP 3365-3355
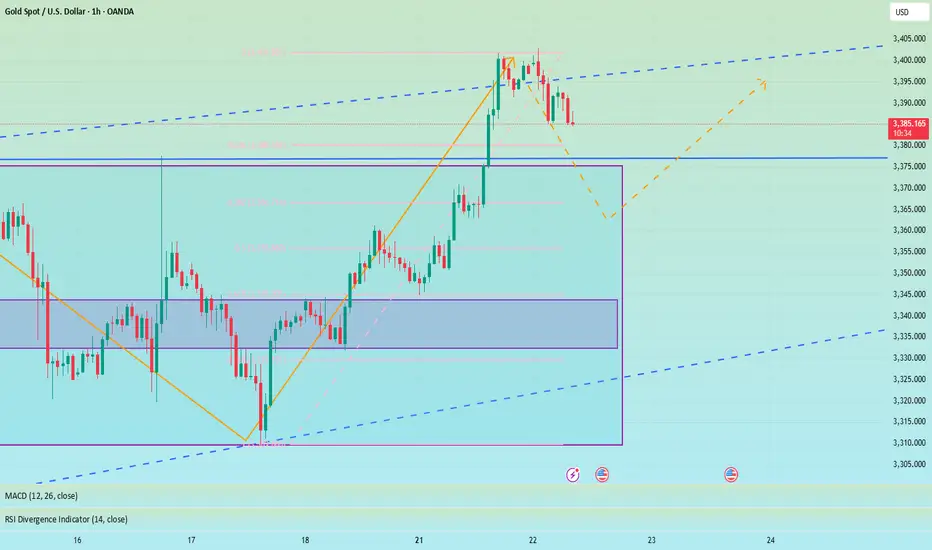
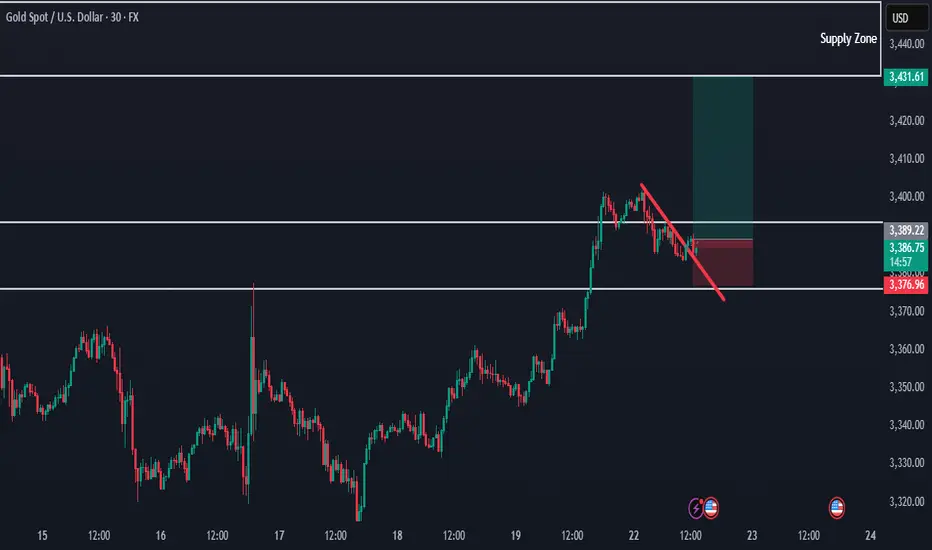
Gold 22/07 – Reversal in Sight After $3400? Watch These Key Zone XAUUSD – Intraday Market Outlook (22/07)
Gold posted a strong rally in the previous session, completing its short-term impulsive wave structure. However, as price approached the psychological resistance at $3400, it began to lose momentum, and a clear reversal candle appeared — a signal that today’s session may favour a pullback or correction.
🔍 Technical Overview
After printing a short-term top, gold is now retracing and has reached a critical support area: the FVG High Zone on the H1 chart. If bearish pressure continues and this level fails to hold, price is likely to drop further in search of deeper liquidity zones.
🔽 Key BUY Zones to Monitor Today
✅ Zone 1 – EL (End Liquidity within FVG): 3367 – 3350
→ A zone with strong potential for short-term rebounds due to previous liquidity sweeps.
✅ Zone 2 – Confluence of FIBO 0.5–0.618 + VPOC (3350 – 3335)
→ A technically significant area where multiple factors align — ideal for medium-to-long term entries.
📌 Trade Setup Ideas
🔸 BUY ZONE: 3351 – 3349
Stop Loss: 3344
Take Profit Targets:
3355 – 3360 – 3365 – 3370 – 3375 – 3380 – 3390 – 3400 – ???
🔸 BUY SCALP ZONE: 3366 – 3364
Stop Loss: 3360
Targets: 3370 – 3375 – 3380 – 3385 – 3390
🔻 SELL ZONE: 3420 – 3422
Stop Loss: 3427
Targets: 3415 – 3410 – 3405 – 3400 – 3390 – 3385
⚠️ Market Risk Reminder
While no major economic data is expected today, that doesn’t mean the market will stay calm. Unexpected volatility can still arise from geopolitical tensions or unscheduled central bank comments. Gold tends to compress and break out aggressively in low-news environments.
📌 Protect your capital with disciplined Stop Loss and Take Profit levels — no forecast is ever 100% certain.
📈 Strategic Outlook
Short-term bias: Market is likely to continue correcting
Medium to long-term plan: A deeper pullback could offer an excellent opportunity to build long positions from key demand zones, especially as markets begin to price in potential Fed rate cuts and gold continues its long-term bullish trend.
💬 Be patient, wait for confirmations, and trade with a clear plan — that’s what separates consistency from chaos.

Gold Spot / U.S. Dollar (XAUUSD) 2-Hour Chart - OANDA2-hour candlestick chart displays the price movement of Gold Spot against the U.S. Dollar (XAUUSD) from OANDA, covering the period up to July 22, 2025. The current price is 3,395.285, reflecting a 1.775 (-0.05%) decrease. The chart includes buy/sell indicators (3,395.780 buy, 3,394.890 sell), a highlighted resistance zone around 3,400-3,425, and a support zone around 3,370-3,386. The chart also features technical analysis tools and annotations indicating potential price trends.

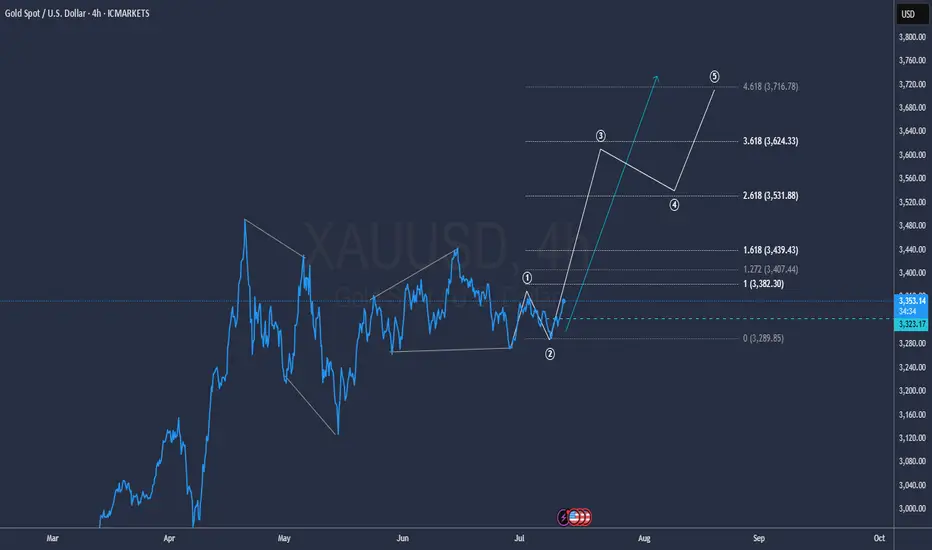
GOLD to the MoonHiper Clear Structure and the beginning of a new impulse towards 3.600 and 3.700
Hope everybody had a chance to got in
gg
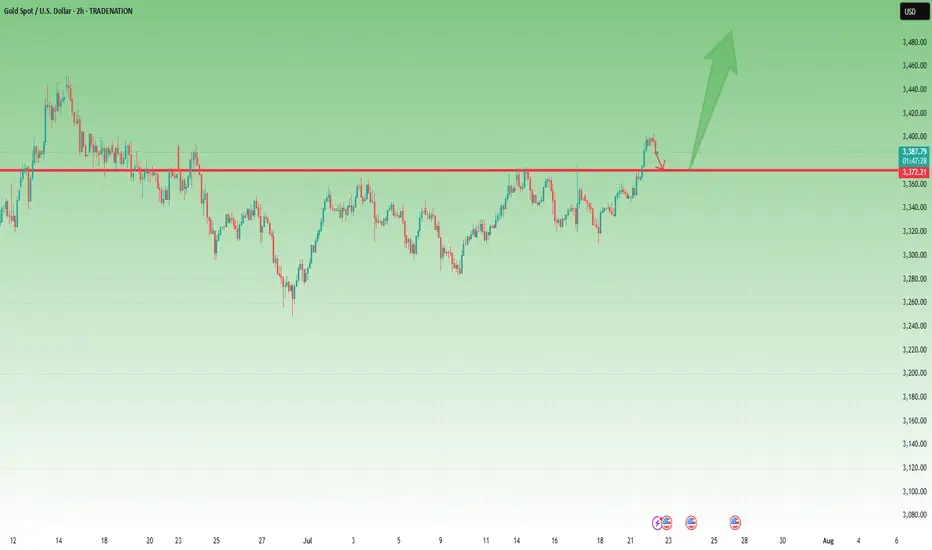
Gold - Above 3370 Is Bullish Territory – But 3360 Must Hold📆 What happened yesterday?
After more than a week of frustrating, sideways price action, Gold finally broke out above the key 3370 resistance zone.
The breakout was clean and impulsive, with TRADENATION:XAUUSD pushing to an intraday high around 3400.
Following that move, price printed a small double top near the high and began a modest correction — perfectly normal after such a breakout. At the time of writing, Gold trades at 3385, still holding above former resistance.
📈 Why this breakout matters:
The daily close at 3396 came in strong and near the top, leaving behind a clear Marubozu candle
This kind of price action signals conviction and momentum
The breakout confirms what I’ve been anticipating for days — the range is resolved, and the market is choosing the bullish path
🎯 What to expect next:
If price stabilizes above 3400, the road to 3450 opens — which is the target mentioned in my previous analyses
That area represents the next major resistance and likely magnet for price if bulls stay in control
🧭 Trading Plan:
For me, the plan is now simple:
✅ Buy the dips — especially on a potential retest of the 3370–3375 broken resistance, which now turns into support
❌ Negation comes only with a daily close below 3360, which would invalidate this breakout and raise questions
📌 Conclusion:
The breakout has finally come. After days of coiling, Gold chose the upside.
Momentum is building, structure is clean, and bulls are back in control — unless 3360 fails.
Until then, I remain bullish, looking to buy dips into strength. 🚀
Disclosure: I am part of TradeNation's Influencer program and receive a monthly fee for using their TradingView charts in my analyses and educational articles.
More Pain for Gold? The Charts Say It’s PossibleSince the start of the London market, gold has almost maintained a narrow range of fluctuations in the 3390-3385 area. Compared with yesterday, the market is much weaker today, and gold has failed to stabilize at 3400 several times, indicating that the sentiment of cashing out near this area is also very high. From the current gold structure, gold is obviously biased towards a long structure. Since gold broke through 3400, 3375-3365 has become the key support area after the top and bottom conversion in the short term.
However, gold rose strongly yesterday but did not stabilize at 3400. The bullish sentiment may no longer be strong. Moreover, after the accelerated rise in gold, the sustainability was not strong, so gold still needs to retreat in the short term. This is why I insisted on shorting gold again near 3400 yesterday. Therefore, I think gold has not yet retreated to the right level. I will pay attention to the opportunity to go long on gold after it pulls back to the 3375-3365 area.
Gold fell after touching 3400 twice. Whether a short-term effective "M" double top structure has been formed, I think more signals are needed to verify. However, in the short term, it is still under pressure in the 3405-3410 range, so if there is no major positive news, I think gold may maintain a wide range of fluctuations in the 3410-3360 range. Therefore, if gold rises to the 3400-3410 range again, I will continue to try to short gold!

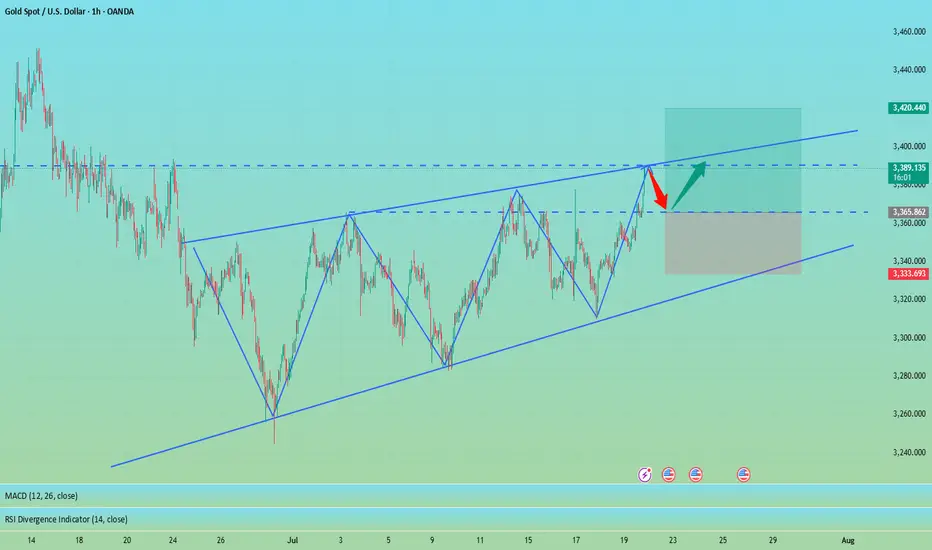
XAUUSD Technical Analysis – Triangle Breakout Ahead?Gold is currently consolidating in a symmetrical triangle pattern around $3,389. If it breaks above $3,402, we can expect a bullish continuation toward $3,420 and beyond. Key support lies at $3,367; a breakdown below this level would turn the trend bearish. The overall trend is still bullish, but a breakout is needed for confirmation.
📈 Potential Scenarios:
✅ Bullish Breakout Scenario:
- Break above $3,392–$3,402 zone.
- Targets: $3,420 > $3,450 > $3,480
- Supported by strong upward BOS (Break of Structure) and higher lows.
❌ Bearish Breakdown Scenario:
- Breakdown below $3,373–$3,367 zone.
- Targets: $3,355 > $3,345
- Would invalidate current bullish structure and form a lower low.
🔮 Trend Bias:
Bullish Bias remains intact as long as price stays above $3,367 and maintains higher lows. However, consolidation suggests waiting for breakout confirmation from the triangle before entering new trades.
🧭 Trend Outlook:
Gold is currently consolidating in a symmetrical triangle pattern, which typically precedes a breakout — either upward or downward. The price is holding above the key Fibonacci support levels and the overall market structure is bullish, suggesting an upward continuation is more likely if buyers maintain momentum.
Note
Please risk management in trading is a Key so use your money accordingly. If you like the idea then please like and boost. Thank you and Good Luck!

GOLD Still Bullish , Are You Ready For New Wave ? 200 Pips ValidHere is My 15Mins Gold Chart , and here is my opinion , we finally above 3400.00 and we have a 30 Mins Candle closure above this strong res , so i`m waiting the price to go back and retest this res and new support and give me a good bullish price action to can enter a buy trade and we can targeting 200 pips , and if we have a 4H Closure Above This res this will increase the reasons for buyers , just wait the price to back a little to retest it and then we can buy it . if we have a daily closure below it this idea will not be valid anymore .

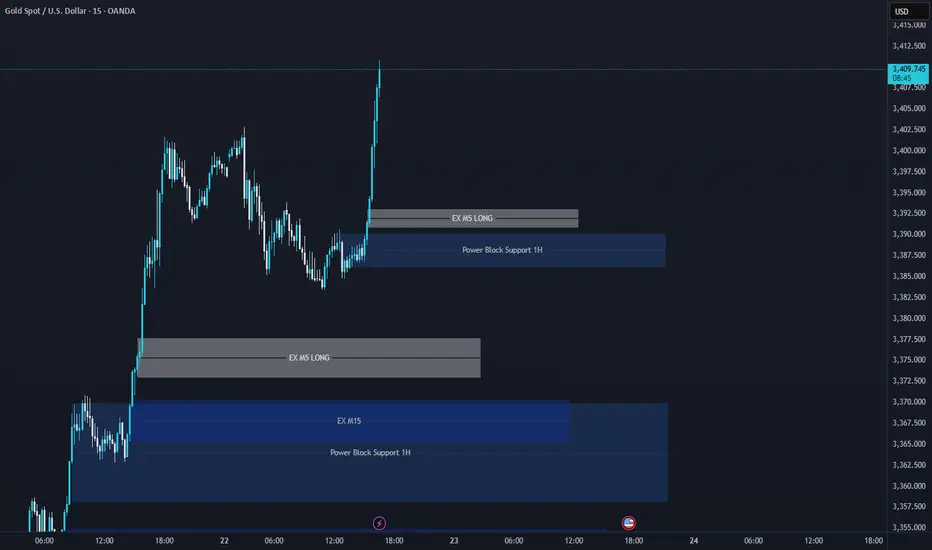
XAUUSD Support & Resistance Levels🚀 Here are some key zones I've identified on the H1/M15/M5 timeframe.
These zones are based on real-time data analysis performed by a custom software I personally developed.
The tool is designed to scan the market continuously and highlight potential areas of interest based on price action behavior and volume dynamics.
Your feedback is welcome!
gold still strong on buyinggold still taking the bullish stand, possible we expect price to keep buying if the H1 closes above 3405 area, then followed by M30 close below 3395 for selling.
the bullish is still strong depending on how the H1 react

XAUUSD Trade Idea: Golden Cross Signals Bullish MomentumGold (#XAUUSD) is surging after breaking above the 61.8% Fibonacci level, confirming strong bullish momentum!
📊 Key Observations:
Price has bounced off the upper trendline, with an imbalance below, suggesting a possible small correction.
The MA50 has crossed above the MA200, forming a Golden Cross – a highly bullish signal!
🎯 Trade Strategy:
🔼 Consider buying ONLY if price consolidates above 3400 & the nearest fractal.
✅ Target: 3435 (next resistance zone)
⚠️ Watch for pullbacks – the Golden Cross supports upside, but a retest of support could offer a better entry.
The bulls rise and fall back to continue.Yesterday, gold technically held high and rose strongly in the Asian session relying on the 3350 mark. Both the European and American sessions formed a strong bullish rise and accelerated to break through the 3370 mark before the US session and continued to rise to the vicinity of the 3400 mark and fell back slightly to close strongly. The daily K-line closed with a shock break of the high-middle positive. The overall gold price broke through the recent rebound high of 3377 to form a bullish strong attack pattern. In the short term, 3377-80 became a new key support area.
From the 4-hour analysis, today's retracement relies on this position to continue to follow the trend of the main bullish bullish trend. The short-term bullish strong dividing line focuses on the 3350 mark. The daily level stabilizes above this position and continues to maintain the rhythm of retracement and bullish bullish trend. Short selling can only enter the market at key points, and enter and exit quickly without fighting.

gold on bulish reverse#XAUUSD await multiple breakout above 3389, possible target will reach new Day high 3305.
Entry at 3389 on 2 times breakout, target 3405 stop loss 3381.
Below 3380. on m15 closure will drop the price
