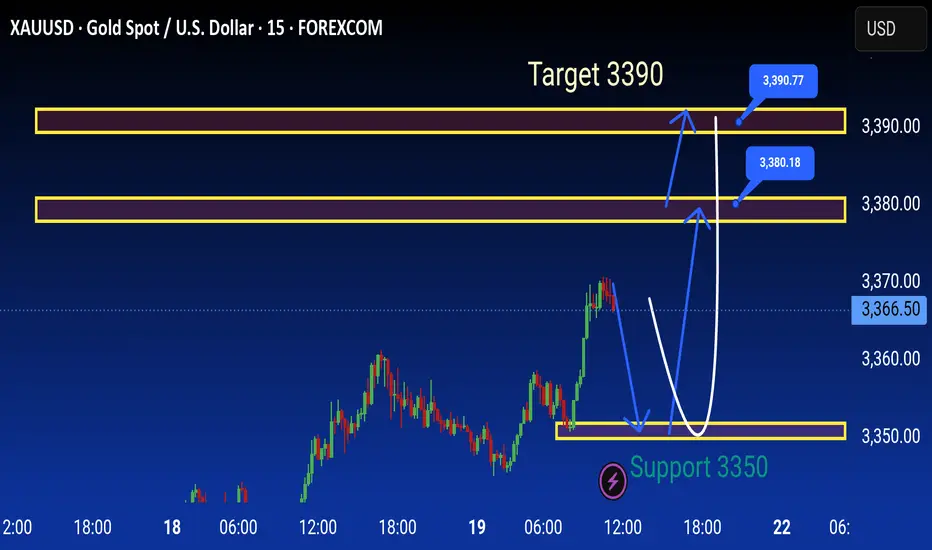
Xauusd Analysis is Ready technical analysis of XAUUSD (Gold Spot vs. US Dollar) on the 15-minute timeframe using support and resistance levels, with projected price movements annotated.
Key Levels:
Support Zone: Around 3350 USD (labeled as "Support 3350")
Resistance Zones:
Minor resistance: Around 3380.18 USD
Major resistance: Around 3390.77 USD
Target: 3390 USD, highlighted as the ultimate bullish goal.
Current Price:
Price at the time of analysis: ~3368.30 USD
Analysis Summary:
1. Support Retest Scenario:
Price may pull back to the 3350 support zone.
If this support holds, a bullish reversal is expected.
The anticipated move is a rebound back toward the resistance zone at 3380, and possibly to the target at 3390.
2. Immediate Bullish Continuation:
Alternatively, price could continue upwards from the current level without revisiting support.
Resistance around 3380 may act as a minor barrier.
If broken, the price could reach the target at 3390.
3. Bearish Risk:
If 3350 fails to hold as support, further downside may occur, invalidating the bullish setup.
Strategy Implication:
Buy positions could be considered on a successful retest and bounce at 3350.
Take-profits might be set near 3380 and 3390.
Traders should watch for price action confirmation at key levels before entering trades.
This is a classic support-resistance trading setup with short-term bullish bias aiming for a breakout toward higher resistance levels
Xauusdanalysis
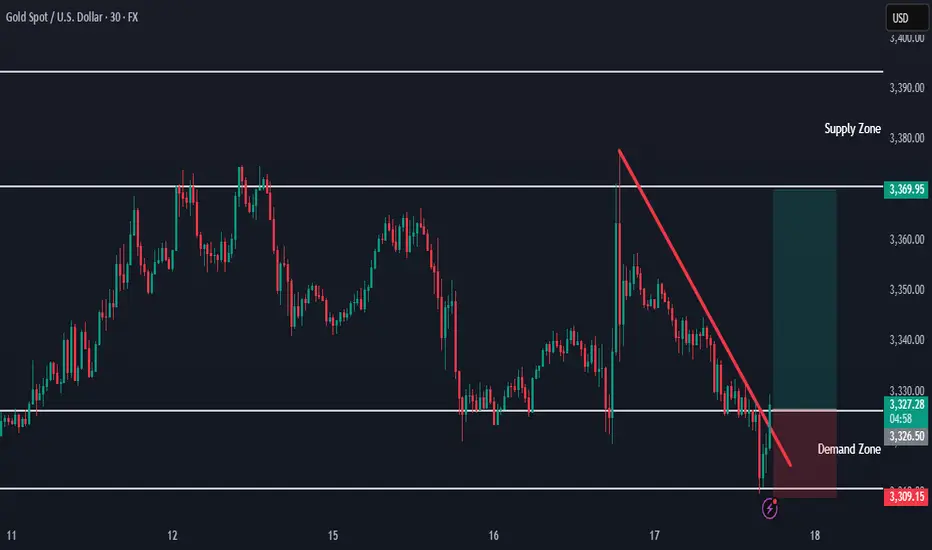
Gold Holding Demand — New Buy Setup FormingThe demand zone on the higher timeframe is still holding, and price is starting to move higher.
A new buy opportunity is forming upon the break of the downward trendline.
Is This the Start of a New Gold Bull Run?News that must be paid attention to:
1. The Middle East region is in constant conflict and the situation is unstable, which may re-stimulate the market's risk aversion sentiment;
2. Trump strongly called for a rate cut, and many Fed directors agreed to the rate cut. Under the situation of internal and external troubles, can Powell withstand the pressure of rate cuts? In addition, the tense relationship between Trump and Powell, as well as the development of Powell's dismissal storm, have increased the market's risk aversion demand and enhanced the market's bullish sentiment;
3. The uncertainty brought about by the tariff issue may disrupt the market.
Technical aspects:
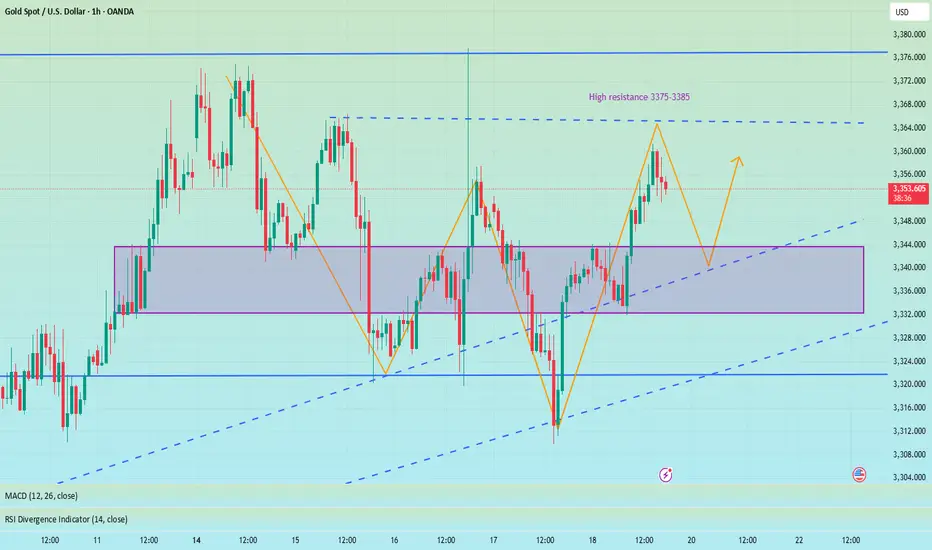
This week, the gold market is roughly a bottoming out and rebounding trend. We can clearly see from the recent candle chart that the recent trend line suppression is located near 3380, and this week gold has repeatedly encountered resistance and fallen in the 3375-3380 area, which has strengthened the suppression effect of resistance in this area to a certain extent; and gold has repeatedly tested the 3320-3310 area support during the retracement process. Gold has not fallen below the support of this area during multiple retracements, giving the market bulls great confidence.
On Friday, gold hit 3360 during the rebound and closed above 3350, which is strong in the short term. As gold continues to rebound, the current bull-bear dividing line is in the 3345-3335 area. If gold cannot even fall below the 3345-3335 area during the retracement next week, it will greatly boost buying power and is expected to hit the 3380 area again. Once gold breaks through the 3380 area during the rise, there will be a chance to further continue the rise and test 3400, or even the 3420 area.
Therefore, at the beginning of next week, if gold retreats to the 3345-3335 area for the first time, I think we must make an attempt to buy gold, first focusing on the target 3370-3380 area, and then bullish to the 3400-3420 area after a strong breakthrough.

XAU/USD Elliott Wave Setup : Triangle Ends, Impulse BeginsThe 8-hour XAU/USD chart presents an Elliott Wave structure, currently in the final stages of Wave 4 within a larger impulsive cycle. The complex correction in Wave 4 has unfolded as a WXYXZ (triple-three pattern), forming a contracting triangle (ABCDE) — a classic consolidation phase that typically precedes a sharp impulsive breakout.
Wave E has recently completed near the lower boundary of the triangle, supported by the ascending trendline drawn from the April low. This suggests the correction is mature and Wave 5 is ready to ignite.
Target 1 (T1) : 3434.845
Target 2 (T2) : 3500.535
Stop Loss (SL) : 3309.729
The triangle (Wave 4) breakout structure suggests bullish continuation.
Multiple internal WXY corrective waves have completed, signaling exhaustion.
Volume and candle structure support the possibility of impulsive buying in Wave 5.

Gold (XAU/USD) Technical Outlook — 21 July 20251. Market Overview & Live Price Confirmation
Gold is currently trading around $3,354, with a daily range of approximately $3,345–$3,359. This places it firmly within its broader uptrend, showing resilience amid recent macro uncertainties and consolidating its position above key support zones.
2. Four-Hour Technical Breakdown
Trend & Structure
The 4-hour chart reveals a strong bullish structure, marked by consistent higher highs and lows. A recent Break of Structure occurred near $3,324, reinforcing the upward bias. A minor Change of Character around $3,360–$3,358 reflects a healthy retracement, but the bigger picture remains strong.
Key SMC & ICT Zones
Supply Zone: $3,360–$3,362 — recent peak area likely to attract sellers and sweep above liquidity.
Demand Zone: $3,340–$3,344 — aligns perfectly with the 38.2% Fib from the $3,308–$3,362 swing, forming a prime area to buy from.
Order Block / FVG Zone: $3,336–$3,342 — open imbalance suggesting price may revisit for efficient entry.
Liquidity Context: Order flow patterns indicate stop hunts around established zones — part of classic Smart Money Concepts.
Fibonacci Levels
38.2% retrace at $3,340, offering medium-term confluence support.
Upside projections via Fibonacci:
1.272 extension: $3,378
1.618 extension: $3,389
3. One-Hour Intraday Trading Setups
Aligned with the 4-hour bullish bias, these setups offer scalable, structured entry opportunities.
Strategy Entry Zone Stop-Loss Take-Profit Risk:Reward
Aggressive Long $3,344 $3,338 $3,358 → $3,362 ~2:1
Conservative Long $3,340 $3,330 $3,362 → $3,378 ~2.5:1
Short Opportunity Rejection @ $3,362 $3,368 $3,344 ~2:1
🌟 The Golden Setup
Buy within $3,340–$3,344 (4H demand + Fib zone + FVG)
Stop-Loss: $3,330
Take-Profit 1: $3,362 (range high)
Take-Profit 2: $3,378 (Fib 1.272)
Why It Works: A confluence of structural support, liquidity zones, and retracement levels gives this setup high predictive quality.
4. Analyst Consensus Snapshot
Market commentary from professional analysts shows alignment with dip-buy strategies. Most recognize the $3,340 region as key support and express caution entering $3,360–$3,375 resistance. Weekly forecasts describe tight trading with potential for breakouts or retracements depending on economic data and Fed commentary, but the medium-term trend remains bullish.
5. Summary & Trading Blueprint
Price Range: $3,345–$3,359 (daily); $3,338–$3,378 (targets)
4-Hour Bias: Bullish, with defined demand and supply zones
Golden Trade: Buy $3,340–3,344 → SL $3,330 → TP1 $3,362 / TP2 $3,378
Catalysts to Watch: Federal Reserve speech, tariff developments, USD movements.
6. Final Thoughts
Gold continues to demonstrate bullish resilience, supported by both technical structure and macro tailwinds. The $3,340–3,344 zone offers a clear, high-probability entry confluence, while stop placement and profit targets are well-defined. Profit management around $3,360 ensures disciplined scaling or early exits if risk factors emerge.
By blending price action, Smart Money frameworks, ICT concepts, and Fibonacci confluence—all structured into actionable trade setups—you have a professional-grade playbook ready for deployment.

7/18: Watch 3343 Resistance, Guard Against Break Below 3323Good morning, everyone!
Yesterday, gold broke below the 3337 support after consolidating there, driven lower by bearish data, and eventually reached the 3323–3312 support zone. A rebound followed, and price has now returned above 3323, which also aligns with the daily MA60.
📌 Key Levels to Watch Today:
Resistance: 3343 / 3352–3358
→ A sustained break above 3343 opens the door for a potential move toward 3366 / 3372–3378;
Support: 3323 / 3312
→ If price remains capped below resistance and weekly close is under 3323, it will signal bearish structural pressure for the medium term.
📌 Trading Strategy:
Trade flexibly within the range of 3358–3343–3332–3323–3312
📌 Important Reminder:
If today’s closing price is below 3323, and you're planning to hold positions over the weekend, it’s safer to lean short. While we can’t predict weekend news, technically, bears have the upper hand, so risk control is essential.
The range breakthrough is waiting for CPI to take effectIn the early stage, it was mainly volatile, and the lowest level in the morning reached 3334, which was also the position we went long last night. Today, we continue to focus on the 3340-45 line and go long, focusing on the release of CPI data. If CPI rises as expected, it means that inflation is rising, and the Fed's annual interest rate cut expectations will be further reduced, and gold prices may be under pressure to fall again; on the contrary, if CPI is lower than expected or even performs well, it means that Trump's tariff war has not had such a big impact on the market, and the Fed's interest rate cut expectations have increased significantly. After breaking through 3375, gold prices may accelerate to rebound to 3385-90 or even 3400. We focus on the release of data. If your current gold operation is not ideal, I hope I can help you avoid detours in your investment. Welcome to communicate with us!
From the 4-hour analysis, the bullish strong dividing line below is 3325-30. Below, we pay attention to the short-term support of 3340-45. The daily level stabilizes at this position and continues to maintain the bullish rhythm of stepping back and falling. The short-term pressure focuses on the vicinity of 3370-75. The overall high-altitude low-multiple cycle participation in this range remains unchanged. I will prompt the specific operation strategy in the link, so please pay attention to it in time.
Gold operation strategy:
1. Go long when gold falls back to 3340-45, and add more when it falls back to 3325-30. Stop loss 3317, target 3365-70, and continue to hold if it breaks;

Gold is in the Bearish DirectionHello Traders
In This Chart GOLD HOURLY Forex Forecast By FOREX PLANET
today Gold analysis 👆
🟢This Chart includes_ (GOLD market update)
🟢What is The Next Opportunity on GOLD Market
🟢how to Enter to the Valid Entry With Assurance Profit
This CHART is For Trader's that Want to Improve Their Technical Analysis Skills and Their Trading By Understanding How To Analyze The Market Using Multiple Timeframes and Understanding The Bigger Picture on the Charts
Monday market forecast, pay attention to the 3339 retracement📰 News information:
1. The Trump administration puts pressure on the Federal Reserve to cut interest rates
2. The continued impact of tariffs and the responses of various countries
📈 Technical Analysis:
This week's basic judgment and forecast on the gold market trend were consistent, but on Friday, the overall gold fluctuations were not large. The overall trend of the daily line fluctuated around 3345, and the 3345 line also became a short-term long-short watershed. Although prices are likely to rise more easily than fall in the short term, it should be noted that the three-month adjustment cycle is coming to an end while the fundamentals of the bull market have not changed. It is recommended that you focus on preventing risks from short position operations next week. At the same time, the overall strong shock pattern, the anti-pulling momentum has not reached the top suppression position, and the area around 3339 below is the previous intensive trading area, which constitutes a certain support in the short term. If the market fails to effectively break below next week, it will greatly boost the bullish momentum, and it is not ruled out that there will be a possibility of refreshing the high point near 3380 next week.
On the whole, the short-term focus next week is the 3345-3335 area below. If it falls back to this point, you can consider arranging long orders. The short-term target is 3355-3365, and the strong trend is expected to continue to touch 3375-3385.
🎯 Trading Points:
BUY 3345-3335
TP 3355-3365-3375-3385
In addition to investment, life also includes poetry, distant places, and Allen. Facing the market is actually facing yourself, correcting your shortcomings, confronting your mistakes, and strictly disciplining yourself. I hope my analysis can help you🌐.
TVC:GOLD PEPPERSTONE:XAUUSD FOREXCOM:XAUUSD FX:XAUUSD OANDA:XAUUSD FXOPEN:XAUUSD
XAUUSD Outlook: Bullish Bias Hi Traders
I am a profitable full time trader with 7 Years experience and I would like to share my journey including profits analysis and signal indicators.
Attached is the XAUUSD chart showing current areas of interest above and below current price which can used to trade profitably.
I still have a bullish bias, but will wait patiently for a retracement into one of the support levels. I will assess price action at lower levels before looking for buy trades.
Key support levels
3,335–3,338
3,320–3,324
Key resistance levels
3,352–3,355
3,367–3,371
Price respected last week’s high (3,377) and is pulling back. The moving averages are also proving a confluence to support our bullish outlook.
Also, please take into account news releases throughout the week before placing any trades to avoid market volatility.
We will share updates throughout the week.
Please let me know your bias for gold this week in the comments.
If you found this helpful, please drop a like to support my work.
Thanks,
PrestigeGoldFX

Gold market directional biasGold currently in a balance sentiment. Now it continues buy rally. In cot report there is still chance of buy rally. but in the upper side there should be a strong sell zone. we have to prepare for this also.
Gold-Bullish Leg to ContinueGold is Bullish. a minor pullback may happen before it continues its leg up. Looking at uncertainty at global level, Gold might push to 3400.
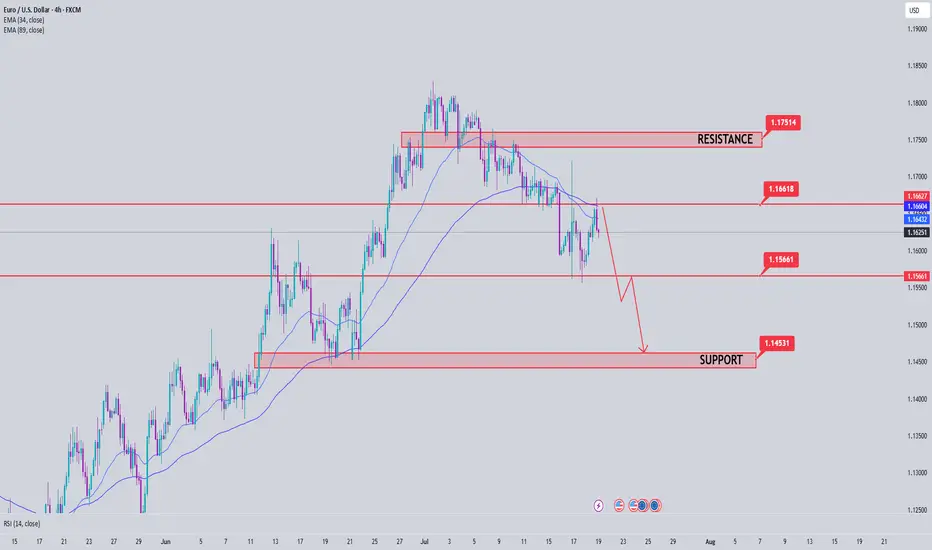
EURUSD Analysis week 30🌐Fundamental Analysis
The USD rose after June retail sales beat expectations and initial jobless claims fell to 221,000. However, the USD's gains were limited as US stocks rebounded late in the session.
On Friday morning, US stock index futures rose 0.2%, indicating that risk sentiment remains dominant. If this trend continues, EUR/USD could hold support.
The next focus is on the Consumer Sentiment and Inflation Expectations Index data from the University of Michigan. If the data is positive, the USD could regain support and put pressure on EUR/USD.
🕯Technical Analysis
EURUSD is in a corrective downtrend towards the 1.145 support. If this support zone is broken, the EURUSD trend will turn to a Downtrend. Currently, the main trading strategy will be to look for SELL points. After price reacted at EMA and trendline and headed to temporary bottom 1.156 and hit important support soon.
📈📉Trading Signals
SELL EURUSD 1.17500-1.17700 Stoploss 1.18000
BUY EURUSD 1.14500-1.14300 Stoploss 1.14000
XAUUSD H4 Outlook – Full Structure & Macro | July 21, 2025Hello, GoldMinds! 💙
After a volatile week, gold remains caught in a wide H4 range, ping-ponging between structural supply and demand. Let’s break down the current picture so you can navigate the next big moves with confidence.
🌍 Macro & Bias
Macro context:
Last week’s US CPI print triggered a temporary rally, but gold failed to hold above resistance and quickly reversed as the dollar strengthened. Next week brings Fed Chair Powell’s testimony, global PMI numbers, and jobless claims—all catalysts for new volatility.
Bias:
Neutral on H4:
Gold is consolidating inside a broad sideways range.
The market is waiting for a catalyst to break above 3375 or below 3310 before showing a real trend.
🔸 Structural Key Supply Zones (Above Price)
1️⃣ 3357–3375 | Main H4 Supply
Why it matters:
Aggressive NY and CPI rallies have been sold off here; price rejected every attempt to close above 3375. OB, liquidity cluster, inducement—this is the first real ceiling above price.
Trade logic:
Watch for M15/H1 reversal or exhaustion. No clean break = supply remains active.
2️⃣ 3384–3400 | Macro Supply
Why it matters:
All failed breakouts from early summer were stopped in this block. Liquidity pool and macro OB; every test led to sharp pullbacks.
Trade logic:
Avoid FOMO—only short with confirmation of rejection.
3️⃣ 3410–3425 | Extreme Supply
Why it matters:
The final upper ceiling for now. Any spike here is likely to see big profit-taking and volatility.
🔹 Structural Key Demand Zones (Below Price)
1️⃣ 3330–3310 | Main H4 Demand
Why it matters:
All major dips last week bounced here—bulls are active in this OB. It’s the base of the current “micro-range,” with clear LTF inducement and high volume.
Trade logic:
Look for bullish reversal (M15/H1) before trusting any long from here.
2️⃣ 3295–3275 | Swing Demand / Discount Zone
Why it matters:
The main structure support for July. Strong OB, historic liquidity sweeps—each deep flush has brought responsive buyers.
Trade logic:
Watch for reaction, but don’t knife-catch without a clear structure break.
3️⃣ 3250–3225 | Extreme Demand / HTF Liquidity Pool
Why it matters:
The “final line” for bulls. This zone has absorbed all major liquidations and created swing reversals since early spring.
📊 H4 Structure Logic
Current play:
Gold is stuck in a structural cage between 3375 and 3310.
Until price closes outside these edges, every spike is likely a liquidity hunt.
Pro move:
Only react to confirmation in these zones—don’t force trades in the mid-range!
🧠 Game Plan
Set alerts at each supply & demand zone.
Wait for confirmation: M15/H1 CHoCH, BOS, wicks, or volume.
Let the news come to you: Powell & PMI will likely force a test of an edge; be patient.
💬 What’s your bias for the week? Drop it below and tag a friend!
🚀🚀🚀 and Follow GoldFxMinds for sniper-level gold planning and deep-dive SMC education.
Posted using the Trade Nation broker feed as part of their influencer program for using their TradingView charts in educational content.
— GoldFxMinds 💙

Gold Strategy: Long in 3320-3330 & TargetsDuring Friday’s (July 18th) US trading session, spot gold traded in a narrow range with a downward bias 😔, currently hovering around 3350.05. Thursday saw spot gold stage a heart-stopping "deep V" move 😲! Driven by the dual catalysts of the US June retail sales surging 0.6% (beating expectations) and initial jobless claims dropping to 221,000, the US Dollar Index once spiked to a monthly high of 98.95, instantly slamming spot gold to an intraday low of 3309.82. Surprisingly, however, gold prices then staged a strong rebound, closing at 3338.86 with a mere 0.25% decline.
This "fake dip" pattern reveals a deep-seated contradiction in the current market – while economic data temporarily supports dollar strength, investors’ inflation concerns triggered by tariffs are forming an "invisible buying force" for gold 💪. The concurrent rise in the dollar and US Treasury yields has indeed weighed on gold prices, yet robust buying interest emerges at every dip window. Behind this phenomenon lies shrewd capital quietly positioning itself. When the 10-year US Treasury yield climbed to a monthly high of 4.495%, gold refused to fall further – this divergence signals significant market 分歧 over the Federal Reserve’s policy trajectory 😕.
Gold Trend Analysis:
Gold remains in a bullish trend 👍. From the daily chart perspective, gold continued its strong upward momentum today, closing with a positive candle. Technically, the MACD bullish energy bars have started to expand, and the KDJ is in a golden cross heading upward, indicating that the overall price is in a strong phase. As long as gold doesn’t break below 3320, the market is expected to continue its upward trajectory, potentially targeting 3375-3400. If it fails to break through, gold may see a minor short-term pullback. If the pullback doesn’t break 3330, gold is likely to gather momentum again to attack 3375; a break below would shift focus to the 3310 support level. As long as 3310 holds, gold remains in a bullish rebound structure. Next week’s broad range is expected to be 3375-3310.
On the 4-hour chart, the KDJ indicator, after being oversold, has started to turn upward and is now in a golden cross. Notably, this upward move has been accompanied by clear medium bullish candles, making KDJ a more reliable indicator here – the potential for continued bullish candles remains high 😃. The MACD fast line is turning upward at a high level, on the verge of another golden cross, with green energy bars continuing to contract and poised to turn red by inertia. Overall, gold’s current trend is either consolidating or rising. Given the clear bullish bias, we can consider firmly going long first, and only observe the possibility of shorting when KDJ approaches the upper 100 level and the MACD fast/slow lines are about to cross.
Focus on buying on pullbacks. The short-term support levels lie at 3330-3320 – as long as these levels hold, they present buying opportunities. If gold rises during the US session, watch whether 3365 and 3375 are broken; a failure to break through could bring pullback space, offering opportunities for short-term short positions.
Gold Trading Strategy 😎: Go long decisively once on the first pullback to the 3320-3330 range 😏, with targets looking at the 3350-3360 range – just wait for profits to roll in 💰!
🚀 Buy @3320 - 3330
🚀 TP 3340 - 3350
Accurate signals are updated every day 📈 If you encounter any problems during trading, these signals can serve as your reliable guide 🧭 Feel free to refer to them! I sincerely hope they'll be of great help to you 🌟 👇

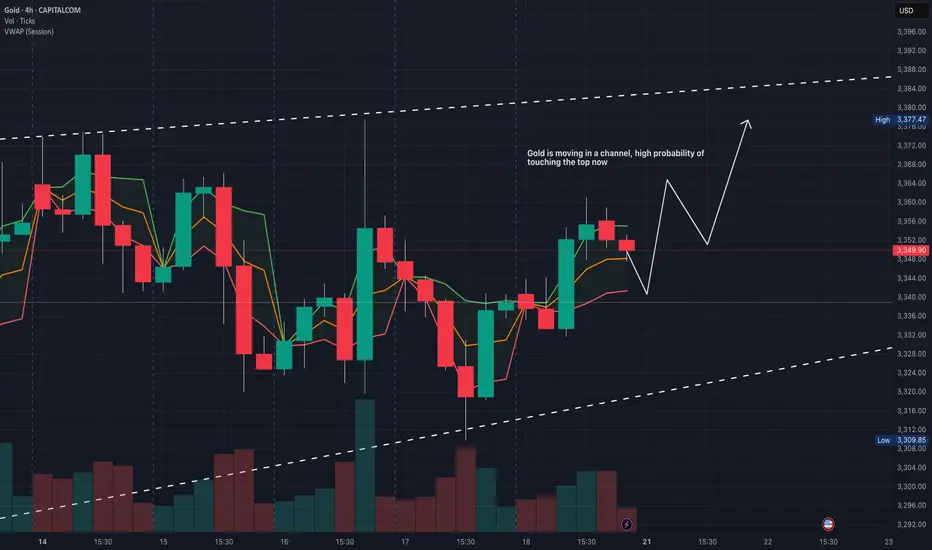
Gold breaks trendline and returns to uptrend. BUY NOW!✏️ OANDA:XAUUSD A deep sweep to 3310 and bounce back to the trading range. Gold is reacting at the Trendline around the price zone of 3344. This is an important price zone that if broken will return to the uptrend and head towards 3373 soon. 3332 plays an important role in the current bullish wave structure, which is a suitable SL placement point for BUY signals.
📉 Key Levels
Support: 3332-3312
Resistance: 3344-3357-3373-3389
BUY trigger: Break and trading above Resistance 3344 (trendline, top uptrend wave 1)
BUY DCA trigger: Break Resistance 3353
Target 3373
Leave your comments on the idea. I am happy to read your views.

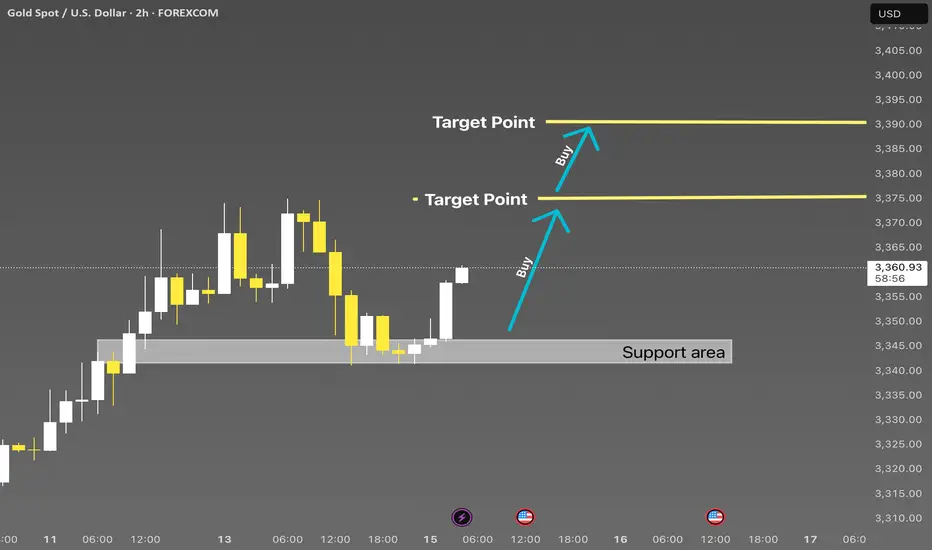
XAUUSD 2H | Smart Money Buy from Strong DemandXAUUSD 2H | Support Rejection with Upside Targets 🎯
Price respected the key support zone and is now showing bullish momentum. Two clear target levels are marked above. Ideal buy opportunity after rejection confirmation from demand zone. Watch for clean continuation toward 3370 and 3390.
#XAUUSD #GoldAnalysis #SmartMoneyConcepts #SMC #Forex #PriceAction #BuySetup
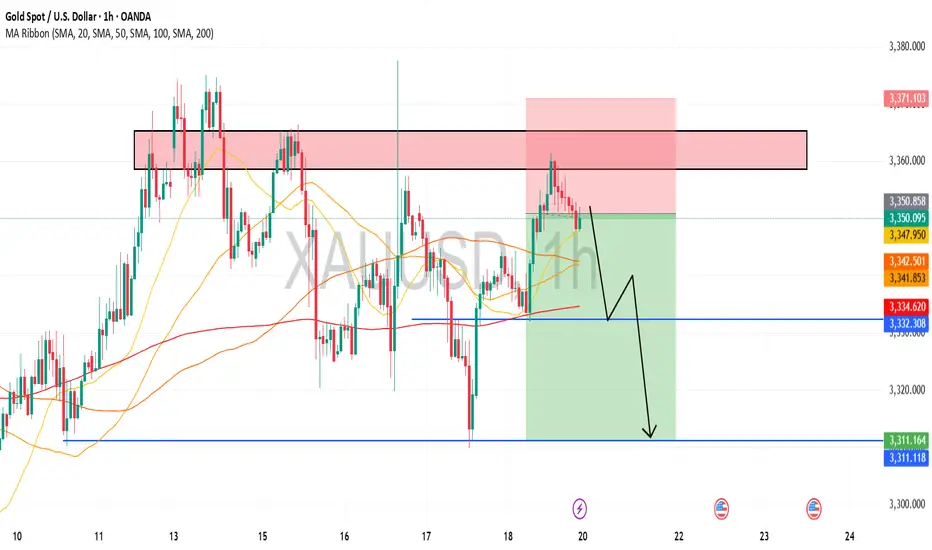
XAUUSD Bearish Structure Breakdown – Targeting 3310 ZoneXAUUSD is currently respecting the key resistance zone near 3340 and forming consistent lower highs, signaling a bearish momentum. After breaking the support area around 3325–3320, we expect price to continue its downward trajectory. If the support fails to hold, the next major target lies at the 3310 zone. This setup aligns with market structure and order flow, suggesting a high-probability sell opportunity on any pullback toward resistance.
Keep an eye on price action near the support zone for confirmation.
Bias: Bearish | Timeframe: 1H

18/07 Gold Outlook Market Tensions Mount Liquidity Zones in Play Gold Outlook – Market Tensions Mount, Liquidity Zones in Play
Price action heats up as we enter the final trading day of the week. Are you ready to ride the wave or get caught in the liquidity sweep?
🔍 Market Sentiment & Global Highlights
Gold rebounded strongly after dropping on better-than-expected US data. However, several macro risks are keeping gold buyers in the game:
Buy-the-dip activity emerged amid concerns that Trump’s tariff policies may fuel inflation.
Rate cut expectations remain strong as US core inflation shows no signs of cooling.
Geopolitical risks intensified as Israel conducted fresh airstrikes on Syria.
EU threatens $84B in tariffs on US goods should trade talks break down.
💡 These tensions are giving gold strong support — especially as traders prepare for potential volatility into the weekend.
📈 Technical Overview – Liquidity Zones at Play
Yesterday's bounce from FLZ H2 (3310) — a critical demand and liquidity zone — triggered a clean reversal. Sellers took profit, volume shifted, and buyers regained control. Price has since pushed up to retest the OBS SELL ZONE + CP Pattern near the 334x area with a sharp reaction.
For today, price is likely to revisit lower liquidity pockets (M30–H2) before making the next directional move.
🔑 Key Levels to Watch
🟢 BUY ZONE: 3318 – 3316
Stop Loss: 3312
Take Profits: 3322 – 3326 – 3330 – 3335 – 3340 – 3345 – 3350 – 3360+
⚡ BUY SCALP ZONE: 3326 – 3324
Stop Loss: 3320
Take Profits: 3330 – 3335 – 3340 – 3345 – 3350 – 3360
🔴 SELL ZONE: 3363 – 3365
Stop Loss: 3370
Take Profits: 3360 – 3355 – 3350 – 3346 – 3342 – 3338 – 3335 – 3330
⚠️ Final Notes
Today’s session has no major news releases, but as it’s the end of the week, we may see liquidity grabs and unexpected volatility. Stay disciplined, stick to your plan, and always respect TP/SL.
🔔 Follow the key zones carefully – volatility loves indecision.

Gold Elliott Wave Bearish SetupGold 8H Analysis:
The chart shows a potential Elliott Wave pattern completing its 5th wave. After hitting resistance near 3383, price reversed at point (4) and is projected to drop toward the support zone near 3281. Bearish momentum expected.

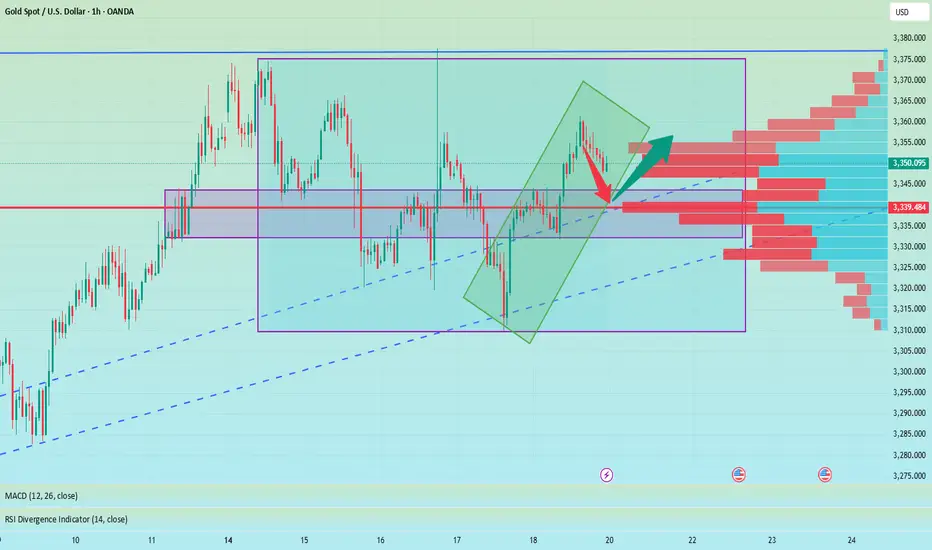
Double Top + Zigzag Complete: Are Bears About to Take Over Gold?Yesterday, the financial markets in general, including Gold ( OANDA:XAUUSD ) , acted like a roller coaster after the news of Powell's dismissal . After this news was denied , Gold returned to its main trend, which I published in my previous idea .
Gold is currently re-attacking the Support line , Support zone($3,326-$3,325) and 50_SMA(Daily) .
In terms of classic technical analysis , it seems that gold has formed a Double Top Pattern for support breakdowns, where a Support line breakdown can also be accompanied by a neckline breakdown .
From the perspective of Elliott Wave theory , it seems that Gold has managed to complete the Zigzag Correction(ABC/5-3-5) , and we should wait for the next bearish waves .
I expect Gold to break its supports and move towards $3,290 ; support breaks are best done with high momentum . An important price that can change the direction of Gold's downside is $3,350 .
Note: If Gold breaks the Resistance lines and forms an hourly candle above $3,351(Stop Loss (SL)), we can expect further Gold gains.
Gold Analyze (XAUUSD), 2-hour time frame.
Be sure to follow the updated ideas.
Do not forget to put a Stop loss for your positions (For every position you want to open).
Please follow your strategy; this is just my idea, and I will gladly see your ideas in this post.
Please do not forget the ✅ ' like ' ✅ button 🙏😊 & Share it with your friends; thanks, and Trade safe.

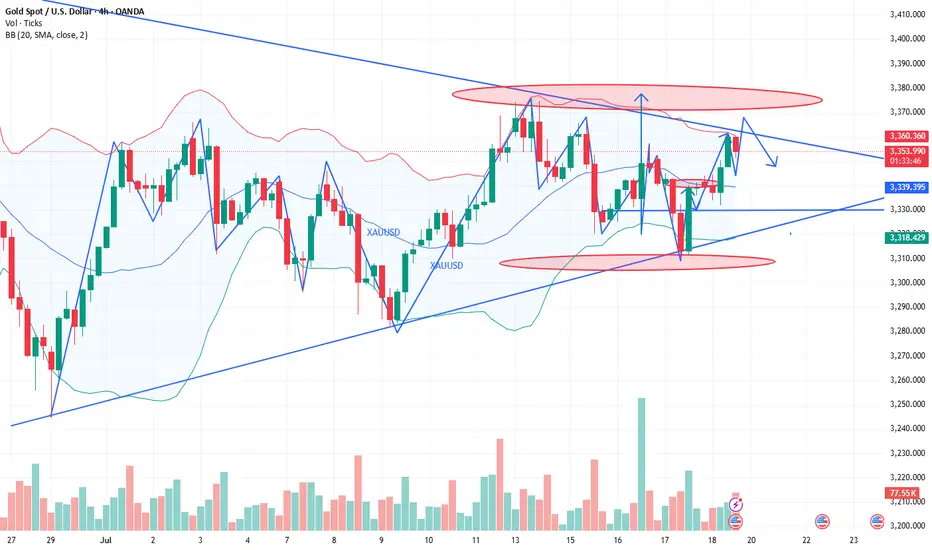
How to operate the gold market opening next MondayAnalysis of gold market trends next week:
Analysis of gold news: Spot gold fluctuated and rose in a narrow range during the U.S. market on Friday (July 18), and is currently trading around $3,354.05 per ounce. On Thursday, spot gold staged a thrilling "deep V" market. Under the dual stimulation of the U.S. retail sales data in June exceeding expectations by 0.6% and the number of initial jobless claims falling to 221,000, the U.S. dollar index once soared to a monthly high of 98.95, instantly suppressing spot gold to an intraday low of $3,309.82 per ounce. But surprisingly, the gold price then rebounded strongly and finally closed at $3,338.86, down only 0.25%. This "fake fall" market reveals the deep contradictions in the current market-although economic data temporarily supports the strengthening of the U.S. dollar, investors' concerns about inflation caused by tariffs are forming a "hidden buying" of gold. The joint rise of the U.S. dollar and U.S. bond yields did suppress gold prices, but strong takeover orders emerged in each falling window. Behind this phenomenon, smart money is quietly making plans. When the 10-year U.S. Treasury yield climbed to a monthly high of 4.495%, gold refused to fall further. This divergence suggests that the market has serious differences on the direction of the Fed's policy.
Technical analysis of gold: After the opening yesterday, gold continued to fall slowly, and the negative impact of the unemployment data in the U.S. market further suppressed the bullish momentum. The lowest price in the U.S. market reached 3310, and the cumulative decline for the whole day exceeded 30 US dollars. But the key is that gold rebounded again at midnight, forming a wide range of fluctuations on Thursday, which was completely in line with expectations. The 3310 bottom-picking and long-term strategy given during the session successfully captured large profits in the band. This trend once again verified the core judgment of this week: gold is in a high-level fluctuation dominated by a bullish trend, and the practical value of this view continues to highlight. After clarifying the current dual attributes of "bullish trend + volatile trend", Friday's trading needs to focus on the effective profit space within the range. It is expected that the 3375-3310 large range will be difficult to break this week, and the small range can be locked at 3355-3320. Before the range is broken, high-selling and low-buying operations can be performed.
.
The technical side shows that the daily line and the 4-hour Bollinger Bands are closed synchronously. At this time, there is no need to worry about the direction, and effective trading can be achieved by keeping a close eye on the range boundary. It is worth noting that the 4-hour moving average system has obvious upward divergence characteristics. Continuing the rebound momentum at midnight on Thursday, gold still has room to rise today, and the upper target is 3360-3365. The small cycle support is clear: 3330 and 3320 are not broken, both are good opportunities for long positions. During the US trading session, it is necessary to pay attention to the breaking of the 3365 and 3375 resistance levels: if the pressure is not broken, there will be room for a decline, and short-term short positions can be tried. On the whole, Charlie suggests that the short-term operation strategy for gold next week should focus on buying on pullbacks and buying on dips, supplemented by rebounds and selling on highs. The short-term focus on the upper side is the 3375-3385 line of resistance, and the short-term focus on the lower side is the 3340-3330 line of support. FX:XAUUSD ACTIVTRADES:GOLD VANTAGE:XAUUSD TVC:GOLD ICMARKETS:XAUUSD CMCMARKETS:GOLD SAXO:XAUUSD
Long and short fluctuations, the market is waiting for a break📰 News information:
1. Powell responds to White House issues
2. Will other countries impose reciprocal sanctions on tariffs?
📈 Technical Analysis:
Although the MACD indicator of the gold hourly line formed a golden cross, the market reached a high of around 3361, and the RSI indicator was close to the overbought area, so we need to be cautious about corrections. From the 4H chart, the MACD second golden cross is on the zero axis. Currently, we are paying attention to the moving average SMA5 near 3343, and the SMA60 support line 3332. If the 4H upward trend falls back, we need to go long. At present, gold is still running above, and there is no good participation point in the short term, but on the whole, we should pay attention to the support of 3345-3332 below, and we can consider going long if it retreats and stabilizes. We continue to pay attention to the resistance pressure of 3375-3385 above, and we can try to go short if it does not break.
🎯 Trading Points:
SELL 3375-3385
TP 3365-3355
BUY 3345-3332
TP 3365-3375-3385
In addition to investment, life also includes poetry, distant places, and Allen. Facing the market is actually facing yourself, correcting your shortcomings, facing your mistakes, and exercising strict self-discipline. I share free trading strategies and analysis ideas every day for reference by brothers. I hope my analysis can help you.
FXOPEN:XAUUSD OANDA:XAUUSD FX:XAUUSD FOREXCOM:XAUUSD PEPPERSTONE:XAUUSD TVC:GOLD