Gold (XAU/USD) Setup based on 30-minute chartGold (XAU/USD) Setup based on 30-minute chart
**Bullish Scenario**
* **Support Held**: Price is currently testing a key horizontal support zone (\~\$3,320–\$3,327), which has held multiple times in the past.
* **Potential Reversal**: If price forms a bullish candlestick pattern here (e.g., bullish engulfing, hammer), we may see a rebound.
* **Upside Target**:
* **First Resistance**: \$3,345–\$3,350 (green zone)
* **Further Target**: \$3,380–\$3,400 if momentum continues
**Confirmation Triggers**:
* Bullish price action from support zone
* Break above EMA 7 / EMA 21 (\~\$3,330–\$3,336)
* Increasing volume on green candles
**Bearish Scenario**
* **Breakdown Threat**: Price is hovering near support; if it breaks below \$3,320 with volume, downside pressure may intensify.
* **Next Support Levels**:
* \$3,310 (minor)
* \$3,285–\$3,275 (major support)
**Bearish Triggers**:
* Clear break and close below \$3,320
* EMA crossover (short-term below long-term)
* Rising red volume bars
Summary
| Direction | Conditions | Targets |
| ---------- | --------------------------------------------------- | ------------------------- |
| Bullish | Hold above \$3,320 + breakout above \$3,336 (EMA50) | \$3,350 → \$3,380–\$3,400 |
| Bearish | Break below \$3,320 support | \$3,310 → \$3,285 |
Xauusdanalysis

Waiting for the Break: 3375 or 3320 Will Decide the Next 1k Pips📉 Quick recap:
As you know, I've been bullish on Gold. However, as explained in yesterday’s analysis, I started to approach this view with more caution. Unfortunately, I closed my long position at break even… before the rally to the 3375 resistance. That’s trading.
📌 What now?
Despite missing that move, the market is beginning to offer more clarity. There are now two key levels that will likely define the next major swing:
________________________________________
🔹 1. Resistance at 3375 – Top of the Range / Triangle Breakout Zone
• This level marks the upper boundary of the recent range
• It’s also the resistance of a developing ascending triangle
• A clean breakout above 3375 would confirm the pattern and could trigger a strong upside acceleration
• Target: 3450 zone, with potential for more if momentum kicks in (approx. 1000 pips higher)
➡️ This is the obvious bullish scenario – in line with the broader trend and classical technical setup.
________________________________________
🔻 2. Support at 3320 – The Less Obvious, but Classic Gold
• 3320 is now a confluence support area
• Technically, a break below here is less probable – but Gold has a habit of doing the unexpected
• If 3320 breaks, bears could look for a first leg to 3280 (approx. 400 pips), and very probably 3250 (around 700 pips drop)
➡️ This bearish scenario is not the base case, but it must not be ignored. Sometimes the trap is in the obvious.
________________________________________
🧭 Trading Plan:
For now, I’m out of the market, patiently waiting for confirmation. I’ll trade the breakout – whichever side gives the signal first.
________________________________________
📌 Conclusion:
Gold is coiling for a larger move. The levels are clear: 3375 and 3320 are the doors. One of them will open. Until then, we wait and prepare. 🚀
Disclosure: I am part of TradeNation's Influencer program and receive a monthly fee for using their TradingView charts in my analyses and educational articles.
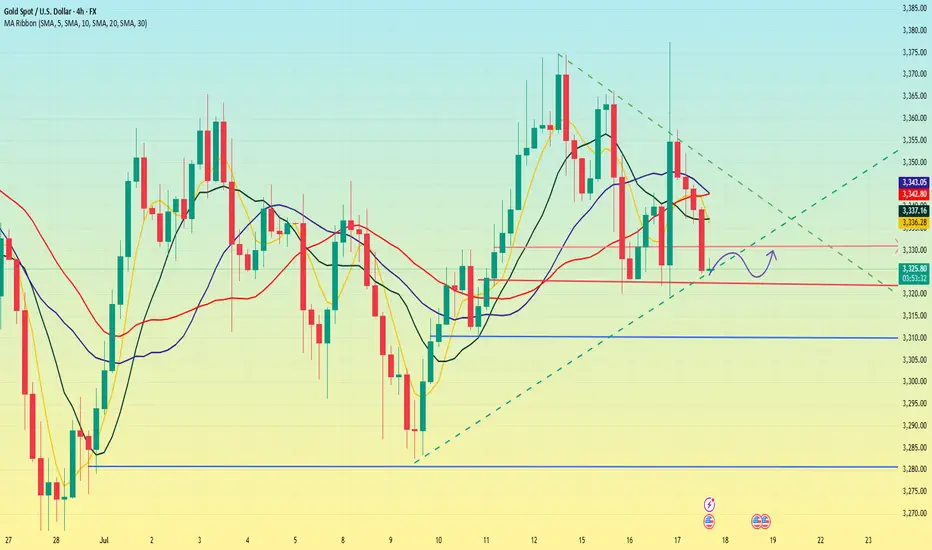
Gold Ranging Between HTF Zones — Buy Setup FormingHello everybody!
Price is fluctuating between two higher timeframe supply and demand areas.
The market structure on the lower timeframes changed yesterday, and now we’re watching to see if the newly formed small demand zone will hold.
The break of the downward trendline is our signal to enter a buy position.

Gold Rejected Post-CPI – Bearish Momentum Building Below $3,365Gold is currently trading near $3,338, continuing to show signs of rejection after testing the key $3,365–$3,392 resistance zone. The market has reacted to the July 15 U.S. CPI release, and despite initial volatility, gold failed to break above its major diagonal trendline, forming a lower high, a strong technical sign of weakening bullish momentum.
If price breaks below $3,330, it could trigger a wave of selling pressure down to $3,303 and $3,248 in the coming days. Traders should monitor price behavior around these zones for short-term entry opportunities.
📌 Technical Breakdown
Resistance Zone:
- $3,365–$3,392 remains the critical ceiling where gold got rejected for the third time in recent sessions.
- This zone aligns with the top of the descending wedge, long-term black trendline.
Bearish Structure Forming:
- After multiple attempts, gold could not sustain above the resistance.
- A series of lower highs and a weakening bullish push suggest a bearish continuation is likely.
Support Levels to Watch:
- Immediate: $3,337
- Mid: $3,320
- Strong: $3,303 (0.382 Fib) and $3,293
- Final Target: $3,248 → $3,220 → $3,193
🔺 Bullish Invalidation Scenario
If gold manages a clean breakout and close above $3,392, this bearish setup will be invalidated. In that case, upside targets would include:
- $3,412
- $3,434
- $3,490 (macro trendline)
But at the moment, that seems unlikely unless driven by unexpected fundamentals.
Note
Please risk management in trading is a Key so use your money accordingly. If you like the idea then please like and boost. Thank you and Good Luck!

Gold market price trend analysis and operation strategyGold trend analysis:
Gold reached a high of 3366 yesterday, a low of 3320, and closed at around 3325. From the daily chart, the performance of the daily cycle is high and closed negative, and it may not be able to go out of the big rise in the short term. Gold will fall into range fluctuations. The rise of gold in this cycle has not actually been completed. At least it needs to go to the high point of 3400, and then look at the adjustment space within the week, but don’t look too much at the strength of the rise. The general trend is bullish, and we must also beware of the adjustment space that may fall back at any time. Gold tried 3375 several times yesterday and failed to break through, and then fell back for adjustment, indicating that the pressure on 3375 is obvious, that is, gold needs to fall back and correct in the short term. At this time, we are cautious about chasing more and continue to buy more after falling back.
From the 4-hour chart, gold rose and fell yesterday, and the bearish trend did not continue. Gold entered a period of adjustment. From the current K-line, the downward momentum of gold is slowing down, and it tends to rebound in the short term. In the 4-hour chart, the lower track support of the Bollinger Band is near 3320, and the position of the middle track of the Bollinger Band is near 3345, which will form a short-term resistance. From the 1-hour chart, after yesterday's drop to 3320, it was strongly supported again and pulled up to above 3330. The support below is still strong. If the European session rises and breaks through 3350 today, the US session may go to the resistance of 3365-3375. Before breaking through 3350, the current market can only be regarded as a bottom adjustment and correction. Today, we will first focus on the rebound strength. If the upward momentum weakens, pay attention to the support of 3310-3300 below, and wait for the decline to be mainly low-multiple. In the short term, we will first focus on the breakthrough of the shock range. The intraday idea is to fall back to low-multiple. FX:XAUUSD ACTIVTRADES:GOLD OANDA:XAUUSD TVC:GOLD EIGHTCAP:XAUUSD ACTIVTRADES:GOLD
Gold rebounded and shorted in the New York market.Trump's recent remarks about "possibly firing Fed Chairman Powell" triggered risk aversion in the market, and gold once surged to $3,377, but then Trump denied the plan and gold prices fell back to fluctuate in the 3,340-3,350 range; the U.S. PPI in June was flat month-on-month, lower than expected, easing market concerns about the Fed's immediate tightening of policy, but long-term inflation expectations still support gold; Israel's air strikes on Syria have exacerbated tensions in the Middle East, and safe-haven demand has boosted gold; Trump threatens to impose tariffs on the EU, and global trade uncertainty still supports gold's safe-haven properties; gold fluctuated and fell today. After yesterday's big rise, gold gradually fell today. Today, gold fluctuated weakly, and the 4-hour moving average crossed downward. The gold price gradually moved toward the lower Bollinger band, and the Bollinger band opened downward. The trend is more bearish. In terms of operation, we recommend that gold rebound and go short. FOREXCOM:XAUUSD ACTIVTRADES:GOLD FXOPEN:XAUUSD ACTIVTRADES:GOLD VANTAGE:XAUUSD CMCMARKETS:GOLD VANTAGE:XAUUSD

Gold Rejects Resistance Again – Gold Rejects Resistance Again ?Gold is currently trading near $3,335, showing signs of exhaustion after a failed breakout above the recent consolidation range. The market attempted to push higher but lacked strong momentum, leading to a pullback and possible shift in bias. The price is forming lower highs, indicating bearish pressure building up on the 4H timeframe. Gold is showing weakness after a second breakout followed by a possible retest failure. The market structure indicates a bearish bias
🔍 Market Structure Overview:
- Two Breakouts: Price attempted two bullish breakouts recently. The first breakout gained some traction, while the second failed to hold above resistance.
- Failed Retest: Price has now returned back near the previous breakout zone (~$3,332), signaling a potential bearish reversal pattern.
- The chart structure suggests a distribution phase, with price struggling to hold gains, and sellers slowly gaining control.
🧭 Key Support and Resistance Levels:
✅ Resistance Zones:
- $3,337.54 – Immediate resistance (recent rejection zone)
- $3,348.03 – Strong resistance if price pushes above $3,337
- $3,412.76 – Major resistance from previous swing high
- $3,490.40 – Long-term psychological resistance
🔻 Support Zones:
- $3,318.94 – Immediate support (just below current price)
- $3,303.46 – Key fib retracement (0.382 level)
- $3,248.28 – Strong horizontal support (major zone)
- $3,193.11 – Fibonacci extension level (-0.382)
- $3,159.02 – Next support zone (Fibo -0.618 level)
🟠 Current Bias:
Bearish to Neutral – as long as price remains below $3,337.
If price breaks and holds above $3,337 with volume, short-term bullish reversal is possible.
Yeterday there was a fake news and gold was pumped but after clarification it was dumped. It means buyers are not much interested till fed next meeting and the high price of the gold. Sellers will short the gold on every rise while buyers will wait for low price of the gold for long term trade.
Note
Please risk management in trading is a Key so use your money accordingly. If you like the idea then please like and boost. Thank you and Good Luck!

Gold Trading Idea: Short Opportunity on 15-Min Descending ChanneHello TradingView Community,
Following up on my Gold analysis from Monday, the price action has respected the levels I outlined (check my previous posts for the breakdown), delivering solid trade opportunities except yesterday's news-driven volatility. Today, we're eyeing a short setup on Gold based on the 15-minute timeframe.
Technical Analysis:
Gold is moving within a descending channel on the 15-min chart.
I've identified equal highs and a small FVG (Fair Value Gap) aligning with the 61.8% Fibonacci retracement of the channel's range.
This confluence zone is where I expect the price to react, potentially clearing liquidity above the channel before reversing.
Trade Plan:
Entry: Wait for the price to reach the confluence zone (equal highs + 61.8% Fib + FVG) and show a clear reaction (e.g., rejection or reversal pattern) before entering a short position.
Take Profit: Targeting 3310 level.
Risk Management: If the price fails to reach the zone and breaks lower, I'll stay out to avoid chasing trades. Patience is key here.
Stay disciplined, traders! Let the price come to our zone, and always manage your risk.
Follow for more setups, like this post if you found it helpful, and drop your thoughts in the comments below! Let’s discuss!
#Gold #XAUUSD #ShortSetup #TechnicalAnalysis

Continue to go long after bottoming outYesterday, the Trump and Powell incident caused gold to rise strongly to around 3377. The rise in gold was only short-lived. In the end, gold closed positively on the daily line, but it closed with a super long upper shadow line. In the end, the gold price quickly rose and broke through the 3377 mark, but fell back under pressure and closed in a volatile market. The daily K-line closed high and fell back in a volatile market. Although the overall gold price repeatedly fluctuated and washed out under the stimulation of news, it ultimately failed to break through the recent large box oscillation range. Today we continue to pay attention to the support line of 3318-25 below, and we will continue to go long if it falls back!
From the 4-hour analysis, the short-term support below continues to focus on around 3318-25, the short-term suppression above focuses on the 3340-45 line, and the key pressure above focuses on the 3380 line. Relying on this range as a whole, the main tone of high-altitude and low-multiple cycles remains unchanged. In the middle position, watch more and do less, be cautious in chasing orders, and wait patiently for key points to enter the market.

GOLD - Its Breakout? Short now??#GOLD.. perfect move as per our analysis, and now market just break hit current supporting area that was actually 3328
so keep close it and if market stay below that then we can expect a further drop towards our next supporting areas.
good luck
trade wisely
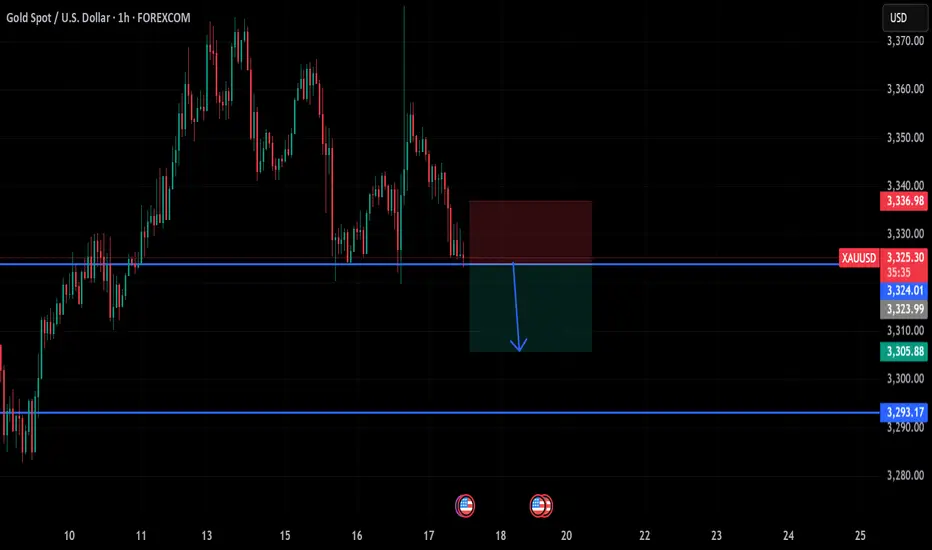
gold on sell#XAUUSD await breakout below 3324 which holds sell continuation. Expected target is below 3305-3292.
Below 3324 will drop the price, target 3305-3292, stop loss 3337.
Fundamental can change price back to Bullish. So we watch closely.
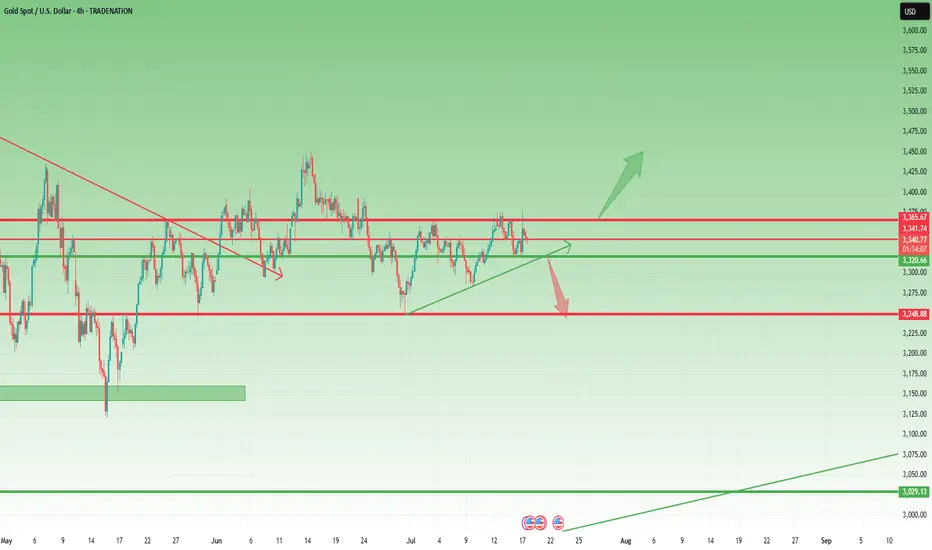
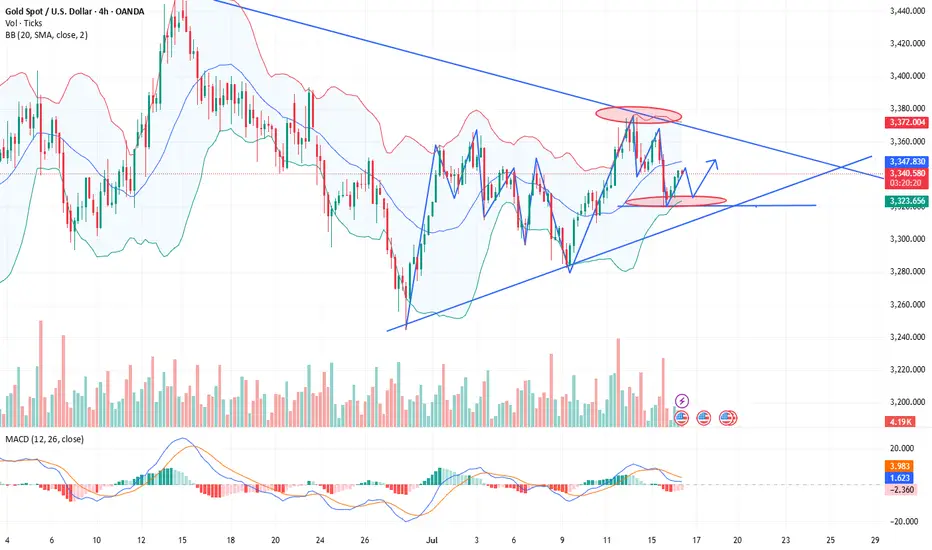
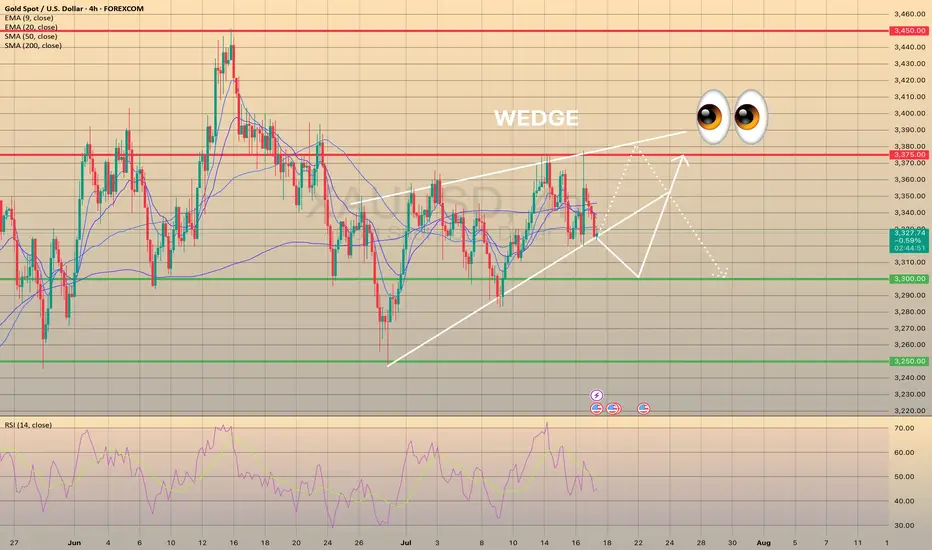
WEDGE IN XAUUSD, POSSIBLE OUTCOMESWEDGE IN XAUUSD, POSSIBLE OUTCOMES👀
Since the fundamentals didn't influence this asset (I mean yesterdays U.S. PPI report, escalation in the Middle East and Trump's hint on Powell's resignation), let's talk about technicals in gold.
XAUUSD primarily trades sideways since the beginning of June. Main support levels are 3,250.00 and 3,300.00. Main resistant levels are 3,375.00 and 3,450.00. Currently the asset trades within a range of 3,300.00 - 3,375.00. Additionally, bullion has formed a bearish wedge since the beginning of July. Right now the price is heading towards lower border of this wedge, where the SMA50 is situated and may act as an additional support here.
I see 2 main scenarios for a mid-term here:
1) Break below the wedge, rebound from 3,300.00 support, targeting 3,375.00.
2) Rebound from the wedge’s lower border, show a bearish move to 3,375.00, then drop to 3,300.00.
In both cases, I assume the price to stay sideways for a long period of time.
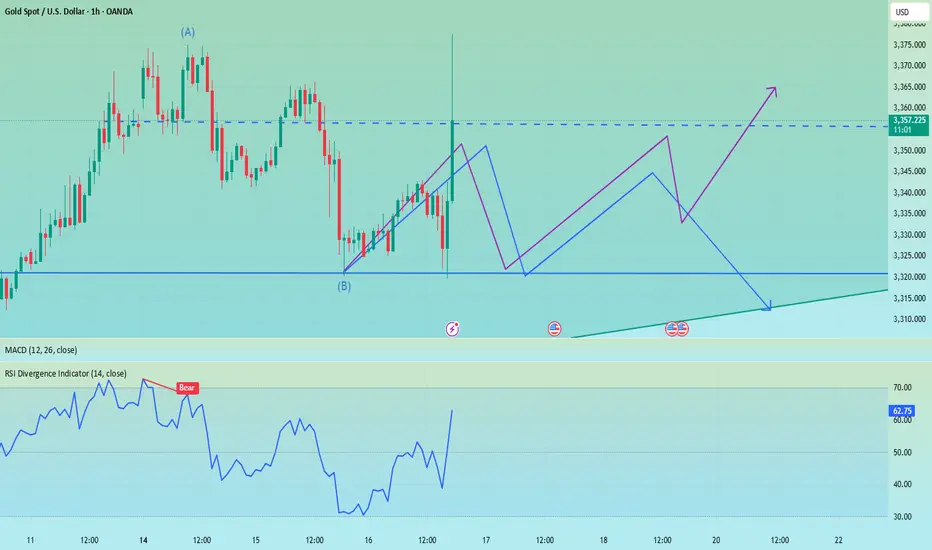
NordKern - XAUUSD InsightNordKern | Simplified Insight OANDA:XAUUSD Short Opportunity Ahead
Gold saw a sharp surge in price today, primarily driven by political headlines that temporarily shook market sentiment. To be specific:
📅 Jul 16, 2025 – 16:56 CET
CBS Reports: Trump asked Republican lawmakers whether he should fire Fed Chair Jerome Powell. This headline alone triggered an intraday spike of +$52/oz in gold as markets priced in increased macro and institutional risk.
As previously stated "Context Matters."
While the President cannot remove the Fed Chair without cause, even the suggestion introduces uncertainty and undermines confidence in the Fed’s independence especially ahead of a high-stakes election cycle.
However, further developments quickly followed: 📅 Jul 16, 2025 – 17:58 CET
Trump: “Firing Powell is highly unlikely.” 📅 Jul 16, 2025 – 18:06 CET
Trump: “Reports on me firing Powell are not true.” With this clarification, the initial rally appears overstretched and sentiment-driven, leaving room for a corrective pullback as the market digests the full picture.
Trade Setup - Short Bias
Parameters:
Entry: 3356.40
Stop Loss: 3690.30
Take Profit: 3322.00
Key Notes:
- The spike was headline-driven and not supported by policy shift or macro data.
- Trump’s denial removes much of the political risk premium that had been briefly priced in.
- Watch for momentum fading near resistance and confirmation via intraday structure.
This remains a tactically driven setup. Manage risk appropriately and stay alert for any renewed political developments.

False breakout? Gold reverses sharply after news surgeBecause of the news that Trump hinted at firing Powell, gold surged strongly in the short term and passed to 3377, recovering the recent decline in one fell swoop. We went long on gold near 3323 in advance, and went long on gold near 3340 again after gold retreated, hitting TP: 3345 and 3355 respectively. The two long trades successfully made a profit of 370pips, with a profit of more than $18K.
Although gold has risen sharply in the short term and effectively destroyed the downward structure, it is mainly news that drives the market. After Trump denied firing Powell, gold rose fast and fell fast. So we can't chase long gold too much. First, the sustainability of the news-driven market needs to be examined, and second, the certainty of Trump's news is still unreliable. He always denies himself the next day.
After the gold price retreated quickly, a long upper shadow appeared in the candlestick chart, indicating that the upper resistance should not be underestimated. Therefore, we should not rush to buy gold. We can still consider shorting gold in the 3355-3365 area. We should first focus on the area around 3340. If gold falls below this area during the retreat, gold will return to the short trend and test the area around 3320 again, or even fall below this area after multiple tests and continue to the 3310-3300 area.

Gold fluctuated downward. Stuck in a stalemate.Information summary:
Global investors have experienced the longest night this year. There are reports that Trump has drafted a letter to fire Federal Reserve Chairman Powell. The incident triggered a strong reaction in the financial market. An hour later, Trump came out to clarify that "there is no plan to take any action" and denied drafting a letter to fire Powell.
Due to the impact of the incident, gold experienced a roller coaster market, soaring more than $50 at one time, hitting a three-week high of $3,377.17, and then narrowed its gains to 0.68%, and finally closed at $3,347.38. In today's Asian market, gold fell slightly and is currently hovering around $3,325.
Market analysis:
The current volatility pattern has not changed. In the short term, the market shows signs of weakness, which is also affected by CPI data, and expectations for interest rate cuts have weakened. In the current state where there is no break in the pattern, waiting and watching is still the best strategy.
The first support level is around 3,310, which is the starting point of last week's high. The second is around 3280, which is the historical low since July and also the starting point of the rise in the first week of July.
XAU/USD Chart Analysis: Volatility at a Yearly LowXAU/USD Chart Analysis: Volatility at a Yearly Low
The daily chart of XAU/USD shows that the Average Directional Index (ADX) has reached its lowest level since the beginning of 2025, indicating a significant decline in gold price volatility.
Yesterday’s release of the US Producer Price Index (PPI) initially triggered a sharp spike in gold prices, but the gains were short-lived, with the price quickly reverting to previous levels. This price action aligns with a broader market narrative of equilibrium—where supply and demand are in relative balance, and the market appears to be efficiently pricing in key influencing factors, including geopolitical tensions and tariff-related developments.
However, this fragile balance may soon be disrupted.
Technical Analysis of XAU/USD
From a broader technical perspective, gold remains within a long-term ascending channel (highlighted in blue) in 2025. Key observations include:
→ Attempts to rebound from the lower boundary of the channel (marked with arrows) lack conviction. Bulls are not capitalising on these opportunities to reignite the uptrend, suggesting a potential exhaustion of buying interest.
→ A trendline drawn across the major highs of 2025 has proven to be a strong resistance level. All recent breakout attempts have failed at this barrier.
As a result, the XAU/USD chart is showing signs of forming a large-scale triangle pattern, with its axis centred around the $3,333 level. If bulls continue to falter in extending the multi-month rally, it could encourage bears to challenge the lower boundary of the ascending channel, increasing the risk of a downside breakout.
This article represents the opinion of the Companies operating under the FXOpen brand only. It is not to be construed as an offer, solicitation, or recommendation with respect to products and services provided by the Companies operating under the FXOpen brand, nor is it to be considered financial advice.

The firing of Powell set off the market, don't chase the longsTrump showed a draft of the letter to fire Powell, but whether Powell will be fired in the end remains to be seen, but the impact on the gold market is undoubtedly huge. The wolves have now smelled a very dangerous scent. Don’t chase high prices. Don’t chase high prices! ! ! After all, the impact of the news comes and goes quickly, and there is a high possibility of a reversal later in the evening. The final suppression position of the current gold daily line is 3340. If the closing line today can maintain above 3340, then gold will usher in a real bullish trend in the future.
OANDA:XAUUSD
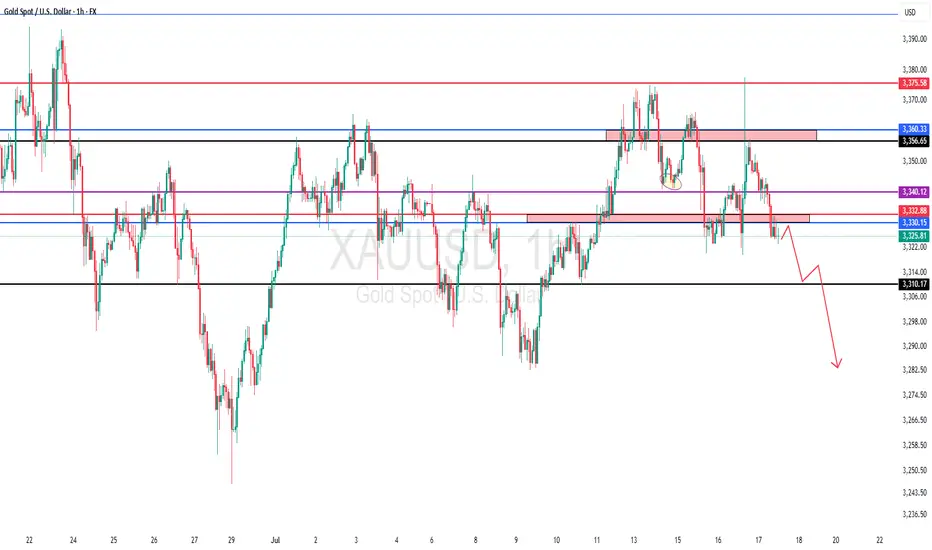
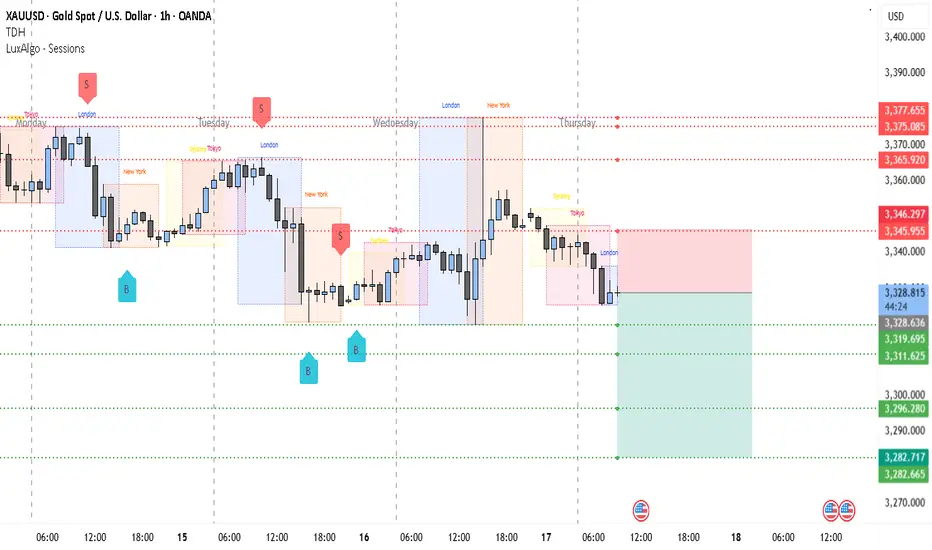
Gold Slips in London – $3,296 Incoming?📉 XAUUSD 1H Bearish Analysis – July 17, 2025
Gold (XAUUSD) is showing clear signs of bearish momentum on the 1-hour chart. After forming a local high around the $3,346–$3,347 region, price was sharply rejected and has since maintained a lower high structure. This rejection came right after the London session began, confirming that institutional volume is likely favoring the downside for now.
The previous few sessions show multiple failed attempts to break above the $3,346–$3,365 range. Sellers are consistently stepping in near those zones, marking a strong supply area. Meanwhile, recent candles have broken below the intraday support around $3,327.74, showing bearish continuation is underway.
Session activity is also in favor of the bears. The current London session opened weak, following a failure to hold above the previous session highs. Typically, gold experiences volatility during London and New York overlaps, and given the current structure, the pressure seems tilted to the downside.
From a broader perspective, the lower highs and lower lows on the 1-hour chart confirm a short-term downtrend. Price is now hovering just above $3,319 support—if this level is taken out cleanly with volume, it opens the path to deeper targets.
________________________________________
📌 Trading Setup (Short Bias)
• Entry: $3,327.74 (breakdown zone)
• Stop-loss: $3,346.29 (above last supply rejection)
• Take-Profit 1: $3,319.69
• Take-Profit 2: $3,311.62
• Take-Profit 3: $3,296.28
• Take-Profit 4 (extended): $3,282.66
________________________________________
If price manages to hold below $3,328 with consecutive rejections on any pullback, this bearish thesis remains valid. A breakdown below $3,311 would likely trigger momentum-driven selling toward $3,296 and potentially $3,282. However, any 1H close back above $3,346 would invalidate the current setup and favor a temporary bullish retracement.
GOLD Intraday Chart Update For 17 July 2025Hello Traders, welcome to new Trading day
Today we have some high impact news of USD, Currently market is still in tight range and we still need breakout of 3300 Psychological for downside clearly
For upside market must need to close above 3380-90 zone for further upwards continuation
currently we are also keep an eyes on WAR Fundamental news
Disclaimer: Forex is Risky

XAUUSD BUY IDEAOn the H4 we have a clear unmitigated fvg+KL just blow a valid level as inducement which price might come to raid.
There has been series of military attack between iseal and Syria and also Fed cutting the rate will also be a key factor

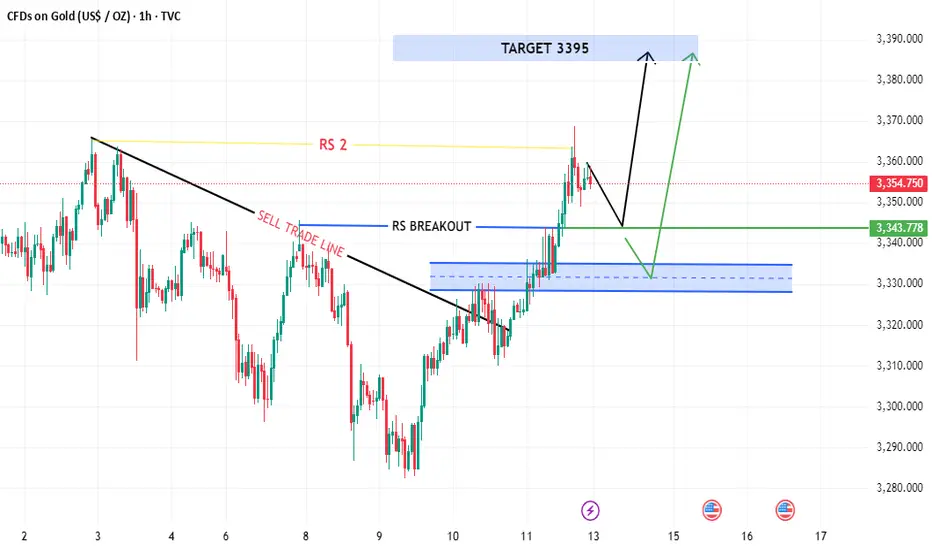
XAUUSD NEXT MOVE (READ CAPTION)Hi trader's. what do you think about gold market
current price : 3354
gold Friday breakout sell trade and gold breakout resistance 3345 and close above 3345 and gold just retest downside then he taking support and pump upside gold breakout 3365 then gold next move 3395
support zone: 3343:3330
resistance zone :3365
target 3395
stop loss: 3310
please like comment and follow thank you
The latest gold trend analysis and strategic suggestionsYesterday, the price of gold showed a range of fluctuations. The long and short sides fought fiercely but failed to break through the existing range. The overall trend direction is still unclear. From a fundamental point of view, the market is still dominated by risk aversion, which makes it difficult for the price of gold to form a clear trend reversal. However, it should be noted that the main funds may take extreme suppression measures in the future to force the price of gold to fall. From the 4-hour chart, gold has been under pressure near the upper track 3377 and continued to fall. Yesterday, it broke through the middle track support and touched the lower track. The current price is temporarily supported near the lower track, but the overall trend still shows a wide range of fluctuations and has not formed an obvious trend. The short-term strength of the US dollar suppresses the upward movement of gold, but the key support and resistance levels have not been effectively broken; in terms of intraday short-term operation suggestions, the current callback near 3320-3325 can try to do ultra-short-term longs. It is recommended to stop profit and exit in the 3340-3345 range. It can be combined with the K-line pattern to short-sell, and the target is the lower track area. If the downward momentum is strong, it may fall below yesterday’s low to form a continuous decline.
Operation suggestions:
1. Go long when gold falls back to around 3320-3325, stop loss at 3312, target at 3340-3345.

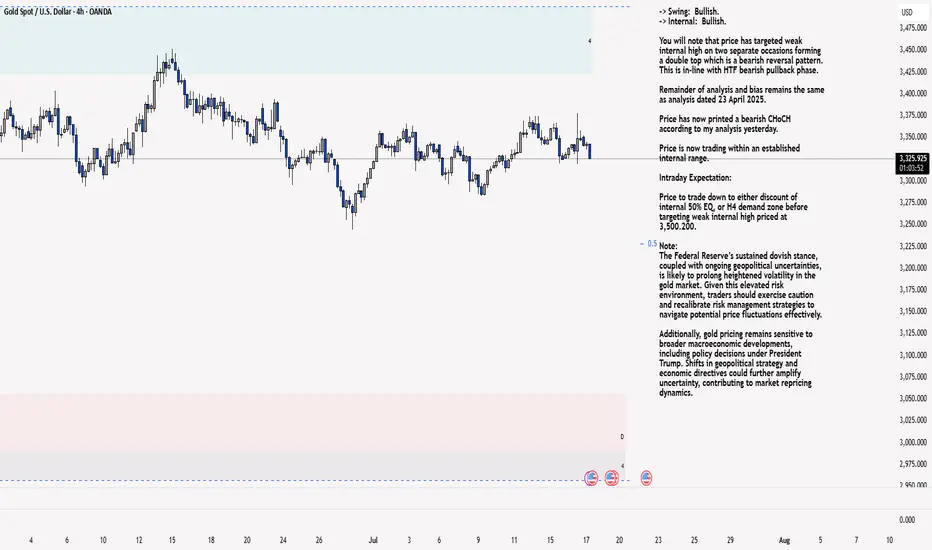
XAU/USD 17 July 2025 Intraday AnalysisH4 Analysis:
-> Swing: Bullish.
-> Internal: Bullish.
You will note that price has targeted weak internal high on two separate occasions forming a double top which is a bearish reversal pattern. This is in-line with HTF bearish pullback phase.
Remainder of analysis and bias remains the same as analysis dated 23 April 2025.
Price has now printed a bearish CHoCH according to my analysis yesterday.
Price is now trading within an established internal range.
Intraday Expectation:
Price to trade down to either discount of internal 50% EQ, or H4 demand zone before targeting weak internal high priced at 3,500.200.
Note:
The Federal Reserve’s sustained dovish stance, coupled with ongoing geopolitical uncertainties, is likely to prolong heightened volatility in the gold market. Given this elevated risk environment, traders should exercise caution and recalibrate risk management strategies to navigate potential price fluctuations effectively.
Additionally, gold pricing remains sensitive to broader macroeconomic developments, including policy decisions under President Trump. Shifts in geopolitical strategy and economic directives could further amplify uncertainty, contributing to market repricing dynamics.
H4 Chart:
M15 Analysis:
-> Swing: Bullish.
-> Internal: Bullish.
H4 Timeframe - Price has failed to target weak internal high, therefore, it would not be unrealistic if price printed a bearish iBOS.
The remainder of my analysis shall remain the same as analysis dated 13 June 2025, apart from target price.
As per my analysis dated 22 May 2025 whereby I mentioned price can be seen to be reacting at discount of 50% EQ on H4 timeframe, therefore, it is a viable alternative that price could potentially print a bullish iBOS on M15 timeframe despite internal structure being bearish.
Price has printed a bullish iBOS followed by a bearish CHoCH, which indicates, but does not confirm, bearish pullback phase initiation. I will however continue to monitor, with respect to depth of pullback.
Intraday Expectation:
Price to continue bearish, react at either M15 supply zone, or discount of 50% internal EQ before targeting weak internal high priced at 3,451.375.
Note:
Gold remains highly volatile amid the Federal Reserve's continued dovish stance, persistent and escalating geopolitical uncertainties. Traders should implement robust risk management strategies and remain vigilant, as price swings may become more pronounced in this elevated volatility environment.
Additionally, President Trump’s recent tariff announcements are expected to further amplify market turbulence, potentially triggering sharp price fluctuations and whipsaws.
M15 Chart: