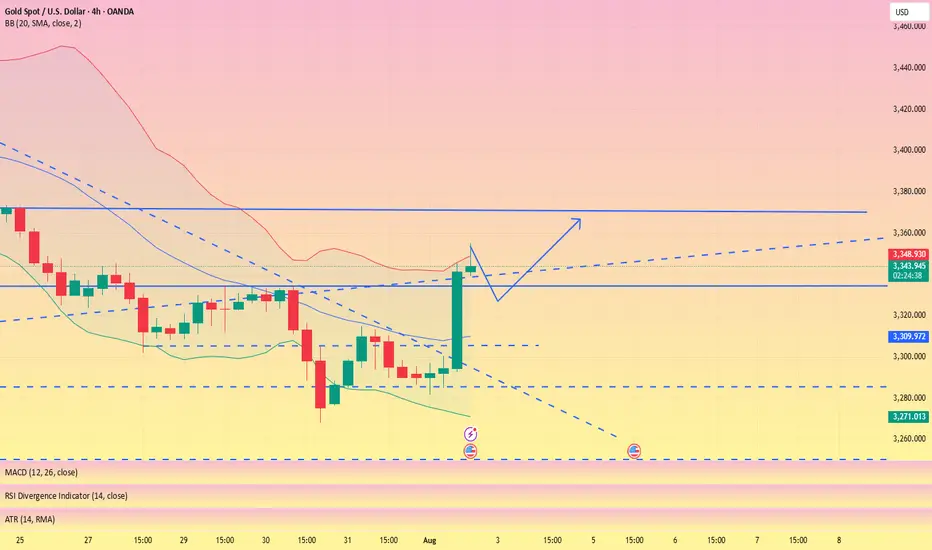
NFP data is positive, the bullish trend remains unchanged#XAUUSD
The current market, influenced by data such as NFP, remains bullish, even briefly pushing towards the 4H upper limit of 3350, reaching a high near 3354.📈
In the short term, gold still has upward momentum and could even reach the previous high resistance level near 3375.🐂
Currently, gold is undergoing a technical correction and needs to begin a pullback to accumulate more bullish momentum, giving traders who previously missed the opportunity to get on board.🚀
As resistance continues to rise, support below will also rise. 📊If gold retreats below 3335-3315, consider going long.📈
🚀 SELL 3335-3315
🚀 TP 3350-3375
Xauusdanalysis
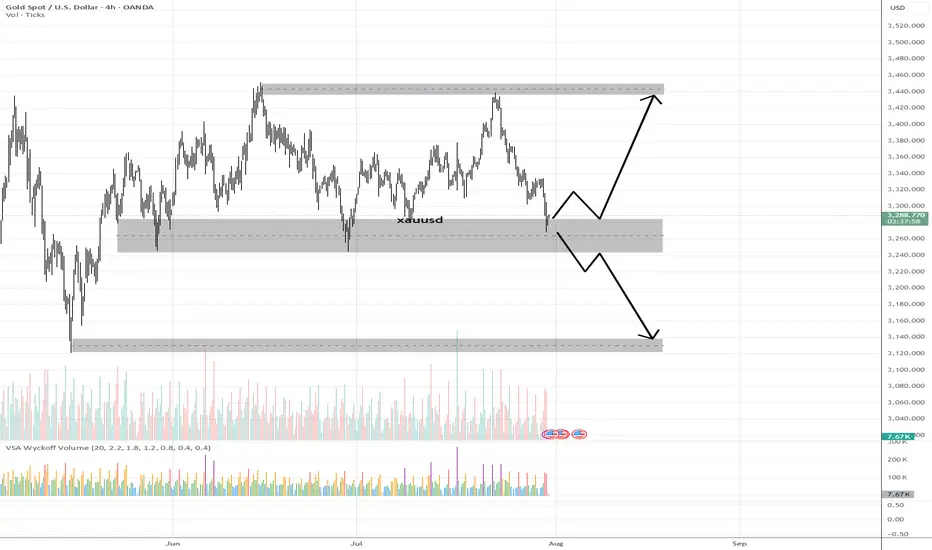
XAUUSD – Demand Zone Reaction & Potential Markup (VSA Analysis)💡 Idea:
Gold is testing a major 4H demand zone with early signs of smart money accumulation. VSA signals show supply exhaustion and potential for a bullish reversal toward upper resistance.
📍 Trade Setup:
Entry Zone: 3,265 – 3,285 (current demand zone)
Target 1: 3,380 – 3,400 (mid supply zone)
Target 2: 3,440 – 3,460 (major supply zone)
Stop Loss: Below 3,240 (to avoid false breakouts)
R:R Potential: ~3:1
📊 Technical Reasoning (VSA)
Stopping Volume Detected
On the recent drop into the demand zone, a wide spread down-bar on ultra-high volume appeared, followed by no further downside progress.
This is a classic stopping volume pattern where professional money absorbs selling pressure.
No Supply Confirmation
Subsequent candles inside the zone show narrow spreads on decreasing volume, indicating a lack of genuine selling interest.
Demand vs Supply Shift
Multiple attempts to break below 3,265 have failed, showing absorption of supply and positioning for markup.
If price rallies from here on increasing volume and wider spreads up, it would confirm demand dominance.
Structure Context
This demand zone has historically produced strong rallies.
Break above the minor resistance inside the zone could trigger a swift move toward Target 1, with momentum possibly extending to Target 2.
📌 Trading Plan:
Look for bullish confirmation bars with high volume before entry.
If price breaks below 3,240 on high volume, invalidate the long setup and watch for the next demand level around 3,140.
Partial profits can be taken at Target 1, and the remainder trailed toward Target 2.
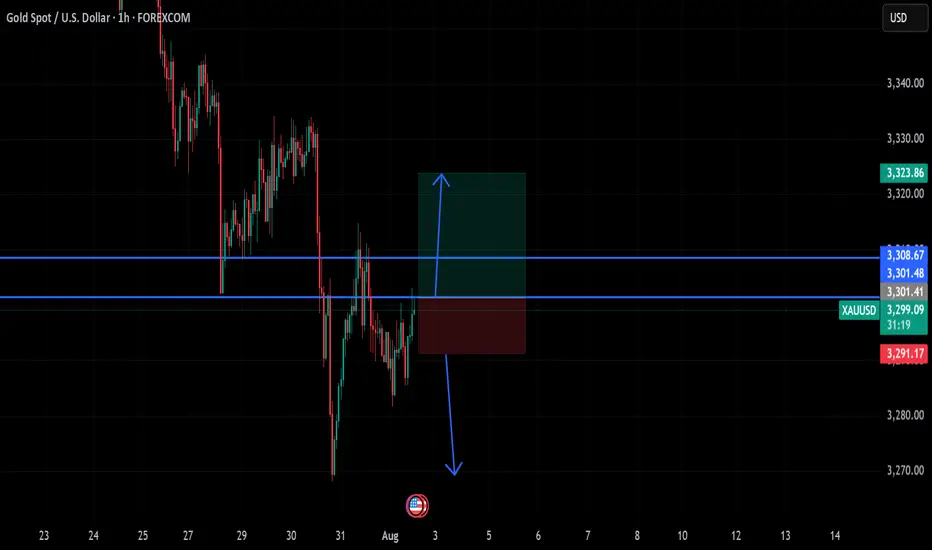
gold on third pattern breakout#XAUUSD have multiple test the third pattern, now price forming needs to breakout the 3308 before any further movement.
Buy entry 3301.4, TP 3308-3323.
Below 3291 holds a very strong bearish continuation, if breakout price will fall till 3269
XAU/USD 01 August 2025 Intraday AnalysisH4 Analysis:
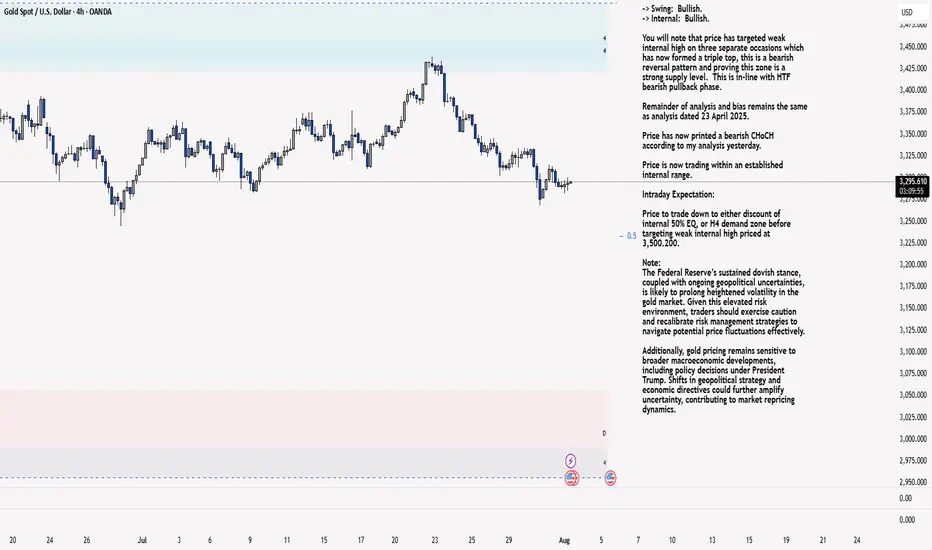
-> Swing: Bullish.
-> Internal: Bullish.
You will note that price has targeted weak internal high on three separate occasions which has now formed a triple top, this is a bearish reversal pattern and proving this zone is a strong supply level. This is in-line with HTF bearish pullback phase.
Remainder of analysis and bias remains the same as analysis dated 23 April 2025.
Price has now printed a bearish CHoCH according to my analysis yesterday.
Price is now trading within an established internal range.
Intraday Expectation:
Price to trade down to either discount of internal 50% EQ, or H4 demand zone before targeting weak internal high priced at 3,500.200.
Note:
The Federal Reserve’s sustained dovish stance, coupled with ongoing geopolitical uncertainties, is likely to prolong heightened volatility in the gold market. Given this elevated risk environment, traders should exercise caution and recalibrate risk management strategies to navigate potential price fluctuations effectively.
Additionally, gold pricing remains sensitive to broader macroeconomic developments, including policy decisions under President Trump. Shifts in geopolitical strategy and economic directives could further amplify uncertainty, contributing to market repricing dynamics.
H4 Chart:
M15 Analysis:
-> Swing: Bullish.
-> Internal: Bullish.
H4 Timeframe - Price has failed to target weak internal high, therefore, it would not be unrealistic if price printed a bearish iBOS.
The remainder of my analysis shall remain the same as analysis dated 13 June 2025, apart from target price.
As per my analysis dated 22 May 2025 whereby I mentioned price can be seen to be reacting at discount of 50% EQ on H4 timeframe, therefore, it is a viable alternative that price could potentially print a bullish iBOS on M15 timeframe despite internal structure being bearish.
Price has printed a bullish iBOS followed by a bearish CHoCH, which indicates, but does not confirm, bearish pullback phase initiation. I will however continue to monitor, with respect to depth of pullback.
Intraday Expectation:
Price to continue bearish, react at either M15 supply zone, or discount of 50% internal EQ before targeting weak internal high priced at 3,451.375.
Note:
Gold remains highly volatile amid the Federal Reserve's continued dovish stance, persistent and escalating geopolitical uncertainties. Traders should implement robust risk management strategies and remain vigilant, as price swings may become more pronounced in this elevated volatility environment.
Additionally, President Trump’s recent tariff announcements are expected to further amplify market turbulence, potentially triggering sharp price fluctuations and whipsaws.
M15 Chart:
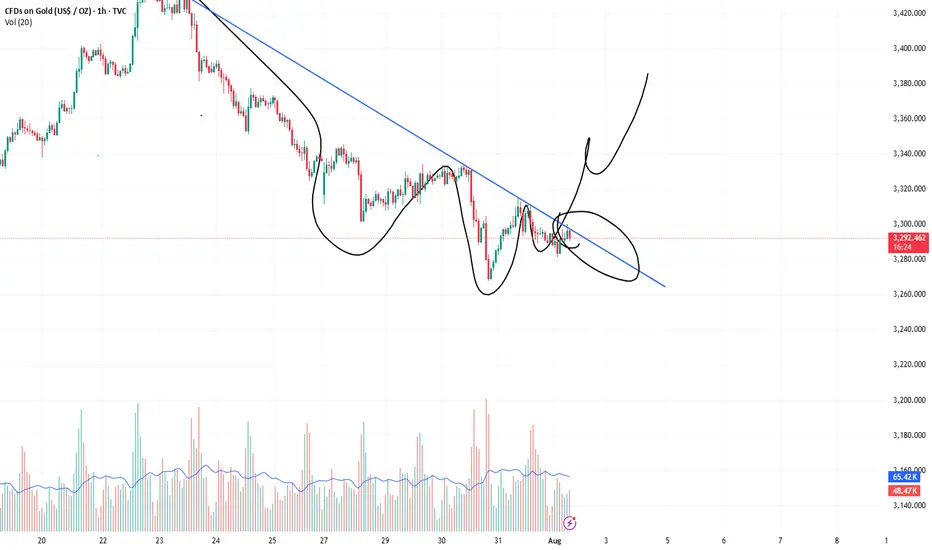
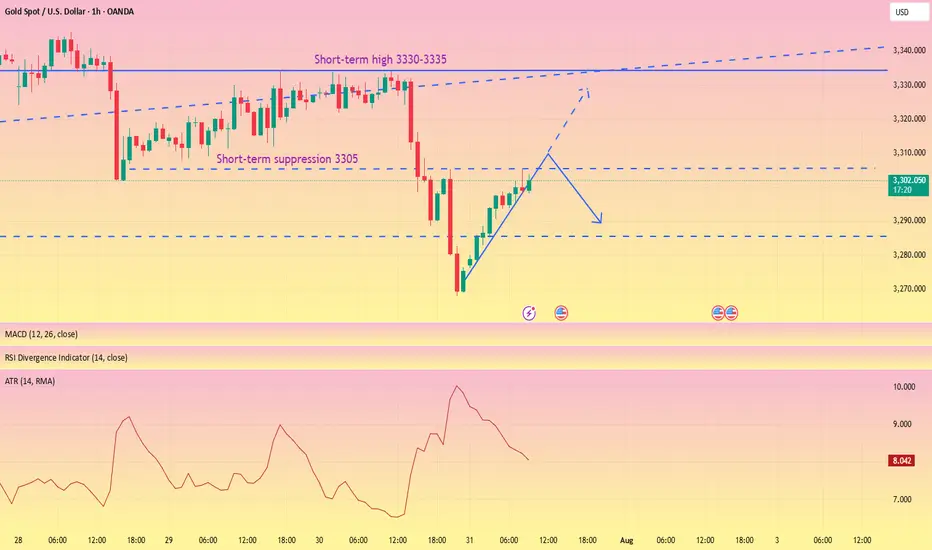
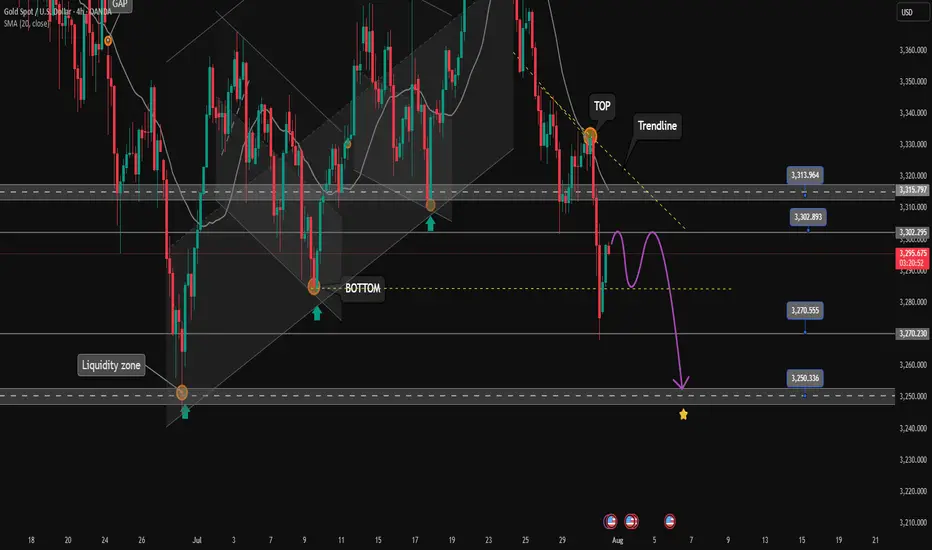
Bounce From Final Liquidity or Start of a Bullish Move? Bounce From Final Liquidity or Start of a Bullish Move?
After the FOMC event, gold completed a sweep of the final liquidity zone at 3269–3271 and rebounded strongly, in line with the broader bullish trend. The price has now recovered sharply and is gradually returning to the liquidity zones left behind after yesterday’s sharp drop.
📍 At the moment, gold is reacting around 3295, which aligns with a CP (Compression Point) Zone on the M30 chart. We're seeing a slight pullback here, and another retracement could occur before a strong upward continuation — potentially breaking out of the descending trendline that’s formed over recent days.
📊 Trading Plan & Key Levels
✅ BUY ZONE – Trend Continuation Setup
Entry: 3286–3284
Stop Loss: 3278
Take Profits:
3290 → 3294 → 3298 → 3304 → 3308 → 3312 → 3316 → 3320 → 3330 → …
💡 This is a prime area to look for re-entries into the dominant bullish move. Price action left a clean liquidity zone below after the aggressive upside reaction — ideal for riding the next wave.
❌ SELL ZONE – Only Valid Below VPOC
Entry: 3328–3330 (Volume Point of Control)
Stop Loss: 3335
Take Profits:
3324 → 3320 → 3315 → 3310 → 3305 → 3300
🔻 This is a high-probability short only if price stays below 3330. If gold closes above this VPOC region, the structure shifts to bullish and we should look for sells higher up — around 335x–337x zones.
📅 Monthly Candle Close – Watch for Indecision
As it’s the last trading day of the month, note that the past two monthly candles have printed doji-like wicks, signalling indecision and liquidity grabs. The market is still waiting for a clearer signal from the Fed on the first potential rate cut of the year.
🚫 Avoid emotional trading. This is a highly reactive environment, so careful risk management is key.
🧭 Final Thoughts
Gold continues to respect market structure and liquidity theory. The first major test lies at the 3313 resistance level — if broken, it opens the door to stronger bullish momentum toward the broader VPOC zone.
⏳ Be patient and only act when price confirms your bias.

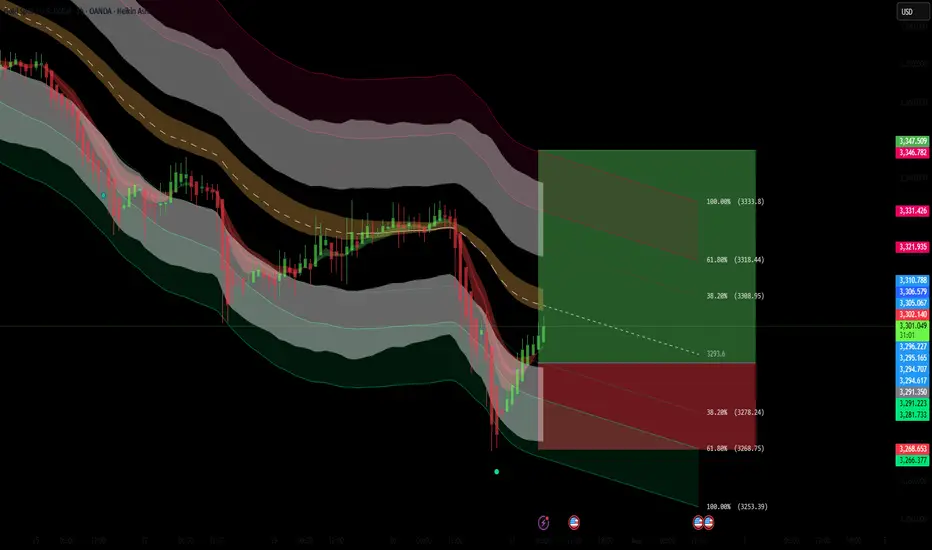
XAUUSD Long Setup – 1HGold (XAUUSD) has shown strong bullish rejection from the lower volatility band after a sharp selloff. The appearance of a Heikin Ashi reversal candle, suggests a short-term reversal is forming. Price has reclaimed key structure and is now targeting a reversion back to the mean, supported by Fibonacci retracement levels.
Entry: 3293.55
Target Zone: 3308.91 → 3333.76 (Fib 38.2% – 100%)
Stop Loss: 3253.35
Confluences:
✅ Bullish engulfing + Heikin Ashi trend shift
✅ Oversold bounce from lower channel extremity
✅ Fib retracement aligns with key structural resistance zones
✅ Custom signal confirmation (green dot)
✅ Clean R:R toward upper band and previous POI
Short-term counter-trend long targeting liquidity grab and mean reversion toward the 3308–3333 zone. Risk tightly managed with SL below local swing low.
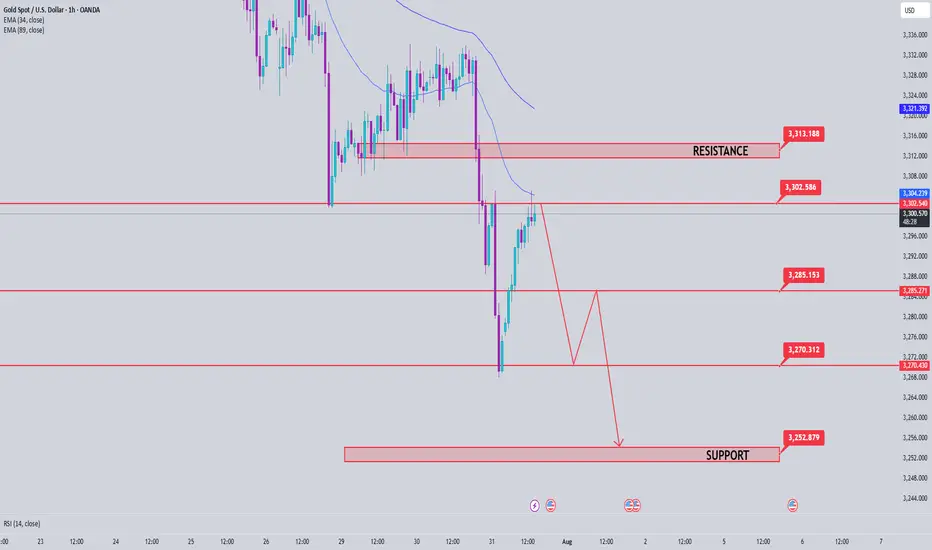
XAUUSD ultra-short-term sell trade.The hourly chart still shows a downward trend. Short-term downward pressure will continue. If you want to trade in the London market, consider selling at high levels and pursuing short-term trend trading.
3300-3295 SELL
TP3285-3280
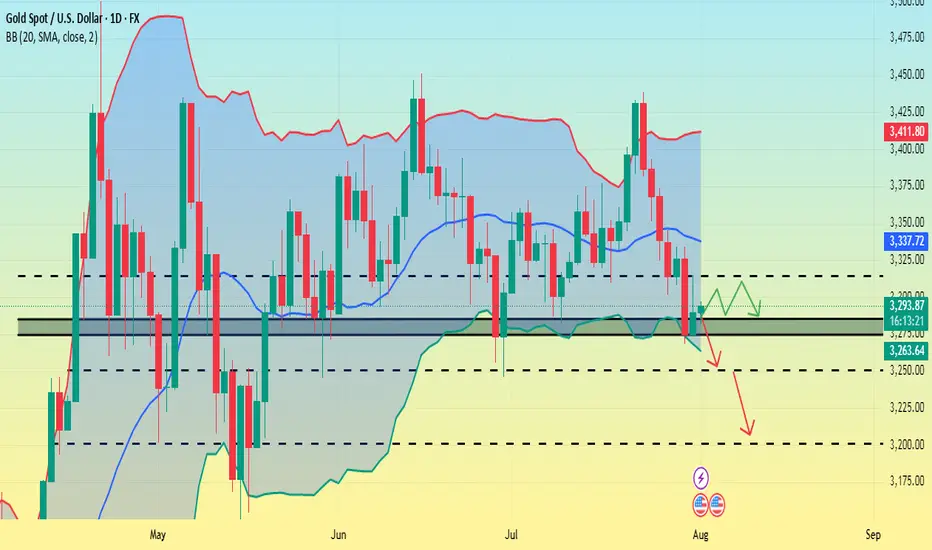
How to maintain stable operations before NFP dataYesterday, gold closed the month with a long upper shadow doji candlestick, indicating strong upward pressure, with monthly resistance at 3439-3451. Today marks the beginning of the month, and with the release of numerous data indicators such as NFP, unemployment benefits, and PMI, there is considerable uncertainty, so intraday trading should proceed with caution.
Judging from the daily chart, the current MACD indicator is dead cross with large volume, and the smart indicator is running oversold, indicating a low-level fluctuation trend during the day. At present, we need to pay attention to the SMA60 moving average and the daily middle track corresponding to 3327-3337 on the upper side, and pay attention to the intraday low around 3280 on the lower side. The lows of the previous two days at 3275-3268 cannot be ignored. There is a possibility that the low-level oscillation will touch the previous low again.
From the 4H chart, technical indicators are currently flat, with no significant short-term fluctuations expected. Low-level volatility is expected to persist within the day. Then just focus on the support near 3275 below and the middle track pressure near 3307 above. Looking at the hourly chart, gold is currently oscillating below the mid-range band, with resistance at 3295-3307 to watch in the short term.
Overall, the market is expected to remain volatile before the release of today's data. Based on Wednesday's ADP data, this round of data is also expected to be around $100,000. The contrast between ADP and NFP last time deserves our caution. The current market is basically optimistic about the short-selling situation, which is exactly what I am most worried about. If the gold price can stabilize above 3,300 before the NY data, the possibility of NFP data being bullish cannot be ruled out.
Intraday European trading suggestion: if the current gold price falls back to 3285-3280 and stabilizes, you can consider short-term long positions, with the target at 3295-3305. If the gold price tests the low of 3275-3268 again and does not break through, you can consider a second chance to go long. After making a profit of $10-20, you can consider exiting the market with profits. The market is volatile and unstable, so be sure to bring SL with you and pay close attention to the impact of the NFP data. Conservative investors can enter the market after the data is released.
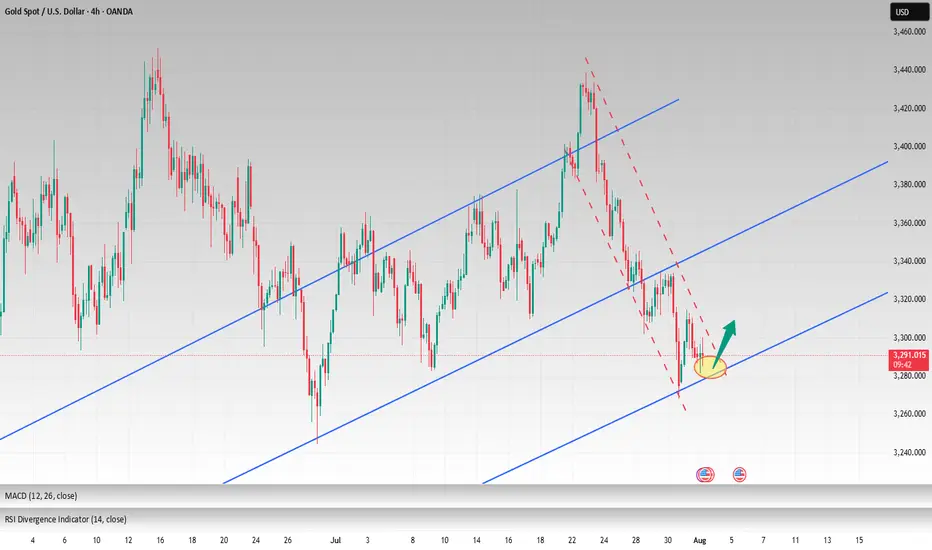
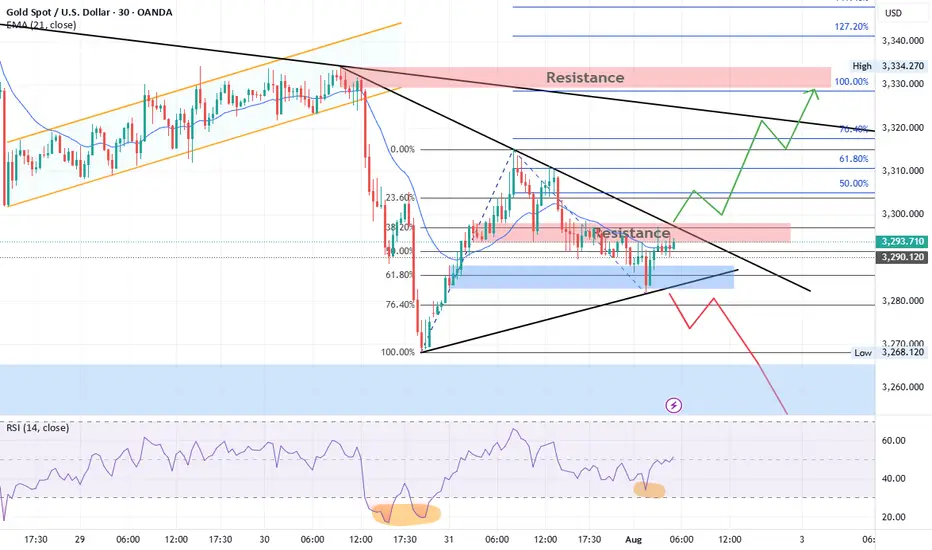
Gold Technical Outlook
Gold is currently consolidating inside a triangle pattern. After a recent bullish rally, price retraced between the 61.8% – 76.4% Fibonacci levels, finding support and bouncing upward. At present, gold is facing resistance at both the falling trendline and the 3298–3300 zone.
Bullish Scenario:
A breakout above the resistance trendline and the 3298–3300 zone could trigger a strong bullish move toward 3311, 3322, and 3333. A sustained break above 3333 would confirm a short-term bullish trend, opening the way for higher targets at 3360 and 3400.
Bearish Scenario:
If price faces rejection from the 3300 resistance and the falling trendline, gold is expected to move lower, retesting 3270. A decisive break below 3270 may extend the decline toward 3250. If 3250 is broken, gold could enter strong bearish momentum, potentially shifting the long-term trend to the downside with targets at 3000 and 2850.
OANDA:XAUUSD Gold Technical Outlook
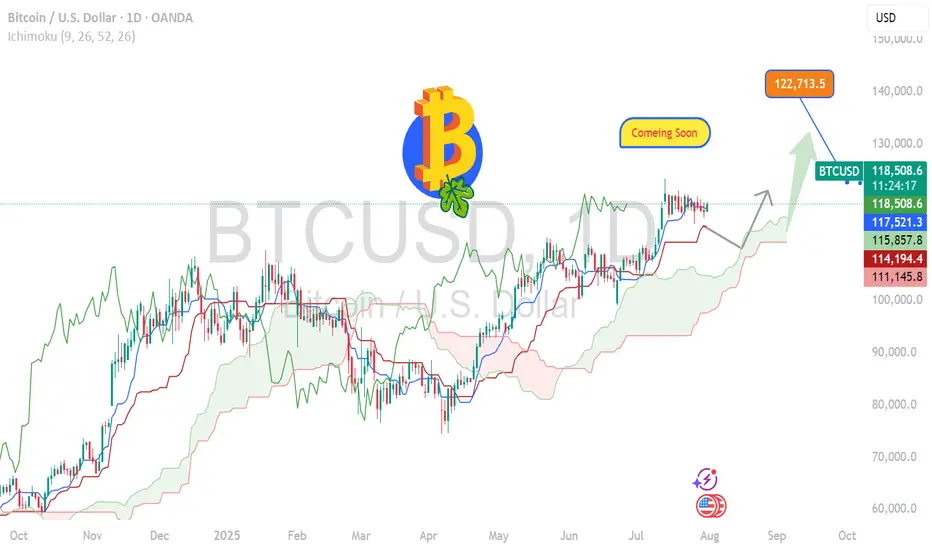
BITCOIN- Charging Towards 122k Momentum Building BTC/USD Long Setup – Targeting 122K 🔥
Bitcoin is holding strong above 118500, signaling bullish momentum.
✅ Price broke key resistance & forming higher lows.
🟢 Current structure favors buy-side continuation with next major target at 122000.
Support Zones:
🔹 117800 – intraday bullish retest
🔹 116500 – strong demand zone
Resistance Ahead:
🔸 120200 – short-term reaction
🔸 122000 – major target
🚀 Expecting bullish wave continuation.
If momentum sustains above 118K, 122K breakout highly probable!
#BTC #Bitcoin #CryptoSetup #BTCUSD #CryptoTrading #BTC122K #ChartAnalysis #BullishBreakout
XAUUSD Intraday Technical Analysis – Bullish Breakout SetupGold (XAUUSD) is showing signs of bullish recovery after a sharp sell-off, with current price action around 3305.86 USD hinting at a potential breakout on the 1-hour timeframe.
- Technical Overview
Price structure: After a steep decline, gold formed a base near the 3284–3299 zone and is now climbing back, with a potential inverse head-and-shoulders formation taking shape.
EMA cluster: Price is approaching the confluence of the EMA 50, EMA 100, and EMA 200, currently acting as dynamic resistance around 3309–3323. A break above these levels may confirm bullish strength.
Fibonacci retracement: The bounce appears from the 0.874 extension, indicating the end of the previous bearish leg.
Volume analysis: Increasing bullish volume supports the idea of a potential breakout.
- Key Levels to Watch
Zone Type
Price Level (USD)
Remarks
Immediate Resistance: 3,309 – 3,323 - Major test zone; overlaps with EMA 50/100
Major Resistance : 3,337 – 3,340 - Previous high; if broken confirms bullish continuation
Support Zone: 3,299 – 3,302 - Intraday support turned demand zone
Critical Support: 3,284 – 3,285 - Recent swing low; invalidates bullish view if broken
- Intraday Strategy Suggestion
Scenario 1 – Bullish Breakout
Entry: Buy on breakout and retest of 3,309–3,323
SL: Below 3,299
TP1: 3,337
TP2: 3,355
- Confirmation by strong bullish candle closing above EMA cluster and above resistance zone.
Scenario 2 – Buy on Pullback
Entry: Buy limit at 3,300–3,302
SL: Below 3,284
TP1: 3,323
TP2: 3,337
- Look for RSI divergence or bullish engulfing candle at support for higher conviction.
- Final Note
The bulls are attempting to reclaim momentum after a major correction. If gold can sustain above the 3,309 resistance and hold the 3,300 base, a short-term bullish reversal could materialize.

The rebound is weak, short orders intervene#XAUUSD
After two consecutive trading days of volatility, gold finally began to fall under pressure near 3335. After breaking through the 3300 mark, the price of gold accelerated its decline, reaching a low of around 3268, and yesterday's daily line closed with a large negative line. 📊
Today's rebound is more likely to be based on the buffering performance of the impact of news. The ATR data also shows that the bullish momentum is slowly weakening in the short term. 🐻After digesting the impact of yesterday's news through rebound during the day, it may fall again in the future.📉
📎The primary focus today is 3305 above, which was also the high point of yesterday's pullback correction. If the gold price rebounds to 3305-3320 and encounters resistance and pressure,📉 you can consider shorting and look towards 3290-3270.🎯
If the short-term gold rebound momentum is strong and breaks through the 3305-3320 resistance area, it will be necessary to stop loss in time. Gold may be expected to touch yesterday's high resistance of 3330-3335, which is the second point to consider shorting during the day.💡
🚀 SELL 3305-3320
🚀 TP 3290-3270
How to correctly grasp the gold trading opportunities?Yesterday, gold prices saw a technical rally amidst volatile trading, followed by a downward trend under pressure. Bulls strongly supported a rebound at 3280 in the Asian session. The European session saw an accelerated upward move, breaking through 3314 before retreating under pressure. We also precisely positioned short positions below 3315, achieving a perfect target of 3290-3295. During the US session, the market again faced pressure at 3311, weakening in a volatile trend before breaking through 3300. The daily chart ultimately closed with a medium-sized bullish candlestick pattern, followed by a pullback and then a decline.
Overall, after yesterday's rebound, gold prices remain under pressure at the key resistance level of 3314. The short-term bearish weakness line has moved down to this level. If pressure continues in this area in the short term, gold will maintain a weak and volatile structure, with intraday trading remaining focused on rebounds and upward moves. If you are currently experiencing confusion or unsatisfactory trading strategies, please feel free to discuss your options and help avoid investment pitfalls.
From a 4-hour analysis perspective, focus on resistance at 3305-3315 on the upside. A rebound to this level is a good opportunity to short against resistance. Focus on support at 3280-3270 on the downside. Unless the price stabilizes strongly, consider not entering long positions below this level. The overall strategy remains to short on rebounds, with the same rhythm. I will provide timely notifications of specific levels from the bottom, so keep an eye on them.
Gold Trading Strategy: Short on rebounds near 3305-3315, with targets at 3290-3280-3270.
Non-farm payrolls are coming. Will it trigger the market?On Thursday, the US dollar index briefly rallied after the Federal Reserve's favorite inflation indicator unexpectedly rebounded, crossing the 100 mark for the first time in two months. This marked the sixth consecutive trading day of gains and the first monthly gain since 2025.
Spot gold rebounded as risk aversion lingered amid uncertainty surrounding Trump's tariff deadline, reaching a high of around $3,315, but its intraday gains narrowed after the release of the PCE data.
The dollar has already firmly established itself above the 100 mark on the daily chart, so the next target is likely to be between 101.5 and 102.0. Currently, support levels on the daily chart are visible at 99.5 and 99.0.
The gold market is currently consolidating in the 3315-3275 range. However, if the dollar rises again, Quaid believes gold prices could fall below 3275.
On the daily chart, if it falls below 3275, the price would likely be around 3250. If 3250 falls below, the market could test 3200. However, the possibility of a consolidation between 3315 and 3275 remains undisputed.
Before the release of the non-farm payroll data, scalping within this consolidation range is advisable. However, the risk is relatively high, so please take profits in time.
Gold price analysis July 31XAUUSD – Bearish pressure still prevails, watch for SELL in the direction of the trend
Yesterday's session witnessed a strong decline when the D1 candle closed with selling pressure up to 60 prices, forming a key candle that shapes the trend. When the market forms a main candle, the 25% and 50% candle body areas are often important price areas to continue trading in the direction of the main trend.
In the current context, the priority strategy will be to sell in the direction of the downtrend when the price rebounds to the resistance areas and there is a rejection signal.
🔹 Important resistance areas:
3301 – 3312 – 3333
🔸 Target support areas:
3285 – 3270 – 3250
🎯 Trading strategy:
Prioritize SELLing at the resistance area of 3301–3312 when there is a price reaction (rejection).
Target: 3250
BUY only considered when 3313 area is broken decisively.
Staying disciplined and sticking to the reaction price zone will be key in the context of the market moving in a clear trend.
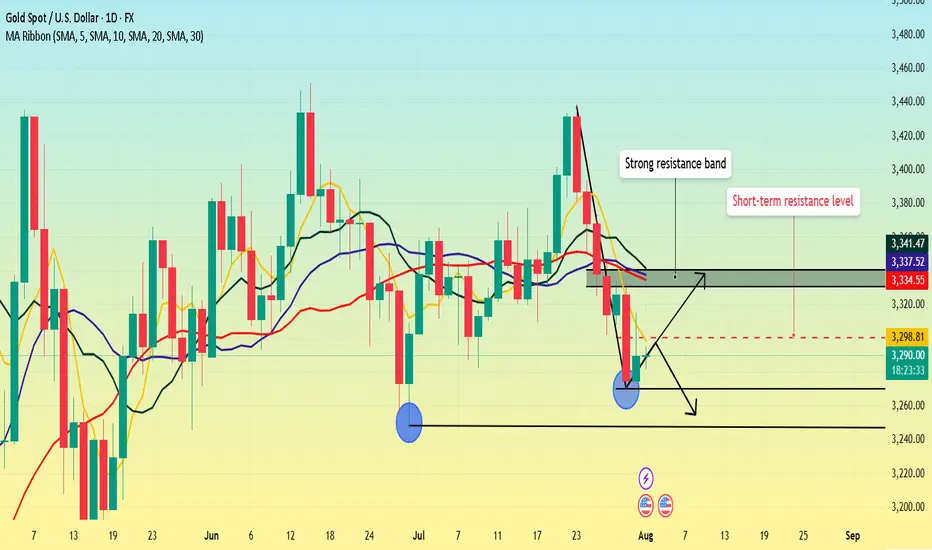
Non-farm payrolls are coming. What's the gold trend?Gold fell sharply on Wednesday, but Thursday's market didn't continue the downward trend as some investors expected. Instead, it showed a trend of rising and then falling.
From the daily perspective, we first need to focus on the resistance level near 3300 where the 5-day moving average is located. This position is not only a short-term technical resistance, but also reflects the market's psychological expectations to a certain extent. If prices can successfully break through this level and stabilize above it, it will indicate that bullish momentum is strengthening, potentially boosting market sentiment. At this point, the next resistance area to watch is the 3330-3340 range. This area converges the 10-day, 20-day and 30-day moving averages, forming a strong resistance band.
As for the support below, the primary focus is Wednesday's low of 3268. However, if this level is lost and the price continues to fall, the next support area will be around 3245, which is the previous low.
Trading strategy:
Short around 3300, stop loss at 3310, profit range 3280-3260.
Follow master candle for today's SELL strategy✏️ OANDA:XAUUSD has continued a strong downtrend. Yesterday's D1 candle closed with a 60-price decrease, forming a master candle that determines the market trend. With the market having a master candle, pay attention to the 25% or 50% candle zones to trade in the direction of the trend. Today's main trading strategy will be to SELL according to the master candle. The BUY strategy will only be implemented when the 3313 zone is broken.
📉 Key Levels
Support: 3285-3270-3250
Resistance: 3301-3312-3333
SELL Trigger. Rejection 3301, 3312
Target 3250
Leave your comments on the idea. I am happy to read your views.
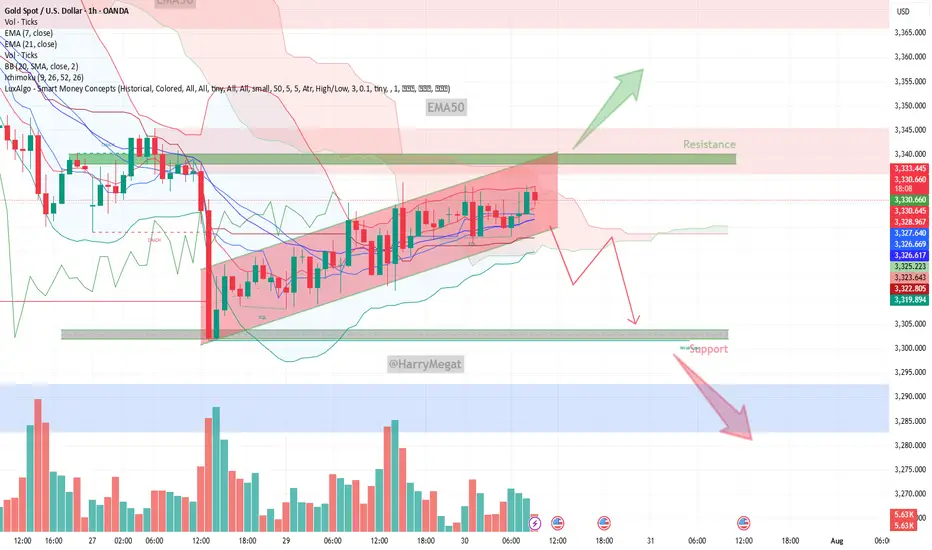
Gold (XAU/USD) on the 1‑hour timeframeGold (XAU/USD) on the 1‑hour timeframe
Chart Structure & Bias
* Price remains trapped in a **rising channel** (\~\$3,328–3,333), pressing against resistance near **\$3,340–3,345**.
* Short-term momentum is bearish: both EMA 7 and EMA 21 sit above current price, with declining volume signaling weakening buyer strength.
* Overall trend leans neutral‑to‑bearish until market clears key zones decisively.
Trade Scenarios
**Bearish Breakdown (Preferred)**
* **Trigger:** Break and close below channel support (\~\$3,326).
* **Targets:** Initial drop toward **\$3,320**, then **\$3,300**, and possibly lower if momentum intensifies.
* **Invalidation:** Price pushes back above **\$3,333–3,335**, negating bearish structure.
**Bullish Breakout (Conditional)**
* **Trigger:** Clean breakout and sustained close above **\$3,342–3,345**.
* **Targets:** Upward stretch toward **\$3,355–3,360**, and if strong, **\$3,367–3,375+**.
* **Invalidation:** Fails to hold structure—retesting from above back beneath **\~\$3,338**.
Macro Drivers & Market Conditions
* Caution prevails pre‑Fed decision and ADP / GDP releases—market awaits cues on interest rate direction.
* Safe‑haven demand has softened as global trade sentiment improves, while U.S. dollar strength continues to cap upside in gold.
* Analysts favor **sell‑on‑rise positioning**, bumping up potential for controlled pullbacks.
Verdict
Gold is consolidating in a tight upward channel, showing short-term bearish pressure. The **bearish breakdown scenario holds the edge** unless price convincingly clears above **\$3,345** on strong volume, which could flip bias. A confirmed break below **\$3,326** sets the stage for downward moves toward **\$3,300** or lower.
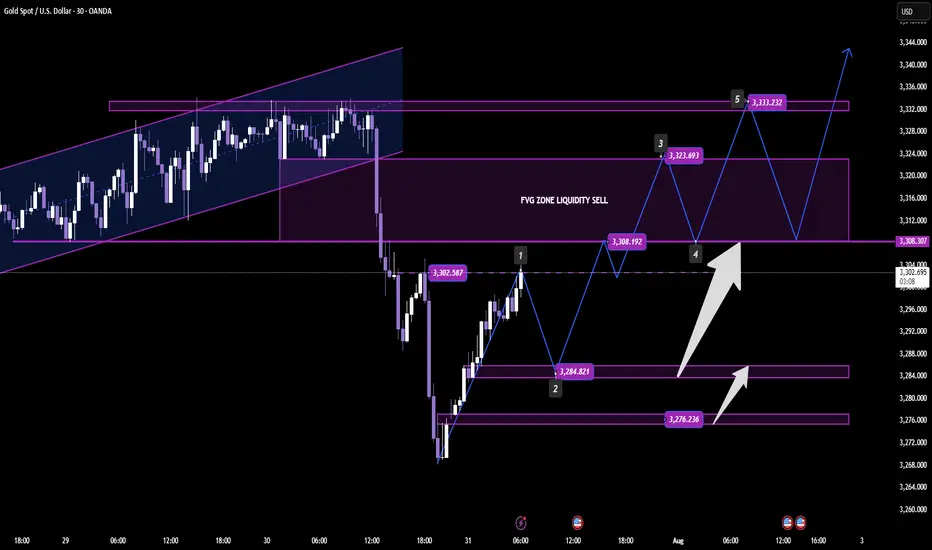
GOLD SETUP – BUY THE DIP OR SELL THE LIQUIDITY?Smart Money Playbook with Macroeconomic Context
📅 Date: July 31, 2025
🧠 Analyst: Clinton Scalper
🔍 Technical Breakdown (XAU/USD – H1/H4 Confluence)
Price is currently reacting within a key Fair Value Gap (FVG) zone and appears to be setting up a liquidity sweep on both sides before committing to a strong directional move.
🟢 BUY PLAN
Entry: 3,284
SL: 3,275
TP Targets:
▫️ TP1: 3,290
▫️ TP2: 3,300
▫️ TP3: 3,310
▫️ TP4: 3,320
▫️ TP5: 3,330
▫️ TP6: 3,340
▫️ TP7: 3,350
Key Support Zone: 3,276–3,284
→ Bullish OB + previous demand + potential BOS if price holds
🔴 SELL PLAN
Entry: 3,324
SL: 3,334
TP Targets:
▫️ TP1: 3,320
▫️ TP2: 3,310
▫️ TP3: 3,305
▫️ TP4: 3,300
Sell Zone: Inside FVG + liquidity inducement structure
→ Sell into imbalance after price fakes above recent swing highs
🔎 Smart Money Logic
Price is navigating a deep retracement inside a key FVG, targeting both sides of liquidity before trend continuation.
The BUY PLAN aligns with a classic "liquidity sweep → OB rejection → internal structure break".
The SELL PLAN is a short-term scalping idea inside the FVG liquidity zone, where institutional orders are often triggered before real bullish continuation.
🌍 Macroeconomic Context
US GDP data recently came in slightly below forecast → weaker USD outlook.
Gold demand remains supported due to:
Geopolitical risks (Ukraine, Taiwan tensions)
Market uncertainty over next Fed move (dovish bias increasing)
Real yields declining → bullish for precious metals
However, any hawkish Fed speak or sudden bond yield spikes can trigger intraday sell-offs into OB demand.
🎯 Trading Strategy Outlook
Buy if price sweeps below 3,284 and holds the demand zone. Target extended upside as macro supports gold.
Sell scalp at 3,324–3,330 zone if price shows rejection in FVG zone, but don’t overstay shorts.
⏳ Patience is key: Let price fill liquidity zones and follow smart money trail.
📌 Summary
🔸 Primary Bias: Bullish (Buy Plan favored due to macro + structure)
🔸 Secondary Bias: Bearish scalps from premium FVG
🔸 Watch for: USD volatility, yields, and institutional reaction in OB/FVG zones.
gold on buy retrace#XAUUSD price have reformed back above 3306, now we are expecting bullish from 3309 on 2 times breakout.
Entry 3309 2 times breakout, target 3326-3335, SL 3297.
Below 3297 holds bearish reversal, target 3270. 3317 will reject, H1 closure there will continue bullish.

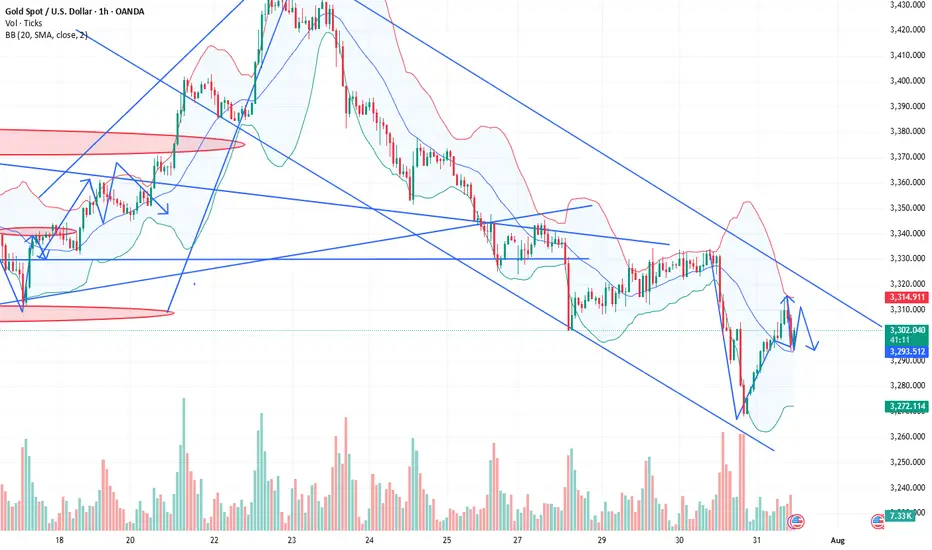
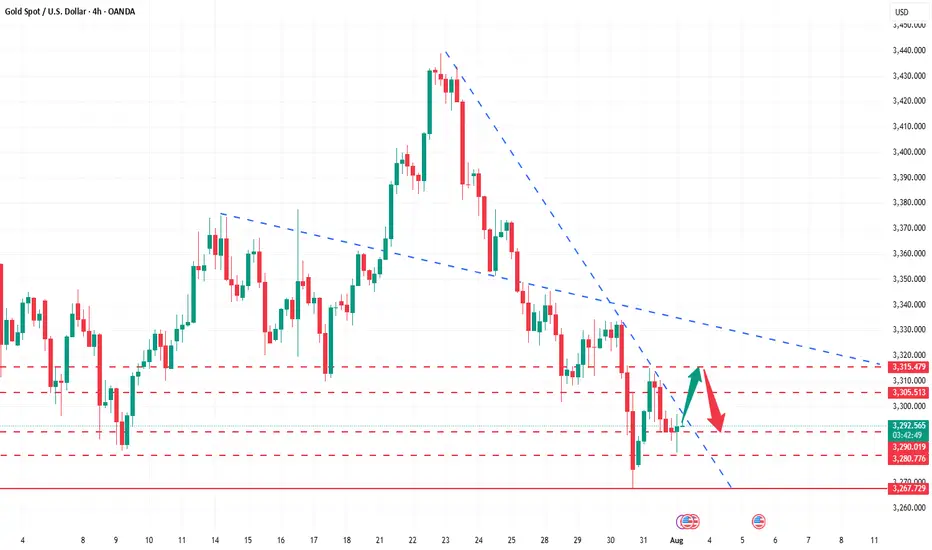
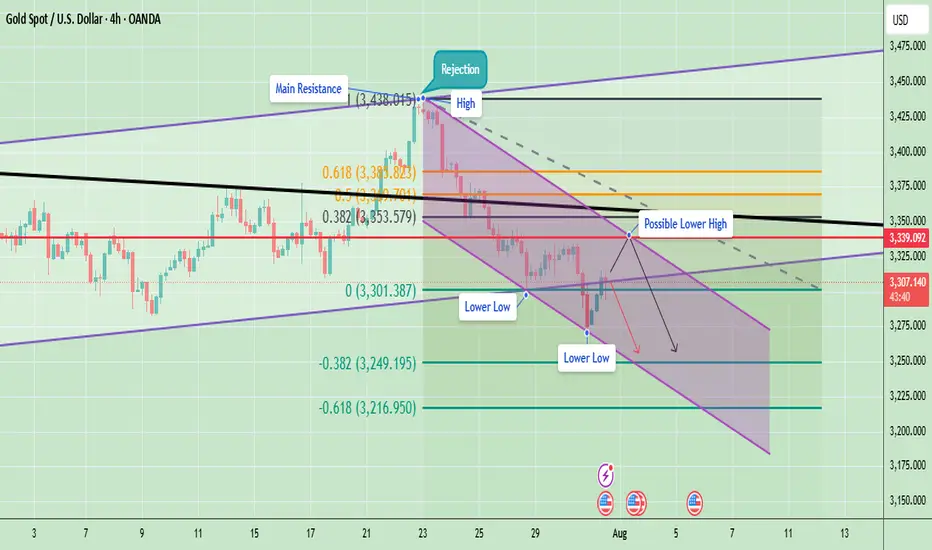
Gold Struggles at Resistance – Indicates Lower Lows AheadGold has been in a clear downtrend after facing a strong rejection around the 3,438 level (main resistance zone). Price is currently moving within a descending channel, confirming the formation of lower highs and lower lows – a classic bearish market structure.
Currently, Gold is trading near 3,306, facing resistance at 3,339 (marked as a possible lower high). If price fails to break above this level and sustain, there is a strong probability of continuation towards 3,249 and even 3,216.
Key Technical Highlights
- Immediate Resistance: 3,339 – 3,353
- Support Levels: 3,301 (short-term), 3,249, and 3,216
A rejection near 3,339 can lead to another leg down targeting 3,249 and 3,216. However, a strong breakout above 3,339–3,353 could temporarily shift momentum towards 3,394.
Note
Please risk management in trading is a Key so use your money accordingly. If you like the idea then please like and boost. Thank you and Good Luck!
Gold fluctuates. Is the decline halted?Information Summary:
Despite diminished market expectations for a September US rate cut, gold rebounded from a one-month low hit the previous session on Thursday, boosting its safe-haven appeal as newly announced US tariffs sparked new trade uncertainty.
So far, gold has risen 1.15%, hovering around $3,310, a gain of nearly $40 today. On Wednesday, gold prices hit their lowest point since June 30th: $3,267.79.
Market Analysis:
On the 4-hour chart, prices remain below the middle Bollinger Band, with a descending trendline defining the current bearish momentum. Prices rebounded after hitting this month's low on Wednesday. In the short term, watch for price rejection signals near the trendline. Upward pressure currently lies between $3,315 and $3,325, while support lies between $3,280 and $3,270.
Currently, prices are fluctuating upward. Quaid believes the bullish trend may continue. If the current resistance level is broken, it could reach the 3335 high before Wednesday's decline.
Trading strategy:
Go long near 3300, stop loss at 3290, profit range 3320-3330.

Short position profit. Latest strategyYesterday's gold price fluctuated: it maintained sideways fluctuations in the morning and started a downward channel after the opening of the US market. The Federal Reserve's interest rate decision remained unchanged. In addition, Powell's speech suppressed expectations of a September rate cut. The gold price directly fell to around 3267 and closed the day with a negative line, which exceeded expectations.
Looking back at recent trends, gold prices saw a brief correction on Tuesday after four consecutive days of decline, but failed to sustain the upward trend, falling sharply again yesterday, demonstrating that the weak market remains intact. Judging from today's market, theoretically there is still room for further decline, but before yesterday's low is broken, we don't expect a big drop for the time being; if the support here is effective, the market may tend to correct.
Pay attention to the daily resistance near 3315, and try shorting with a light position; the hourly resistance is near 3301, which is also a good position for shorting; the intraday bull-bear watershed is near 3294. If the market falls weakly and rebounds here, there may be a decline. The target below will first look at 3275. If yesterday's low of 3267 is broken, look further to 3250: On the long side, pay attention to the 3249 support below. If it is close to broken, you can try short-term buying.
【Operation ideas】👇
The bearish strategy in the morning remains unchanged. The short position at 3315 was publicly set up in the morning. The market rebounded to 3314 and then went down directly. The idea of setting up short positions at 3301 in the morning session remains unchanged. Friends who did not follow up with the short positions at 3315 can now add short positions with a light position at 3300.
PEPPERSTONE:XAUUSD ACTIVTRADES:GOLD VANTAGE:XAUUSD ACTIVTRADES:GOLD ICMARKETS:XAUUSD VELOCITY:GOLD PYTH:XAUUSD