Today's summary and tomorrow's market forecast📰 News information:
1. Focus on tomorrow's CPI data
2. Bowman's speech at the Federal Reserve
3. Tariff information outflows and countries' responses to tariff issues
📈 Technical Analysis:
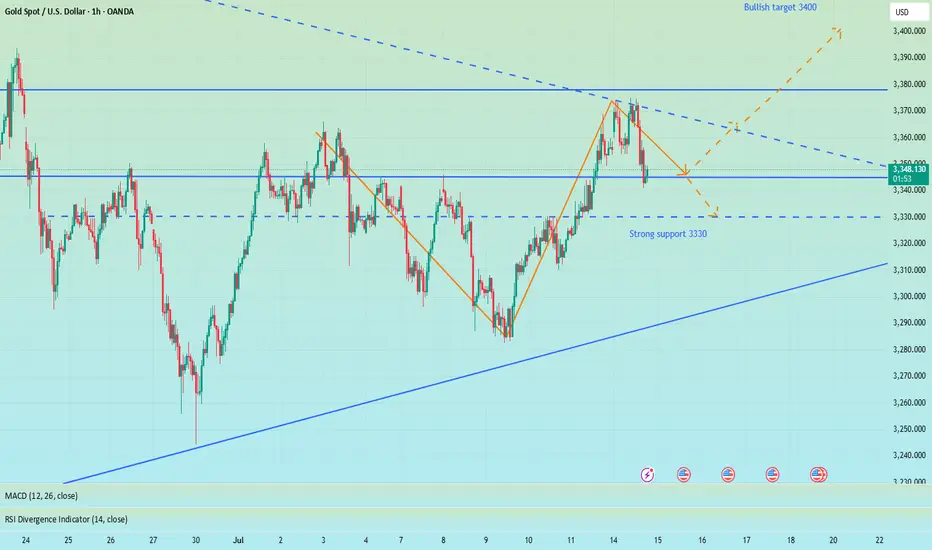
Bros, I had some things to deal with just now so I went out for a while. Now I come back to share my ideas. When the market is blindly chasing longs, I chose to give a bearish trading opportunity. I know that after I proposed the idea of shorting to test the support level of 3340-3330 below, many people were skeptical and even looked at it with a sarcastic attitude. After all, most people in the market are long. But facts and results have proved that only by following the trend can there be better room for operation. When doing transactions, you must first have a clear goal. Those who follow the crowd will often only blame their mistakes on others or luck.
Regarding the arrangements for future trading, first of all, 3375-3385 above is still an important short-term resistance. If today's closing is above 3360, then 3375 will most likely be tested again during the Asia-Europe trading session. Once it goes up again, it is very likely to break through the resistance area of 3375-3385. Before the US data, the price may stay at 3390 or 3400. On the contrary, if today's closing is below 3360, then the price still has room for adjustment. In this way, 3340 will not be the low point of this week. The bearish volatility in the Asian and European sessions will also test the strong support of 3330-3320.
In addition to investment, life also includes poetry, distant places, and Allen. Facing the market is actually facing yourself, correcting your shortcomings, facing your mistakes, and exercising strict self-discipline. I share free trading strategies and analysis ideas every day for reference by brothers. I hope my analysis can help you.
OANDA:XAUUSD PEPPERSTONE:XAUUSD FOREXCOM:XAUUSD FX:XAUUSD TVC:GOLD FXOPEN:XAUUSD
Xauusdanalysis
Gold OutlookGold took previous week high and gave bearish move. The gold overall scenario shows it is bullish. The possible move for the gold will be to touch FVG retrace and go towards supply zone and again retrace back. Or if buyers step in we may see good bullish move gold might touch supply zone retrace a little bit follow the bullish path.

XAUUSD Weekly Trade Setup(14-18th July 2025) - Bullish StrategyIn the ever-volatile world of commodities, Gold (XAUUSD) has yet again presented a promising technical setup. For traders looking to capitalize on price action and structure-based strategies, the upcoming week (14th to 18th July 2025) offers a clean breakout and retest opportunity backed by a strong risk/reward ratio.
Let’s break down the trade plan in detail.
1. Overview of the Current Market Structure
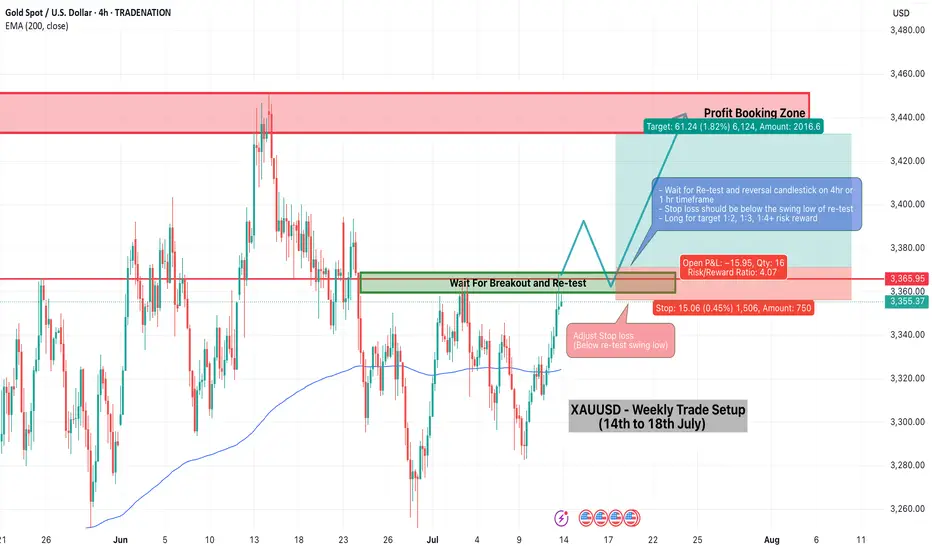
As shown in the 4-hour chart, XAUUSD is approaching a key horizontal resistance zone around 3360–3370. Historically, this area has acted as a rejection point for buyers. However, the recent bullish momentum, supported by price trading above the 200 EMA, suggests a potential breakout.
This forms the basis of a Breakout-Retest-Continuation strategy – one of the most reliable setups in price action trading.
2. The Trade Plan
Here’s the structured plan for this setup:
🔵 Step 1: Wait for the Breakout
Price must break above the resistance zone (3360–3370) with a strong bullish candle.
Avoid chasing the breakout; instead, let the market confirm its direction.
🟠 Step 2: Look for the Retest
After the breakout, wait for the price to pull back to the broken resistance, now acting as support.
Confirm this retest with a reversal candlestick pattern (e.g., bullish engulfing or hammer) on the 1H or 4H timeframe.
🔴 Step 3: Entry and Stop Loss
Enter the trade after the confirmation candle closes.
Place a stop loss below the swing low of the retest zone.
This protects the trade in case of a false breakout.
🟢 Step 4: Set Your Target
The profit booking zone lies around the 3440–3450 region.
This setup offers a Risk/Reward Ratio of 1:4, targeting 1:2, 1:3, and potentially 1:4 if momentum continues.
3. Why This Setup Makes Sense
EMA Confirmation: Price is trading above the 200 EMA, showing bullish bias.
Clean Price Action: Well-defined structure makes it easy to identify breakout/retest levels.
Strong Risk Management: The stop is tight and logical, while the upside potential is considerable.
Psychological Support Zone: 3360–3370 has repeatedly acted as a key decision level.
4. Trade Management Tips
Trail your stop loss once 1:2 R:R is achieved.
Consider partial profit booking at 1:2 or 1:3 to lock in gains and reduce risk.
Be patient – the key to this strategy is waiting for the retest confirmation.
5. Final Thoughts
Trading XAUUSD can be both rewarding and risky. This weekly setup gives you a disciplined approach to enter the market at a high-probability point with excellent reward potential. Whether you’re a swing trader or an intraday scalper on lower timeframes, this strategy adapts well with proper confirmation.
Stay tuned for live updates, and as always – plan your trade, and trade your plan.
Happy Trading!
=================================================================
Disclosure: I am part of Trade Nation's Influencer program and receive a monthly fee for using their TradingView charts in my analysis.
=================================================================
Gold Outlook – Monday Session BreakdownOn the Monthly timeframe, gold has shown a triple wick rejection, which continues to signal potential downside movement. After several failed attempts to break above the $3,400 level, we’ve begun to see a retracement take shape.
On the Daily chart, a Head and Shoulders pattern appears to be forming — further reinforcing the bearish narrative.
During Monday’s session, price action retested the upward trendline from Friday, before sharply reversing down to the $3,353 zone, where it consolidated and formed a neckline. During the London session, gold once again tested the trendline, met sharp resistance, and formed a double top. The neckline and ascending channel were then broken at $3,353 during the New York session.
At present, gold is trading between the two key neckline levels: $3,353 and $3,330.
• A break and close above $3,353 could signal renewed bullish sentiment, with targets at the $3,378 trendline and potentially the $3,402 resistance.
• A break and close below $3,330 would point to continued bearish momentum, with a downside target at $3,312.
CPI data is scheduled for tomorrow, which may bring increased volatility and key level breaks.
Key Levels to Watch:
• Resistance: $3,402, $3,378, $3,353
• Support: $3,330, $3,312, $3,300, $3,283
Trade Zones:
• Buy entries: $3,330 – $3,328
• Sell entries: $3,353 – $3,355
Stay sharp this week, and remember to manage your risk wisely — 1–2% per trade.
Let the market come to you — patience pays.

Gold surged higher but encountered resistance and pulled back.Spot gold edged higher, with the highest level reaching $3,374.71 per ounce, the highest since June 23. Over the weekend, Trump announced that a 30% tariff would be imposed on goods imported from the European Union starting from August 1, which further intensified market concerns about international trade and provided upward momentum for gold prices.
Gold prices rose 1% last Friday, closing at $3,357.39 per ounce, as investors turned to safe-haven assets after U.S. President Trump announced a series of tariff measures. Analysts said that the uncertainty premium has returned to the market again.
U.S. President Trump threatened on Saturday (July 12) to impose a 30% tariff on goods imported from Mexico and the European Union starting from August 1. Prior to this, he had engaged in weeks of negotiations with these two largest U.S. trading partners but failed to reach a comprehensive trade agreement. The escalation of the trade war has angered U.S. allies and unsettled investors.
It is worth noting that U.S. President Trump plans to make a "major announcement" on the Russia issue on Monday, which also requires attention from investors.
you are currently struggling with losses,or are unsure which of the numerous trading strategies to follow,You have the option to join our VIP program. I will assist you and provide you with accurate trading signals, enabling you to navigate the financial markets with greater confidence and potentially achieve optimal trading results.
Gold's Bullish Momentum: Trading Strategy for TodayTechnically, gold prices continued their strong bullish rally to break new highs last Friday 😎. During the Asian and European sessions, prices broke through the 3320 mark and extended their upward momentum with sustained strength 💹. In the afternoon European session, gold prices kept surging, breaking through and standing above the 3340 mark, accelerating the upward trend 🔥. In the evening US session, the price further accelerated its rally, piercing the 3369 level before pulling back and closing strongly 📈. The daily K-line closed as a fluctuating and high-breaking bullish candle 🌞. On the daily chart, there has been a strong bullish rally breaking new highs for three consecutive trading days, and the overall price has returned to the 3360 mark, re-entering a strong bullish one-sided pattern.
This morning, gold prices opened with a further gap higher, piercing the 3370 mark and continuing to fluctuate strongly 😜. Today's trend should focus on buying on dips 🙌. Although gold gapped up and surged for a while, the momentum is not strong. There must be a pullback for adjustment; otherwise, it will be difficult to maintain the upward momentum 🚶♂️.
From the 4-hour chart analysis, the short-term support below today should focus on the hourly neckline around 3340-45 📍, with key attention to the 3325-30 support level. During the day, we should continue to take the opportunity of pullbacks to go long as the main strategy 😏. The key dividing line for the short-term bullish strength is the 3325 mark. As long as the daily chart stabilizes above this level, we will continue to maintain the strategy of buying on dips to follow the bullish trend. Before breaking below this level, we will keep the strategy of buying on dips to follow the trend 💪
Accurate signals are updated every day 📈 If you encounter any problems during trading, these signals can serve as your reliable guide 🧭 Feel free to refer to them! I sincerely hope they'll be of great help to you 🌟 👇

Gold Bulls Are Back – Eyes on 3450 GOLD – Bulls Regain Control After Defending 3280
🟡 Last week was a dynamic one for Gold traders.
The week began with signs of an upside reversal, followed by a drop to test the 3280 support. That dip held—and from there, we saw a strong push higher, ending the week right at the top of the range.
📌 Friday’s close left behind a continuation Pin Bar on the weekly chart – a strong signal in favor of the bulls.
- This week started with a new local high at 3375,but we’re now seeing a pullback in the 3355 area at the time of writing.
What’s next?
Given last week’s price action, bulls seem to have won the battle and appear ready to challenge the 3400 level.
My plan for this week:
I’m looking to buy dips, and as long as nothing changes, my target is the 3450 zone.
Disclosure: I am part of TradeNation's Influencer program and receive a monthly fee for using their TradingView charts in my analyses and educational articles.

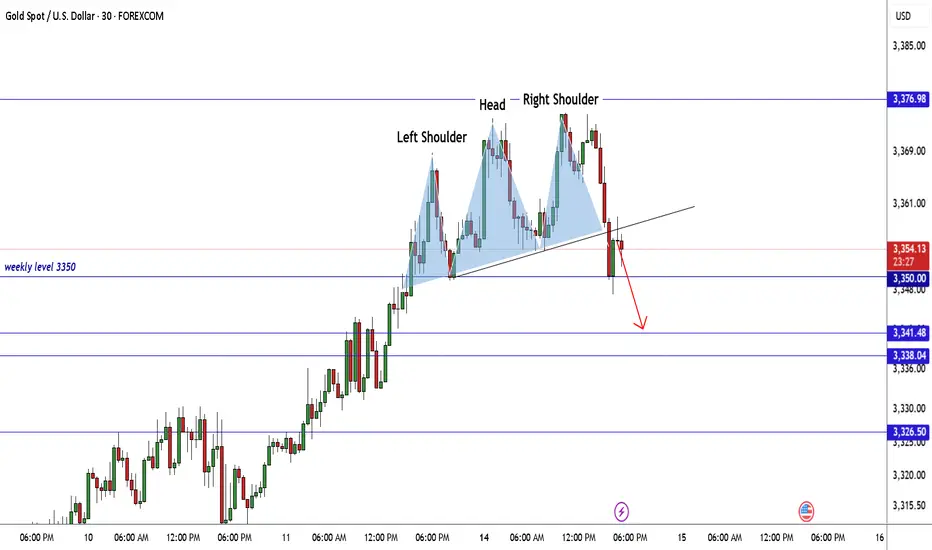
GOLD Made H&S Reversal Pattern , Scalping Short Setup Valid !Here is my GOLD 30 Mins Chart and if we checked the chart we will see that the price created a very good reversal pattern on 30 mins T.F , Head & shoulders reversal pattern and also it`s already confirmed by closure below neckline so the short is very clear now and we can targeting 100 to 150 pips , 3350.00 is a very good support also so we can see a price bounce from it to upside .
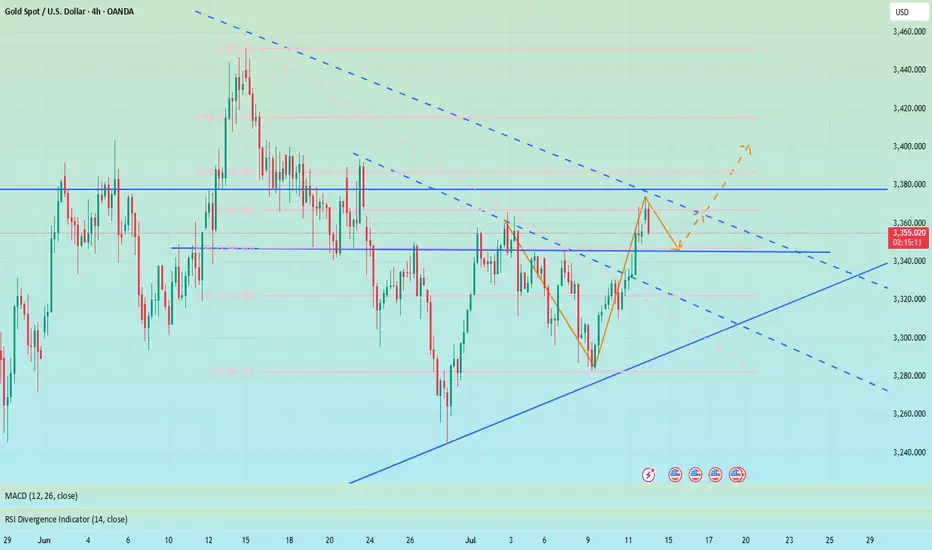
Good opportunity to wait for recovery and buy GoldOANDA:XAUUSD Confirmation of breaking Key level 3330 on Friday has formed an Uptrend in Gold. Reaction at GAP 3368 is obvious in an uptrend. Gold trend is favoring buying to 3388 and 3400 next week.
Support: 3345-3331
Resistance: 3387-3400
BUY Trigger: Retest and Reject support 3345
BUY Trigger: 3331 ( Strong support zone)
Target: 3400
SELL Trigger: rejection 3387 with bearish confirmation
Leave your comments on the idea. I am happy to read your views.

The market is bullish, but I am bearish. Don't regret it.📰 News information:
1. Focus on tomorrow's CPI data
2. Bowman's speech at the Federal Reserve
3. Tariff information outflows and countries' responses to tariff issues
📈 Technical Analysis:
This week, the US CPI data, consumer index, tariff issues and geopolitical situation are all key points to pay attention to. In the morning, both our long and short positions had good gains, making a good start to the week. The best way is to follow the trend and grab limited profits!
In the 4H cycle, the current trend shows a Zhendan upward pattern, and bulls still occupy the dominant low position in the short term. At the daily level, three consecutive positive days at the end of last week broke through the middle track, and the high point broke through the previous high, indicating that the short-term adjustment is over, and the rise in the market to test 3400 will be a high probability event. At present, the MACD daily line is bullish, the Bollinger Bands are flat, and the gold price is above the middle track. The bulls are strong, but there is still a need for a correction. Intraday trading focuses on the strength of the European session. If the European session is strong, the US session will continue to rise, and if the European session is weak, the US session will bottom out again. In the short term, if it touches 3370-3375 again, you can consider shorting and look towards 3365-3355 SL 3380.
🎯 Trading Points:
sell 3370-3375
tp 3365-3355-3345
In addition to investment, life also includes poetry, distant places, and Allen. Facing the market is actually facing yourself, correcting your shortcomings, facing your mistakes, and exercising strict self-discipline. I share free trading strategies and analysis ideas every day for reference by brothers. I hope my analysis can help you.
FXOPEN:XAUUSD TVC:GOLD FX:XAUUSD FOREXCOM:XAUUSD PEPPERSTONE:XAUUSD OANDA:XAUUSD
XAU/USD Weekly Update — July 14, 2025⌛Timeframe:
.
📆 Date: July 14, 2025
.
🎯 Weekly Bias: Mildly Bullish — elevated risk, cautious momentum
🔎 Market Overview:
🛡️ Safe‑haven demand surging:
Renewed 30% tariffs on EU, Mexico, Canada have pushed investors into gold, lifting prices to a 3-week high.
📉 Weak USD & inflation hedge:
A softer U.S. dollar, under pressure from dovish Fed speculation, continues to support gold. A predicted September rate cut further boosts gold’s appeal.
🏦 Central bank accumulation:
Q1 2025 saw record demand from central banks (≈244 tonnes), with many reallocating reserves toward gold for geopolitical and de-dollarization reasons.
📈 YTD performance standout:
Gold is up ~27% this year, leading other assets. Bullish technical indicators like tightening Bollinger Bands and sustained MACD support continuation.
🌀 Market Sentiment:
🔽 Exchange reserves continue dropping:
Indicative of increased HODLing and lower upcoming sell pressure.
🧠 Sentiment firmly bullish:
Analysts highlight risk‑off bias; gold remains favored amid trade tensions.
🤝 ETF inflows & institutional buying:
Strong flows through gold ETFs and central bank buying reflect ongoing structural support.
🔧 Technical Analysis:
📊 Weekly Movement: +1.9% weekly gain, now at $3,367.
✅ Key Levels:
🔻 Resistance: $3,374 → $3,400
🔺 Support: $3,350 → $3,331
🟢 Signals: Mild bearish RSI divergence hints at short-term pause
🟢 Weekly Bias: Mildly Bullish — momentum favored, but caution amid technical divergence.
.
.
.
⚠️ Risk Reminder: For educational purposes only — not financial advice. Utilize prudent risk management.
👍 If this update helps, hit like, comment your view, and follow for timely XAUUSD alerts!

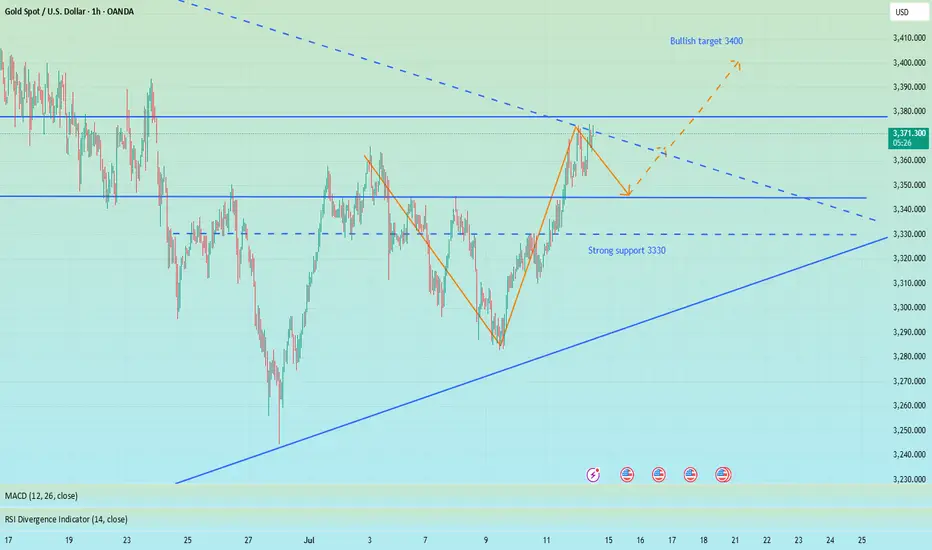
Beware of the market's trap of luring more investors, short 3335Regarding recent trading strategies, I believe you have also seen my trading win rate. I often inform the future trend of gold several hours or even days in advance, because my many years of trading experience have made me an excellent poisonous wolf in the trading market. Now I see a lot of bullish voices in the market, but my wolf’s sense of smell has discovered danger signals. In the short term, I think that without the influence of news, the market needs to digest the overbought momentum of the bulls. From the 4H chart, the middle track of the Bollinger Band is at 3332, which is very close to the strong support of 3330 given by us during the day. Therefore, I think that at least within 4 hours, gold will fall back to test the support below 3340-3330, or even 3320. Since most people want to follow the crowd, let them go. They will only fall into the trap set by the market. Let's prove with facts whether following the wolf pack will make you hungry or well fed.
OANDA:XAUUSD

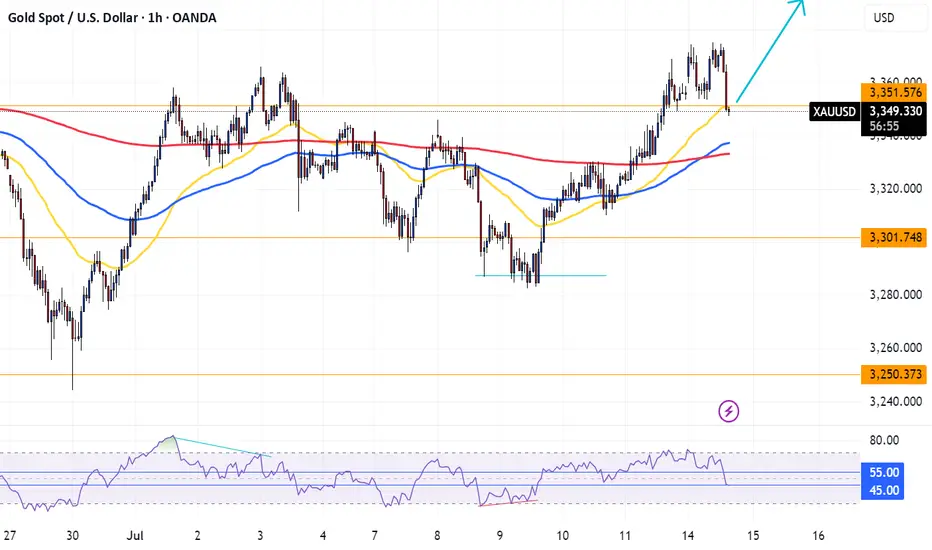
XAUUSD Long OpportunityXAUUSD is bullish per the 4 hour and 1 hour timeframe with continued bullish momentum coming out of the fundamentals around tariff uncertainty. There is clear bullish market structure.
XAUUSD is currently sitting on the pivot level of $3350 (Resistance turned support) after a retracement prior for the NY opening bell which gives rise for a long opportunity from this level towards the next Pivot point at $3391.
On the hour timeframe, price is trading above the 50 and 200 SMA and is currently sitting upon the 21 SMA which XAUUSD has used push point from in the past trending markets. RSI is currently sitting in a sweet spot region of the RSI between 45-55 indicating this is a valid retracement and price is looking to turn bullish again soon.
This provides 4 points of Bullish confluence within the momentum in favour of further bullish movements
7/14: Sell High, Buy Low Within the 3400–3343 Range for GoldGood morning, everyone!
At the end of last week, renewed trade tariff concerns reignited risk-off sentiment, prompting a strong rally in gold after multiple tests of the 3321 support level. The breakout was largely driven by fundamental news momentum.
On the daily (1D) chart, the price has fully reclaimed the MA60 and broken above the MA20, signaling an emerging bullish trend. The key focus for this week includes:
Monitoring whether MA20 holds as support on any pullbacks
Watching the 3400 resistance zone for signs of exhaustion or continuation
From a 30-minute technical perspective, gold is currently trading within a short-term resistance band of 3372–3378, with a stronger resistance zone between 3387–3392. Key support levels are:
Primary support: around 3358
Secondary support: 3343–3332 zone
Given the recent increase in volatility due to geopolitical and macroeconomic headlines, flexible intraday trading is recommended within the 3378–3343 range, while broader trades can be framed around the 3400–3325 zone, still favoring a sell-high, buy-low approach.
Lastly, as we move into the mid-year period, I may have more personal commitments, and strategy updates could be less frequent. I appreciate your understanding, and as always, feel free to leave a message if you have any questions or need trading guidance—I’ll respond as soon as I can.

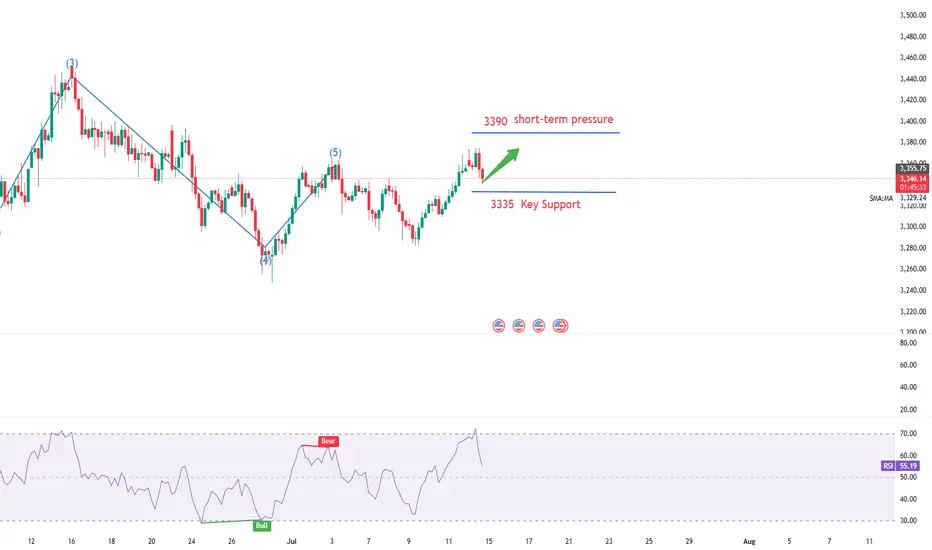
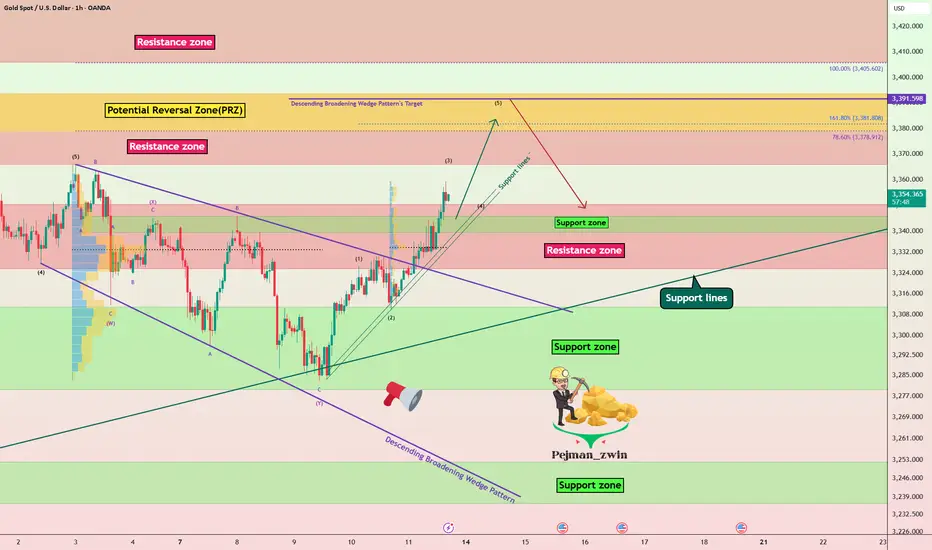
Gold Roadmap=>Short termGold ( OANDA:XAUUSD ) currently appears to have broken through the Resistance zone($3,350-$3,325) .
The Resistance zone($3,350-$3,325) was broken with the help of the Descending Broadening Wedge Pattern , the upper line of this classic pattern having served as an important resistance line for us in previous ideas .
In terms of Elliott wave theory , Gold has completed the Double Three Correction(WXY) within the Descending Broadening Wedge Pattern . It is currently completing the next five impulse waves . Wave 5 of these waves could end in the Potential Reversal Zone(PRZ) .
I expect Gold to rise to the Potential Reversal Zone(PRZ) , and of course, given the momentum of gold approaching PRZ , we can also look for Short positions in PRZ .
Note: Stop Loss (SL) = $3,329
Gold Analyze (XAUUSD), 1-hour time frame.
Be sure to follow the updated ideas.
Do not forget to put a Stop loss for your positions (For every position you want to open).
Please follow your strategy; this is just my idea, and I will gladly see your ideas in this post.
Please do not forget the ✅ ' like ' ✅ button 🙏😊 & Share it with your friends; thanks, and Trade safe.
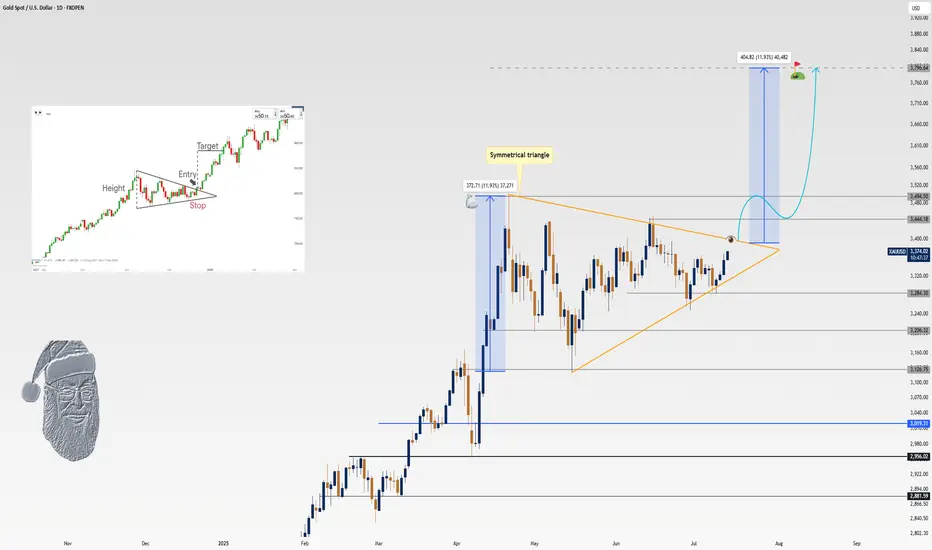
XAU/USD Update: Ready for a 12% Surge?Welcome back, traders, it’s Skeptic! 😎 Is XAU/USD about to explode or crash?
We’ve formed a symmetrical triangle pattern , and its breakout triggers could deliver solid profits for longs or shorts. Let’s dive into the details with the Daily timeframe to see the big picture.
✔️ Daily Timeframe: Our HWC is strongly bullish. After hitting $ 3,497.80 , we entered a secondary retracement phase, forming a symmetrical triangle. If we break resistance at $ 3,444.18 , my targets are the next ceiling at $ 3,494.50 and, long-term, $ 3,796.64 . But if we break support at $ 3,796.64 , it could signal a major trend change from uptrend to downtrend, opening shorts. Next supports are $ 3,206.32 and $ 3,019.31 —use these as your targets.
📊 Key Insight : Risk management is key to surviving financial markets. Stick to max 1%–2% risk per trade to stay safe.
📉 Market Context: Markets are predicting a major recession in the U.S. economy. If it happens, Gold will be the only safe-haven asset. So, I personally favor riding Gold’s uptrend.
This historic drop screams one thing: global markets are losing faith in U.S. monetary and fiscal policies, big time.
And that’s a loud wake-up call for investors: It’s time to bulletproof your portfolio. What’s that mean?
Your stocks, real estate, cash, bonds , you name it...
They’re slowly but surely turning to Gold .
💬 Let’s Talk!
Which Gold trigger are you eyeing? Hit the comments, and let’s crush it together! 😊 If this update lit your fire, smash that boost—it fuels my mission! ✌️
GOLD H2 Intraday Chart Update for 14 July 2025Hello Traders,
we have no major news today, But Tariff News remains agendas for now
All eyes on 3380-3400 zone breakout for further upside, only below 3350 GOLD will move towards 3330 level with continuation of 3310 level
Disclaimer: Forex is Risky

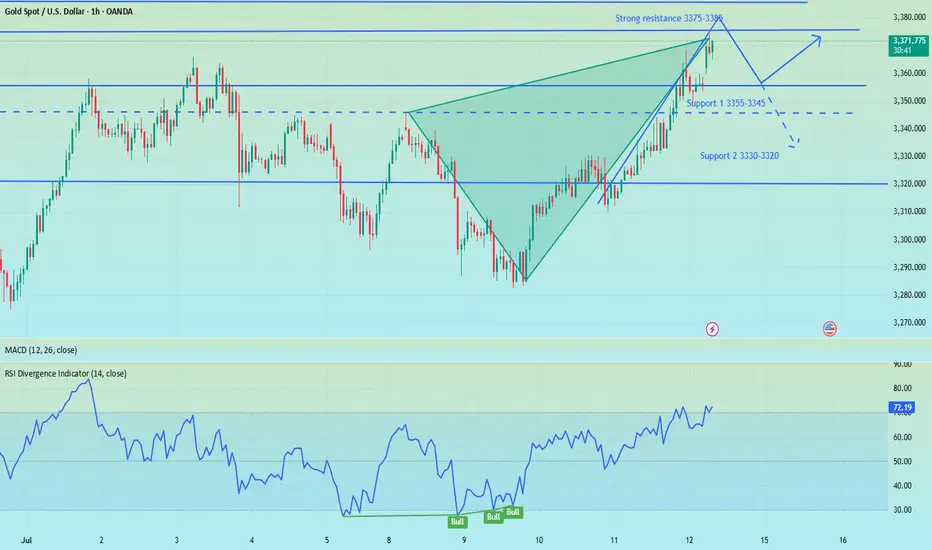
Gold breaks trendline towards 3390, Uptrend resumes✏️ OANDA:XAUUSD The price increase will continue today and will be even stronger. After breaking the trendline, gold has strong support. SELL strategies are only considered to find short-term reaction points waiting for the next trends.
Gold has confirmed the uptrend is back, heading to 3390 today.
📉 Key Levels
Support 3330-3314
Resistance 3345-3362-3388
Sell trigger: rejection from 3345 with bearish confirmation
Sell zone: 3362–3387 (Strong resistance)
BUY trigger: 3330-3314 support with bounce confirmation
Leave your comments on the idea. I am happy to read your views.
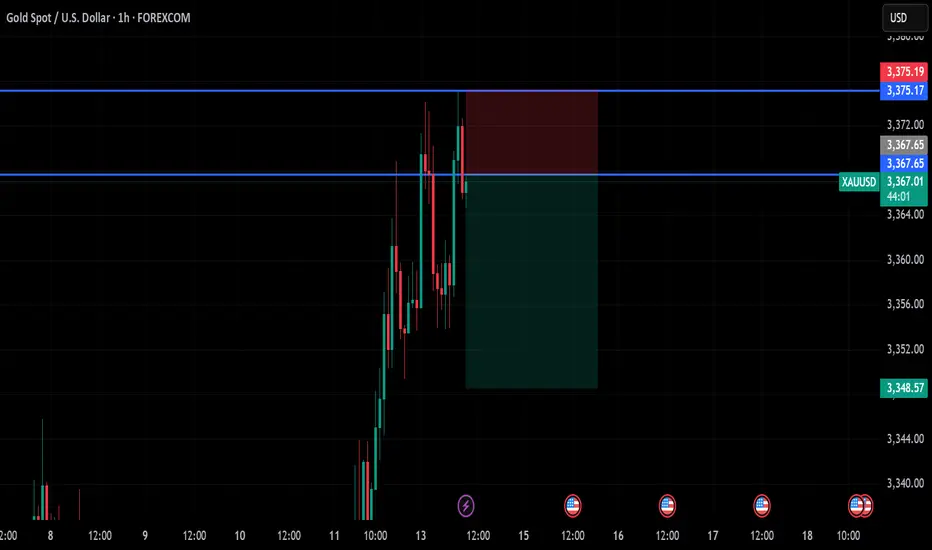
gold on sell reverse#XAUUSD needs reverse below last week support 3350, now entry at 3367.5.
Target 3350-3340, stop loss at 3375.19.
D1 TF still shows bullish continuation which can Target 3385-3390, expect entry above 3376
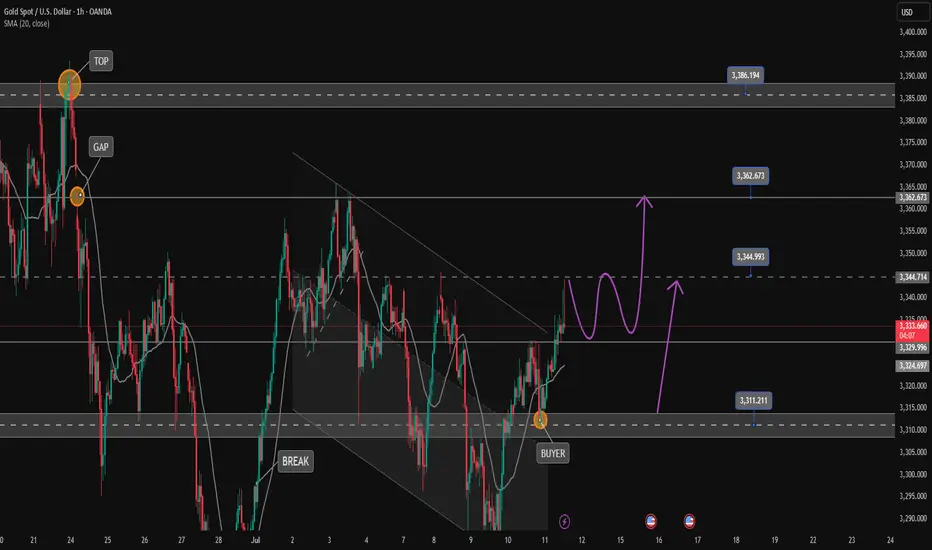
Gold gaps up and open higher,beware of going long at high levelsBros, the Asian session opened higher in the morning. Currently, gold is falling back to the SMA1O moving average. We will continue to be bullish after it falls back and stabilizes. At present, it has broken through the key resistance level of 3360. The daily line has shown a strong pattern of three consecutive positives. The gold price remains in the rising channel, and the bullish trend is obvious. As the gold price moves up, the short-term moving average moves up with it. At present, 3355-3345 constitutes an important support in the short term, and 3375-3385 above constitutes a short-term resistance area. Whether it can stand firmly above 3360 this week is the key.
Severe overbought in the short term, there are trading risks for long positions at high levels. Short-term operation suggestions for the Asian and European sessions: consider shorting when it touches 3365-3375, and stop loss when it breaks 3375. The target focuses on 3355-3345, and the breakout looks at 3330-3320. On the contrary, if it stabilizes at 3355-3345, you can consider going long.
Short position profit, focus on 3355-3345 support📰 News information:
1. Focus on tomorrow's CPI data
2. Bowman's speech at the Federal Reserve
3. Tariff information outflows and countries' responses to tariff issues
📈 Technical Analysis:
The short-term bears have successfully hit the TP to realize profits, and the trading strategy is still valid. Continue to pay attention to the 3355-3345 support during the day. If effective support is obtained here, you can consider going long. For the rebound, the first TP can focus on the 3365 line. If the gold price breaks through 3380 in the future, it will not be far from 3400. If it falls below, pay attention to the support of 3330-3320 below. It is expected that this is the limit position of short-term bearishness. The impact of tariffs is still there, and the bullish trend remains optimistic in the short term, unless Europe, Japan and other countries have a new solution to tariffs.
🎯 Trading Points:
BUY 3355-3345
TP 3365-3380-3400
In addition to investment, life also includes poetry, distant places, and Allen. Facing the market is actually facing yourself, correcting your shortcomings, facing your mistakes, and exercising strict self-discipline. I share free trading strategies and analysis ideas every day for reference by brothers. I hope my analysis can help you.
OANDA:XAUUSD PEPPERSTONE:XAUUSD FOREXCOM:XAUUSD FX:XAUUSD TVC:GOLD FXOPEN:XAUUSD
Market Analysis: Gold Climbs Higher Amid Market OptimismMarket Analysis: Gold Climbs Higher Amid Market Optimism
Gold price started a fresh increase above the $3,350 resistance level.
Important Takeaways for Gold Price Analysis Today
- The gold price started a fresh surge and traded above $3,330.
- A key bullish trend line is forming with support at $3,350 on the hourly chart of gold at FXOpen.
Gold Price Technical Analysis
On the hourly chart of Gold at FXOpen, the price formed a base near the $3,280 zone. The price started a steady increase above the $3,330 and $3,350 resistance levels.
There was a decent move above the 50-hour simple moving average and $3,360. The bulls pushed the price above the $3,365 resistance zone. A high was formed near $3,373 and the price is now consolidating.
On the downside, immediate support is near the $3,350 level and the 23.6% Fib retracement level of the upward move from the $3,282 swing low to the $3,373 high.
Besides, there is a key bullish trend line forming with support at $3,350. The next major support sits at $3,330 and the 50% Fib retracement level.
A downside break below the $3,330 support might send the price toward $3,300. Any more losses might send the price toward the $3,280 support zone.
Immediate resistance is near the $3,370 level. The next major resistance is near $3,380. An upside break above $3,380 could send Gold price toward $3,400. Any more gains may perhaps set the pace for an increase toward the $3,420 level.
This article represents the opinion of the Companies operating under the FXOpen brand only. It is not to be construed as an offer, solicitation, or recommendation with respect to products and services provided by the Companies operating under the FXOpen brand, nor is it to be considered financial advice.

XAU/USD: Analysis and Strategy Amid Trade ConflictsA rate cut this month is highly unlikely, with the earliest possible delay to September. Currently, the gold market trend is still dominated by tariff factors. Although the tariff war was extended for 90 days in April, the 10% base tariff imposed on all trading countries during this period has already made the total tax revenue of these three months reach 70% of that in previous years.
Trump's launch of the tariff war has clear core goals: first, to directly increase U.S. fiscal revenue; second, to boost exports through policy inclination, while helping enterprises increase profits to expand the tax base; third, to promote the growth of domestic employment. Just last weekend, his administration announced that it would impose a 30% tariff on the European Union and Mexico, and the new regulations will take effect on August 1.
Against this backdrop, the escalation of trade conflicts has become increasingly obvious. For gold, this means continuous and strong support, and the certainty of its upward logic has been further enhanced. From a long-term perspective, the gold market is not expected to see a deep correction in the second half of the year.
After pulling back to around $3,280 last week, the price has embarked on a sustained upward trajectory and now fluctuates within the range of $3,345-$3,380. For this interval, a strategy of buying low and selling high would be appropriate.
I am committed to sharing trading signals every day. Among them, real-time signals will be flexibly pushed according to market dynamics. All the signals sent out last week accurately matched the market trends, helping numerous traders achieve substantial profits. Regardless of your previous investment performance, I believe that with the support of my professional strategies and timely signals, I will surely be able to assist you in breaking through investment bottlenecks and achieving new breakthroughs in the trading field.
