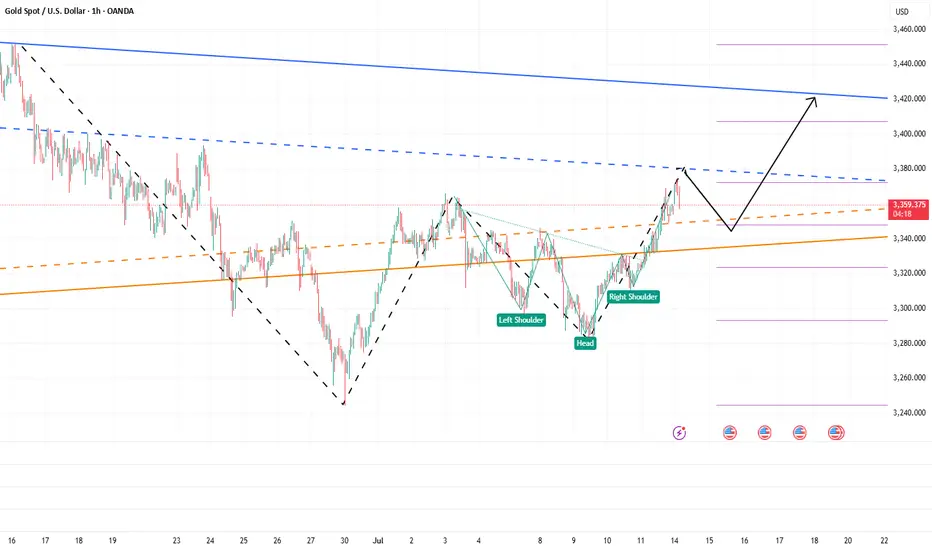
The bulls have started, aiming at 3400!Gold rose as soon as the market opened, and the highest has now reached above 3374. The upward momentum of gold is strong. It can be seen that after breaking through the recent high of 3365, its morphological structure has obviously tended to a bullish structure, and the technical form shows a "W" double bottom structure and an inverted head and shoulder resonance. The resonance of this technical structure will continue to support the continued rise of gold.
At present, gold is under pressure near the 3380 area in the short term, followed by the area near 3405. At present, gold has a technical retracement near 3380, but it is difficult to destroy the already formed rising structure based on the current retracement strength. Once gold rises again, 3380 will definitely be conquered! It will even continue to the 3400-3410 area; and the area with obvious short-term support is concentrated in the 3350-3340-3330 area, so gold may still rebound again with the support of this area after the decline, and continue to rise.
So for short-term trading, I would consider buying gold in batches based on the support of the 3350-3330 area, with the first target looking at 3380, followed by the 3400-3410 area.
Xauusdanalysis
XAUUSD - POSSIBLE BIG LONG MIDTERM TRADESAXO:XAUUSD
XAUUSD - POSSIBLE BIG LONG MIDTERM TRADE📈
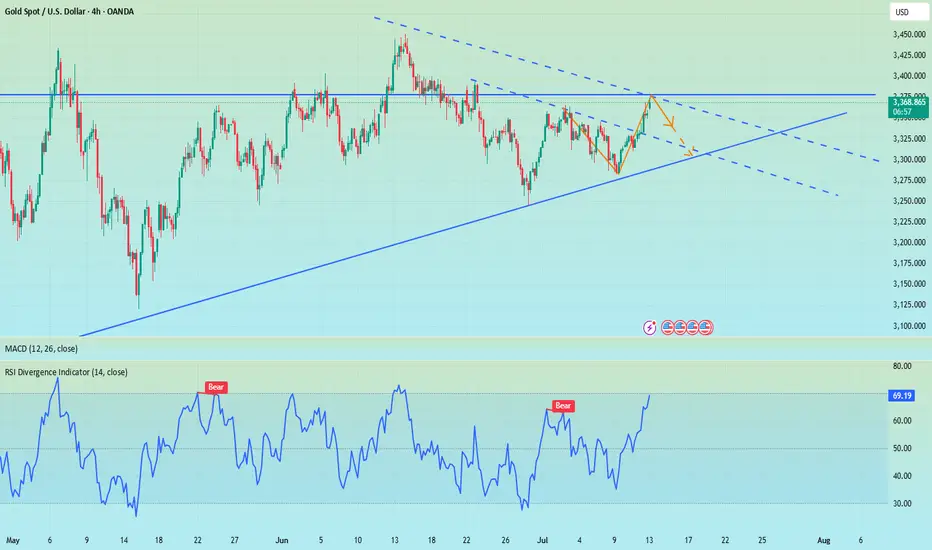
XAUUSD has gone the half of my take profit, so I decided to close 1/2 of my position here and put my stop loss at an entry price. Still, we have good chance to go towards upper border of the triangle, just want to reduce the risk.
XAUUSD has been trading sideways and has formed a Triangle pattern since April 23d. Looks like the price found a balance between supply and demand. Currently the price is sitting on a lower border of a triangle and potentially is forming the Wave D, according to Elliot Triangle Wave formation.
Trade cautiously!

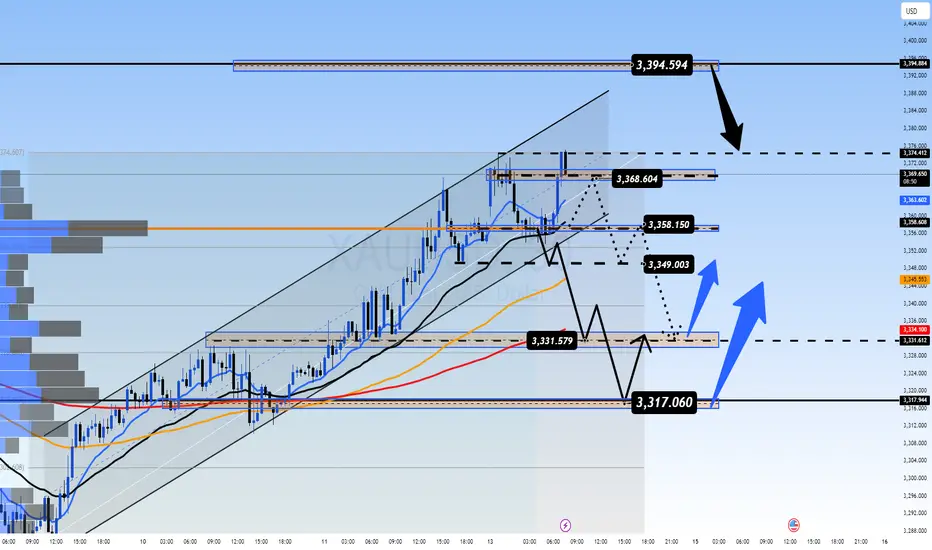
Early Week Pullback Ahead of Key Economic ReleasesGold Outlook – 14 July | Early Week Pullback Ahead of Key Economic Releases
🌍 Market Sentiment & Macro Overview
Gold has started the week with a sharp retracement after filling prior liquidity gaps (FVG) from the past two weeks.
This early weakness signals a risk-off tone as traders adopt a cautious stance ahead of a heavy macroeconomic calendar and geopolitical trade discussions.
This week’s high-impact events include:
📌 US CPI (Inflation Data)
📌 US PPI (Producer Prices)
📌 Unemployment Claims
📌 Retail Sales Figures
These data points will likely set the tone for price action through the second half of the week, with potential for sharp moves in gold.
📉 Technical Snapshot – M30 Chart Structure
Price swept minor liquidity above recent highs
Pulled back by more than $15 from the short-term top
Currently trading below the intraday VPOC (~3358), suggesting short-term bearish momentum
If the selling pressure holds, we may see a move toward:
⚠️ 333x zone — initial liquidity pool
❗ 332x zone — deeper liquidity grab before any bullish reversal
🧭 Trading Plan – Key Zones and Setup
📥 Buy Setup: 3331 – 3329 (Zone of Interest)
Stop Loss: 3325
Target Levels:
TP1: 3335
TP2: 3340
TP3: 3344
TP4: 3350
TP5: 3360 – 3370
✅ A highly reactive zone — ideal for intraday long setups if price sweeps into this area and shows bullish confirmation (e.g., volume spike or rejection wick).
📤 Sell Setup: 3393 – 3395 (Resistance Re-Test)
Stop Loss: 3399
Target Levels:
TP1: 3390
TP2: 3386
TP3: 3382
TP4: 3378
TP5: 3374 – 3370 – 3360
📉 Potential scalp zone if price retests resistance with signs of exhaustion. Monitor closely for bearish structure confirmation.
📊 Key Support & Resistance Levels
Resistance Zones:
3358
3368
3374
3394
Support Zones:
3349
3340
3331
3318
These zones remain relevant for both momentum trades and reversion setups.
⚠️ Strategy Considerations
At the time of writing, gold is trading indecisively around the M30 VPOC. No clear breakout has occurred yet.
⏳ Wait for volume confirmation during the London session
🚫 Avoid impulsive entries based on emotions or FOMO
✅ Stick to your risk parameters and let price come to your level
🧠 Summary & Bias
Gold is experiencing an early-week technical correction after recent strength.
The market is in "wait-and-see" mode, with macro drivers likely to dictate direction from mid-week onwards.
📍 Watch the 3331–3329 zone closely — it remains the most attractive level for long setups.
📍 The 3393–3395 zone is a key area to fade strength if price struggles at resistance.
Patience and precision are key this week. Let the market reveal its intention, and trade accordingly.
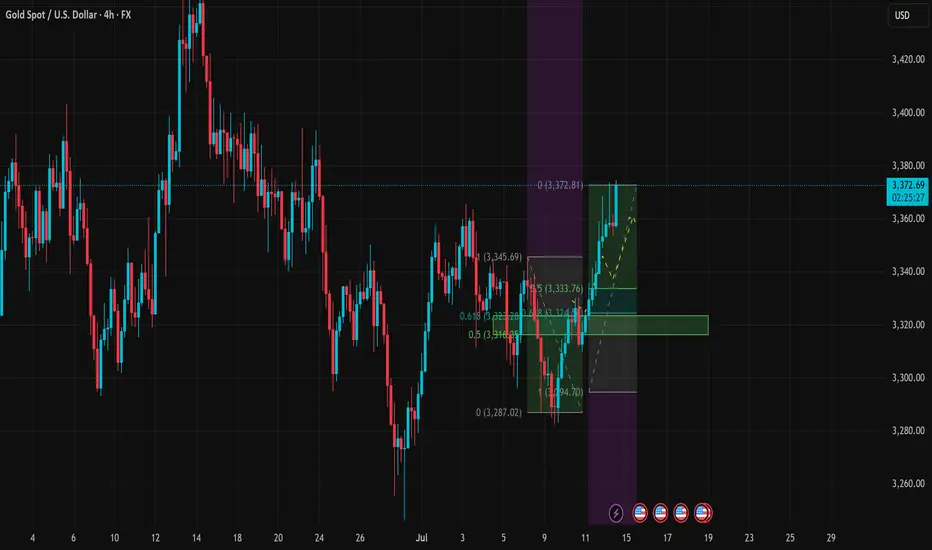
XAUUSD Analysis – July 14, 2025: Gold Tests Critical Resistance Gold (XAUUSD) is currently trading around $3,373, rebounding strongly from the recent low at $3,294. Price is now testing the key resistance zone at $3,372–3,375, which aligns with the 0.0 Fibonacci retracement of the previous downtrend and a significant supply zone on the H4 timeframe.
1. Technical Analysis (H4 Chart):
🔹 Fibonacci & Price Action:
The price found strong support at $3,294, where previous demand and Fibonacci levels converge.
A sharp bullish move has pushed price above the 0.5 (at $3,316) and 0.618 (at $3,322) Fibonacci levels – signaling strong buyer interest.
The $3,372 zone is now acting as short-term resistance, matching the previous swing high.
🔹 EMA & RSI:
EMAs are trending upward, confirming short-term bullish momentum.
RSI is approaching overbought territory, suggesting a potential pullback in the short term.
🔹 Trendline & Structure:
Price remains above the rising trendline, indicating sustained bullish momentum.
The nearest support zone is now at $3,322 – $3,333, which overlaps with key Fibonacci and previous structure levels.
2. Key Price Levels:
Price Zone
Significance:3,372 – 3,375
Short-term resistance – Fibo 0.0:3,345 – 3,333
First support – pullback zone:3,322 – 3,316
Strong support – EMA + Fibo 0.5:3,294 – 3,287
Major support – recent swing low
3. Suggested Trading Strategies:
Strategy 1 – Take Profit for Existing Longs:
If you entered long positions near $3,295–$3,300, consider taking partial profits at the current resistance zone ($3,372–$3,375).
Strategy 2 – Short-Term Sell Opportunity:
Consider a short entry near $3,372–$3,375, with a stop-loss above $3,383.
Target profit: $3,333 – $3,322
Strategy 3 – Buy on Dip (Trend Continuation):
If price pulls back to the $3,333 – $3,322 support and holds, this is a good zone to enter long.
Stop-loss below $3,316, with potential target back to $3,385 – $3,400 if a breakout occurs.
Gold is showing a solid recovery after a sharp decline, but it is now testing a key resistance zone around $3,373. Caution is advised in the short term, as a pullback may occur. Priority should be given to "Buy on Dip" strategies if support zones hold.
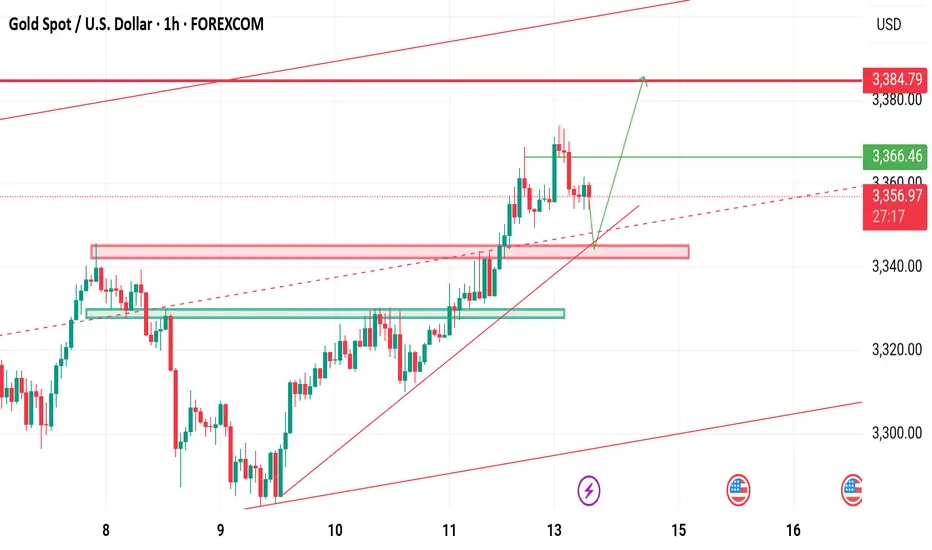
XAUUSD 1H | Bullish BOS & OB Retest | Targeting 3390+🚀 Gold (XAUUSD) 1H Timeframe is showing a clean Bullish Market Structure with multiple Breaks of Structure (BOS ↑) confirming upside momentum.
🔹 Price retraced back into a strong Demand Zone (OB) and has started pushing upward again, indicating strong buyer interest.
🔹 Clear Order Block Retest after BOS confirms Smart Money Entry.
🔹 Target is marked around 3390+, based on previous liquidity and imbalance zones.
📈 Expecting continuation of bullish trend until the marked Target Point is reached.
💡 This setup follows pure SMC principles: BOS → OB Retest → Expansion.
🟢 Buy Bias Active | 📊 High Probability Trade Setup
#XAUUSD #Gold #SMC #BreakOfStructure #OrderBlock #LiquidityGrab #TrustTechnicallyAnalysis

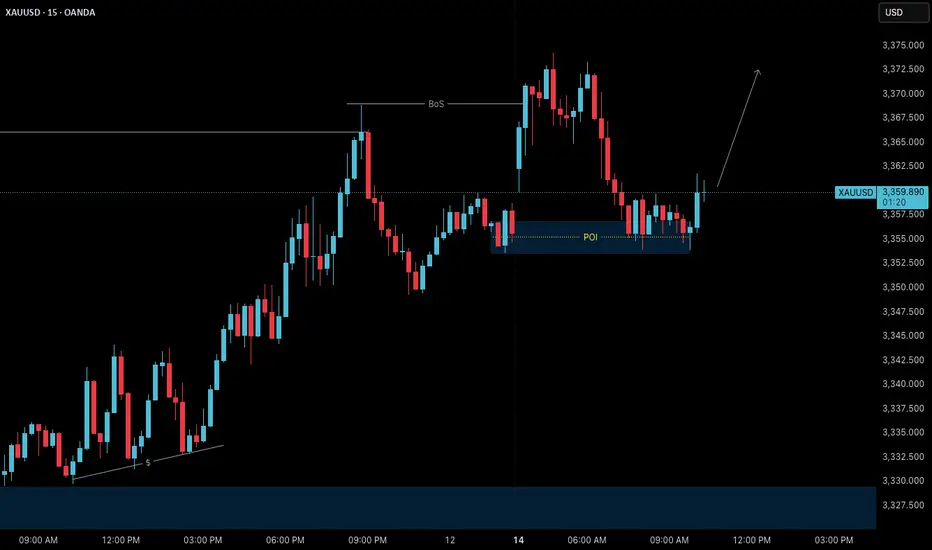
Gold – M15 Bias Within POI Zone | July 14 Analysis🟡 Gold – M15 Bias Within POI Zone | July 14 Analysis
As discussed in our previous H4 analysis, Gold opened the week with a gap above the spinning top candle, effectively skipping seller pressure and breaking above the H4 swing high ( 3366 ).
This Break of Structure (BoS) confirmed the H4 bullish continuation , and now price may be preparing for a pullback toward the 3320 Order Block (OB) before resuming its upward trend.
🔍 M15 Intraday Bias:
📍 Price is currently trading inside the 3355 M15 POI zone — a potential continuation zone
🔄 On Lower Timeframes ( M1 ), a micro ChoCH has already occurred — an early signal of possible bullish interest
However, we're still waiting for a micro BoS to validate the reversal and confirm that the POI is being respected
Until that confirmation is in place, we continue to observe market behavior and remain patient
🧭 High-Probability Scenario:
If the current zone fails to hold or doesn’t provide clean M1 confirmation , we will shift focus to the 3320 OB , which remains the most reliable zone for a long setup in line with the H4 trend
A pullback to this level, combined with confirmation, would provide a strong case for continuation trades
🎯 Observational Trade Plan:
✅ Plan 1 (Aggressive Option):
→ If M1 micro BoS occurs from 3355 zone , a short-term long setup may be considered based on internal structure
✅ Plan 2 (Conservative Option):
→ If price pulls back to 3320 OB and M1 confirms , the setup aligns with higher timeframe trend continuation
🛑 Avoid counter-trading — structure remains bullish, and there's no confirmation for shorts at this point
🧠 Final Thoughts:
Let the market do the work. Structure is already pointing up — all we need is confirmation and timing.
No need to rush. Wait, observe, and only execute when the market invites you in with clarity.
📖 Structure leads, emotion misleads. Follow the flow — trade the mirror, not the noise.
📘 Shared by @ChartIsMirror
Gold Weekly Analysis | Will $3,360 Break or Hold? [July 14–18]In this video, I break down the recent gold price action and what to expect in the coming week. We’ll review how gold responded to last week’s FOMC minutes, why $3,360 remains a key decision zone, and what upcoming U.S. economic data (CPI, PPI, Retail Sales) could mean for price movement.
👉 If you find this content valuable, don’t forget to Vote, Comment, and Subscribe for weekly market breakdowns.
Disclaimer:
Based on experience and what I see on the charts, this is my take. It’s not financial advice—always do your research and consult a licensed advisor before trading.
#GoldAnalysis, #XAUUSD, #ForexTrading, #GoldForecast, #MarketOutlook, #TechnicalAnalysis, #FundamentalAnalysis, #GoldPrice, #FOMC, #CPIData, #PPIdata, #DollarIndex, #TradingStrategy, #WeeklyOutlook, #GoldTechnicalAnalysis, #TradeSmart, #Darcsherry

XAUUSD on retest (swing ready)Gold is currently holding Rangebound 3345-3375.Also market has potential of buying towards 3400 then Drop again.
What's possible scanarios we have?
▪️I'm looking for Buying at 3340-3345 support area ,if we found 3340-3345 as correction and H4-H1 remains above then keep buy set targets at 3365 then 3375.
Additional TIP:
Below 3330 I will Activate my resell and hold till 3315 then 3305.
All the entries should be taken if all the rules are applied
#XAUUSD
Adjust after shock and then go longNews: In the early Asian session, spot gold rose slightly, reaching a high of $3,372.65/ounce, the highest since June 23. Trump announced last weekend that he would impose a 30% tariff on goods imported from the EU from August 1, which further heated up the market's concerns about international trade and provided momentum for gold prices to rise. In the early Asian session, spot gold rose slightly, reaching a high of $3,373.99/ounce so far, the highest since June 23. Trump announced last weekend that he would impose a 30% tariff on goods imported from the EU from August 1, which further heated up the market's concerns about international trade and provided momentum for gold prices to rise.
Analysis of gold trend: Today it hit a new high at around 3373. From the daily chart, gold has closed three consecutive positive days. The K-line pattern is a bullish signal. From the indicators, the RSI turned upward from a low level, and the Stoch indicator formed a golden cross at a low level. It is currently running in the middle. The indicators show that gold is still likely to rise in the short term. At the same time, we should also pay attention to the suppression of the 3400 area on the upper track of the daily Bollinger band. In the short term, pay attention to the breakthrough of this level. Once 3400 is not broken through for multiple times, gold will still fall back to test the 3280 support in the future. Once it breaks through 3400, gold will test the 3450 area. In the short term, it is still likely to rise. The operation strategy remains unchanged.

Gold Price Analysis July 14Gold confirmed a break above the key 3330 level on Friday, opening a clear uptrend. The reaction at the 3368 GAP zone further strengthens the current bullish momentum. With the current market structure, the bias is leaning towards buying on corrections around support zones.
🔍 Technical levels to watch:
Support: 3345 – 3331 (potential buying zone)
Resistance: 3387 – 3400 (bullish target)
📌 Trading strategy:
BUY Trigger 1: Price tests and rejects the 3345 support zone
BUY Trigger 2: Buy around 3331 – strong support zone
🎯 Target: 3400
The current trend favors a buying strategy on reasonable price correction conditions. It is necessary to monitor price action around support zones to confirm effective entry points.

Affected by tariffs, gold rose again.On Saturday, Trump announced that he would impose a 30% tariff on goods imported from the European Union and Mexico from August 1. This news triggered a rise in risk aversion in the market. As a traditional safe-haven asset, gold was once again sought after. The price continued the rise on Friday and continued to open high in the early Asian session. As of now, the highest price reached around 3373.
From the current market point of view, after breaking through the triangle pattern last Friday, there was a sharp rise. The price successfully stood on the short-term moving average, showing an overall bullish trend. However, it should be noted that the short-term moving average has not yet formed an upward cross, which means that there is a high possibility of a confirmation process in the future. Looking back at the trend in the past two months, gold rarely opens high and then continues to rise. Most of them open high and go low. Therefore, under the current situation, although it is bullish overall, it is not advisable to blindly chase more. It is more suitable to wait for a decline before arranging more orders. The key lies in grasping the decline position.
From the perspective of pressure level, 3380-3385 is the first pressure level, and the second pressure level is 3395-3400. The support level below is around 3345, which is also the pressure level that has been emphasized in the early stage, and the top and bottom conversion position. For today's operation, Quaid recommends low-to-long.
Operation strategy:
Short near 3380, stop loss 3390, profit range 3360-3345
Long near 3345, stop loss 3335, profit range 3360-3380
Market Structure & Technical Context 14 July 20241. Price Action & Market Structure
Gold has broken recent swing highs above ~$3,360, marking a bullish Break of Structure (BOS) and signaling upward momentum continuity
Recent pullback zones around $3,350–$3,340 formed a clear Higher Low (Change of Character) — textbook price action confirmation.
2. Fibonacci Retracement / Extension
Measuring from the last swing low near ~$3,326 to swing high ~3,374:
38.2% retracement at ~$3,352 coincides with the current bounce zone.
50% retracement at ~$3,350 aligns with key structure support.
Upside extension targets: 1.272 at ~$3,396, 1.618 at ~$3,425 — overlapping major resistance zones
3. ICT & Smart Money Concepts (SMC)
Order Blocks (OBs) identified near $3,340–$3,342 (prior resistance turned support) — ideal demand zone.
A recent Buy-side liquidity grab eclipsed above $3,360, sweeping stops and gathering liquidity before the breakout — classic ICT setup .
A Fair Value Gap (imbalance) lies around $3,345–$3,350 — zone to expect value-driven retracement.
Higher timeframe has clear SMC alignment: BOS above 3,360 with CHoCH already formed.
4. Major Supply / Demand & Support / Resistance Zones
Demand: $3,340–$3,352 (OB + Fib + BOS confluence).
Supply: $3,380–$3,385 (intraday swing high resistance), followed by zone at $3,396–$3,400.
Key resistance at $3,360–$3,362 — confirmed supply pocket that needs to be reclaimed
5. Moving Average Confirmation
The 4‑hour SMA/EMA 100–200 band is sloping up just below current price (~$3,340–$3,350), reinforcing the bullish context .
1‑Hour Intraday Setups (Aligned with HTF Bullish Bias)
Setup A: Pullback into 4‑Hour OB / Fair Value Gap
Entry: Limit buy at $3,345–$3,350.
Stop: Below $3,335 (below imbalance & BOS).
TP1: $3,362 (former resistance).
TP2: $3,380 (next supply block).
Setup B: Breakout Retest of 3,360
Entry: Buy on retest of broken resistance at $3,360.
Stop: Below $3,356.
TP1: $3,380.
TP2: $3,396 (Fib extension confluence).
Setup C: Momentum Continuation Fresh Breakout
Entry: Market buy on clear H1 BOS above $3,365.
Stop: Below breakout candle low (~$3,360).
TP: $3,396 (1.272 Fib) – extend to $3,425 if momentum strong.
The Golden Setup:
Setup A—buy from $3,345–$3,350—has strong confluences:
4‑hour demand OB + fair value gap,
38.2–50% Fib retracement,
SMC BOS/imbalance alignment,
ICT-style order block zone.
This offers high edge with confluence clusters.
✔ Summary Report: Direction & Key Zones
Directional Bias:
Medium-term (4H): Bullish, confirmed by BOS above 3,360, higher lows, OB and Fibonacci alignment.
🔹 Primary Buy Zones:
$3,345–$3,350 — 4H OB + fair value gap + Fib.
$3,360 on retention — breakout retest zone.
Momentum entry >$3,365.
🔹 Key Target Zones:
First resistance: $3,360–$3,362.
Next supply: $3,380–$3,385.
Extension target: $3,396 (1.272 Fib), then $3,425 (1.618 Fib).
🔻 Watchdownside Risk:
Daily invalidation if drop below $3,335 (4H OB break).
Next support at $3,326–$3,330.
📋 Consolidated Table: Setups at a Glance
Setup Entry Zone Stop Targets
Golden $3,345–$3,350 $3,335 TP1: $3,362 / TP2: $3,380
Breakout Pullback $3,360 retest $3,356 $3,380 → $3,396
Momentum BOS >$3,365 (H1 BOS) < $3,360 $3,396 → $3,425
Final Thoughts
On the 4‑hour chart, price is firmly in a bullish regime, supported by price structure, SMC, ICT concepts, and Fibonacci confluence. The $3,345–$3,350 zone is the highest‑probability entry for buyers, offering excellent risk/reward. The Golden Setup targets ~$3,380 and beyond, combining structure, gap fill, and liquidity strategy.

Gold trend forecast for next week, continue to go longAfter the gold broke through on Friday, we started to turn long, and gold rose strongly. Gold finally rose as expected, and the gold bulls are still strong. If there is no major change in the news over the weekend, the decline next week will not be large, and we can continue to buy. The gold 1-hour moving average continues to cross upward and the bulls are arranged and diverge. The strength of gold bulls is still there, and the gold moving average support has also moved up to around 3330. After gold broke through 3330 yesterday, gold fell back to 3330 and stabilized and rose twice. The short-term gold 3330 has formed a strong support. Gold will continue to buy on dips when it falls back to 3330 next week.

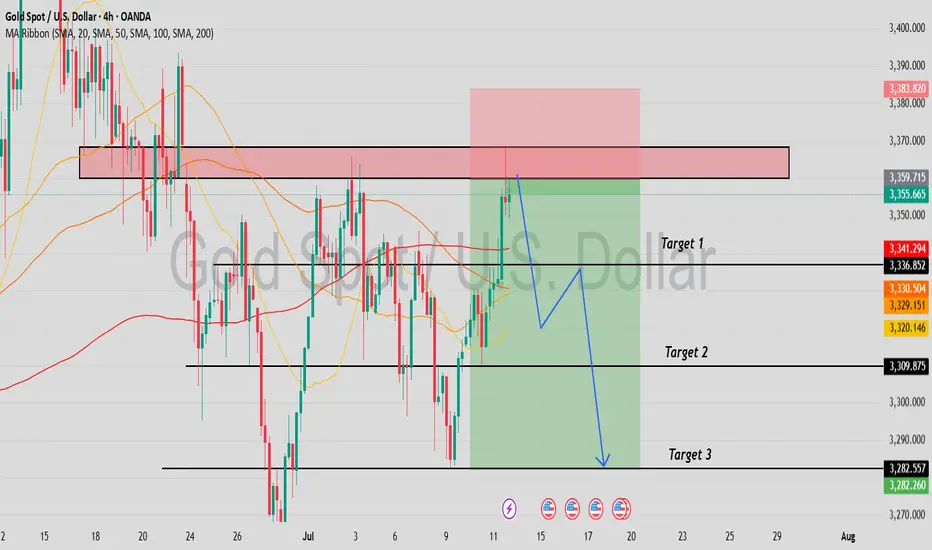
The impact of tariffs continues, shorting is expected to retrace📰 News information:
1. Focus on tomorrow's CPI data
2. Bowman's speech at the Federal Reserve
3. Tariff information outflows and countries' responses to tariff issues
📈 Technical Analysis:
During the weekend, the Trump administration's tariff information continued to come out, causing a large amount of funds to flow into the safe-haven market, triggering an escalation of market risk aversion. Although the collapse in the previous tariff remarks did hit the market's buying enthusiasm to a certain extent, the strong rise on Friday also stimulated the market's buying enthusiasm again. This, whether it is on the way down or on the way up, has attracted retail investors to a certain extent. As we judged on gold on Friday and the weekend, short-term bulls are undoubtedly strong. However, I think it is very dangerous to continue to chase long positions at high levels. Therefore, I tend to short-term and then consider continuing to chase long positions after the market retreats to the support level.
First of all, the CPI data will be released tomorrow. With inflation in the United States currently heating up, the Federal Reserve is undoubtedly resisting a rate cut in July. This has, to some extent, dampened the enthusiasm of bulls. Secondly, it is necessary to pay attention to the response of Europe and Japan to the tariff issue. Due to the timeliness, the current market expectations are undoubtedly limited.
In the short term, the RSI indicator is already seriously overbought. For today's operation arrangement, it is recommended to short at the rebound of 3365-3375. If the gold price continues to maintain a strong trend in the short term and breaks through this resistance area, it is time to stop loss. First of all, we should pay attention to whether 3355-3345 can be broken. Once it falls below the support of 3355-3345, we will need to see the 3330 line below, and it may even fall below 3300. Therefore, we also need to take precautions and follow up.
🎯 Trading Points:
SELL 3365-3375
TP 3355-3345
In addition to investment, life also includes poetry, distant places, and Allen. Facing the market is actually facing yourself, correcting your shortcomings, facing your mistakes, and exercising strict self-discipline. I share free trading strategies and analysis ideas every day for reference by brothers. I hope my analysis can help you.
FXOPEN:XAUUSD TVC:GOLD FX:XAUUSD FOREXCOM:XAUUSD PEPPERSTONE:XAUUSD OANDA:XAUUSD
Gold trying to cross 3400Gold has show bullish momentum by crossing the previous week high which was residing around 3369. Filed the previous gap available. We expect gold to go higher and touch the 2293 level which is a swing high. Another possibility would the to after taking previous week liquidly may give us a deeper pullback. The possibilities for the gold are shown in the graph accordingly.

XAU/USD analysis & outlookWeekly Outlook: GOLD (XAUUSD)
This week, I’ll be monitoring different scenarios, as price is currently far from any of my key Points of Interest (POIs).
My nearest potential buy is around the 3-hour demand zone. While it's not the most ideal entry—since it isn’t located in a discounted area—I’ll still keep an eye on it.
That said, I would prefer to see a deeper retracement into the 6-hour demand zone, which is in a far more discounted region. This zone offers a stronger setup, and I could see price launching from there again if tapped.
We’ve already seen a strong bullish reaction from last week’s demand zone, and based on current momentum, I could see price continuing upward until it reaches my next sell opportunity—the 3-hour supply zone, which sits at a premium level.
Confluences for GOLD Buys:
✅ Bullish structure — price has broken to the upside and remains overall bullish.
✅ Fresh 3H and 6H demand zones formed, which price could return to.
✅ Liquidity above — including trendline liquidity and previous Asia highs.
✅ Fundamentals — potential tariff cuts could fuel long-term bullish momentum for gold.
✅ Bearish Dollar Index (DXY) aligns with the bullish gold outlook.
📌 If price doesn’t retrace and instead continues to push higher, I’ll wait for another break of structure to the upside on the way toward the supply zone before reassessing entries.
Let’s stay focused and let the market come to us. Wishing everyone a great trading week ahead! 👊📈

XAU/USD Setup THIS WEEK
Expecting a drop into the 3300–3310 zone, where we have:
4H Fair Value Gap
Trendline confluence
Liquidity below New York Low
From there, looking for a potential bullish reaction targeting:
📈 3405 – area with resting liquidity above recent highs.
📍 No confirmed bullish structure yet — waiting for a shift on the 5M/15M timeframe to confirm entry.

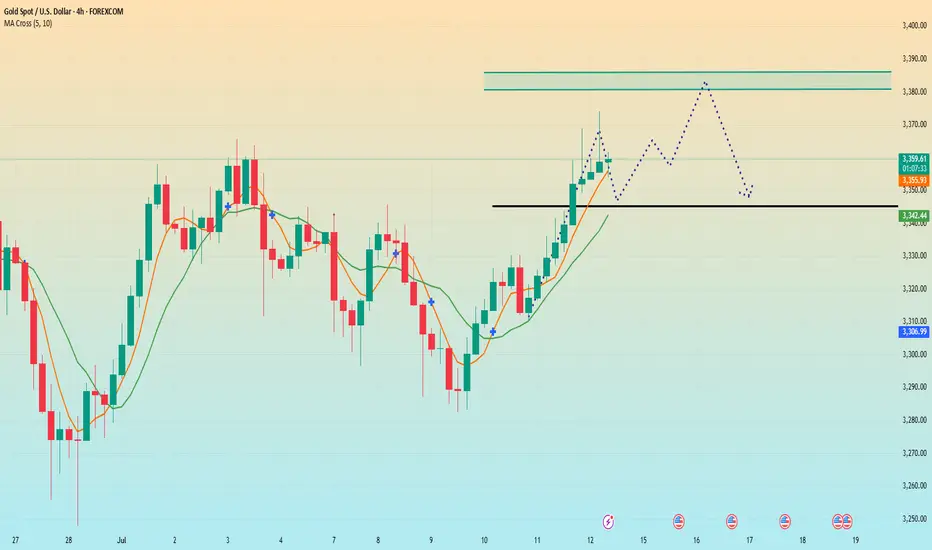
Gold Medium to Short Term Outlook Gold has shifted into a bullish structure after reclaiming key technical levels.
The strong impulsive move from below $3,300 into the $3,354–$3,370 resistance area reflects renewed buying interest, likely driven by improving sentiment and shifting macroeconomic expectations.
If bulls maintain control and price breaks and holds above $3,354, we could see continuation toward $3,383 and $3,400, with $3,416 marking the next major higher-timeframe resistance. These levels will be critical in determining whether gold resumes a broader bullish trend or begins to stall into a deeper correction.
On the flip side, if gold begins to fade below $3,354, then the $3,335–$3,305 pullback support zone will be key for potential bullish re-entry attempts.
A sustained break below this area would invalidate the current bullish leg and expose the market to a deeper retracement toward $3,289–$3,267, with $3,241–$3,208 acting as the higher-timeframe support floor.
📌 Key Levels to Watch
Resistance
‣ $3,370
‣ $3,383
‣ $3,400
‣ $3,416
Support
‣ $3,335
‣ $3,305
‣ $3,289
‣ $3,267
‣ $3,241
‣ $3,208
🔎 Fundamental Focus
Multiple high-impact U.S. data releases this week, including CPI, PPI, Retail Sales, and Unemployment Claims.
Expect elevated volatility across sessions.
⚠️ Manage your risk around news times. Stay sharp.

GOLD Remains BullishPrice made a HH at 3365, confirming structure shift back to bullish. The last HL is at 3305, making it the protected level for bulls.
H4 OB: 3305–3322 (origin of the recent impulsive leg — ideal pullback zone)
Supply Zone: 3432–3445 (next unmitigated supply target)
Bullish if price pulls into demand zone and holds, expect continuation to 3432+
H1 OB: 3325– 3335 (potential re-entry zone)
Watch for reaction on pull back
M15 Micro bullish flow is intact; price is consolidating around 3360
Breakout Buy: M15 BOS above 3365 with retest = entry trigger
🟢Entry Zone: 3325– 3335
SL: Below 3305
TP1: 3365
TP2: 3432
TP3: 3445

Gold is in the Bearish DirectionHello Traders
In This Chart GOLD HOURLY Forex Forecast By FOREX PLANET
today Gold analysis 👆
🟢This Chart includes_ (GOLD market update)
🟢What is The Next Opportunity on GOLD Market
🟢how to Enter to the Valid Entry With Assurance Profit
This CHART is For Trader's that Want to Improve Their Technical Analysis Skills and Their Trading By Understanding How To Analyze The Market Using Multiple Timeframes and Understanding The Bigger Picture on the Charts
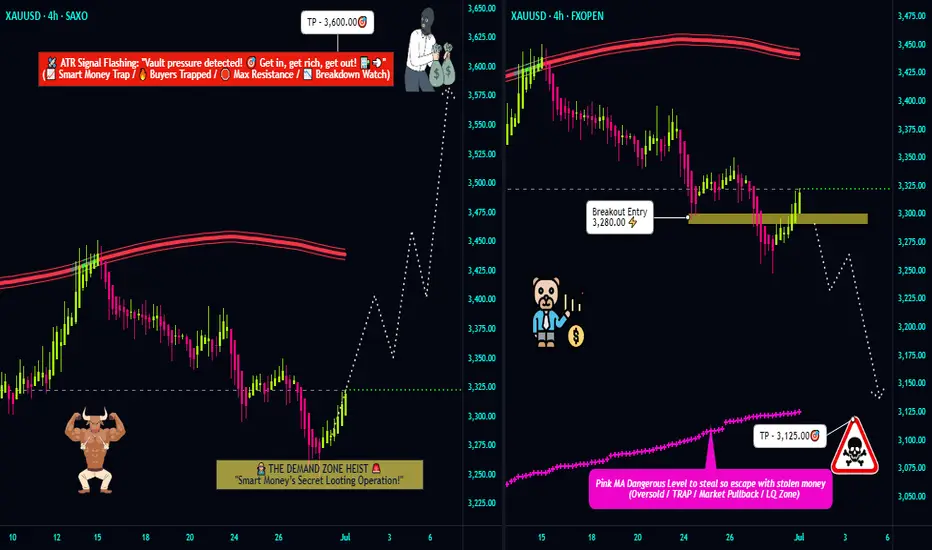
"Gold at a Crossroads! Bullish or Bearish? (Trade Plan)"🦹♂️💰 "Gold Heist Alert: XAU/USD Bullish Raid or Bearish Ambush?" 💰🦹♂️
🌍 Greetings, Market Pirates & Profit Raiders! 🌍
(Hola! Oi! Bonjour! Hallo! Marhaba!)
Based on the 🔥Thief Trading Method🔥, here’s our strategic heist plan for XAU/USD (Gold vs. Dollar). Follow the chart markings for high-probability loot zones—whether you're a bullish bandit or a bearish burglar! 🏴☠️💸
🎯 Entry Strategy (Where to Strike)
"The treasure is ripe for taking! Breakout = GO TIME!"
✅ Long Entry (Bullish Raid): Jump in at current levels if the uptrend holds.
✅ Short Entry (Bearish Ambush): Wait for a break & close below 3280.00 (confirms downtrend).
🛑 Stop Loss (Escape Route)
🚨 For Bulls: Bail out if price hits 3240.00 (SL tightens if trend strengthens).
🚨 For Bears: Retreat if price surges past 3360.00 (only activate SL post-breakout!).
🎯 Take Profit (Loot & Scoot!)
💰 Bullish Thieves: Aim for 3600.00 (or exit early if momentum fades).
💰 Bearish Bandits: Target 3125.00 (or escape before the cops—err, reversal—arrives).
📡 Market Intel (Why This Heist?)
Gold’s in a neutral zone (but bulls have the edge! 🐂📈). Key factors:
Macroeconomic shifts
COT data clues
Sentiment & seasonal trends
(Full breakdown in the chart notes—klick the 🔗! 🔍🌐)
⚠️ Danger Zones (News & Risk Control)
🚨 High-Impact News = NO NEW TRADES!
🚨 Protect open positions: Use trailing stops to lock in profits.
🚨 Adjust SLs if volatility spikes!
💥 Boost the Heist! 💥
Like & Share to fuel our next market robbery! 🚀💰
Follow for more lucrative trade setups—coming soon! 👀🔥
🎯 Trade Smart, Steal Smarter! 🦹♂️💎
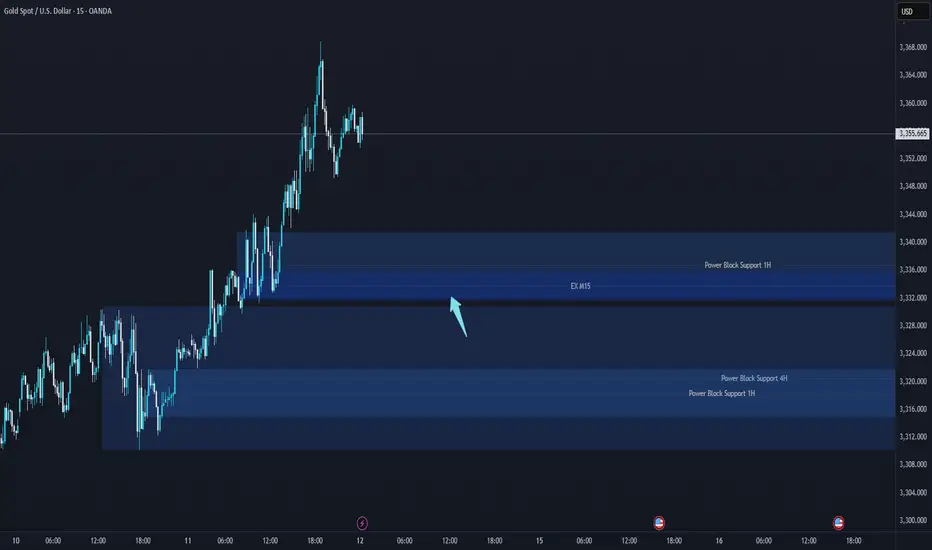
XAUUSD Support & Resistance Levels🚀 Here are some key zones I've identified on the 15m timeframe.
These zones are based on real-time data analysis performed by a custom software I personally developed.
The tool is designed to scan the market continuously and highlight potential areas of interest based on price action behavior and volume dynamics.
Your feedback is welcome!
Analysis of Gold's Trend Next WeekThe current uptrend for gold is clear. If there is a pullback at the opening next week, still recommends prioritizing long positions.
From a technical perspective, the 1-hour moving average has formed a golden cross, indicating strong bullish momentum. After breaking through in the afternoon, gold prices pulled back to test the 3330 support level, and the confirmation of its effectiveness has led to the formation of a short-term support structure.
It should be noted that although the 1-hour chart shows a relatively strong trend with a small pullback range, the risk of a deep correction remains a concern.
The operational suggestions for next week focus on the following support levels:
The first support level is 3345 (the bull-bear watershed).
The second support level is 3330 (a key support).
If prices pull back to around 3345 and stabilize, light positions can be taken to test long positions. If 3330 is broken down, the trend needs to be reassessed.
you are currently struggling with losses,or are unsure which of the numerous trading strategies to follow,You have the option to join our VIP program. I will assist you and provide you with accurate trading signals, enabling you to navigate the financial markets with greater confidence and potentially achieve optimal trading results.
