Consolidating Below Trendline Resistance, Bearish Bias IntactTechnical Structure:
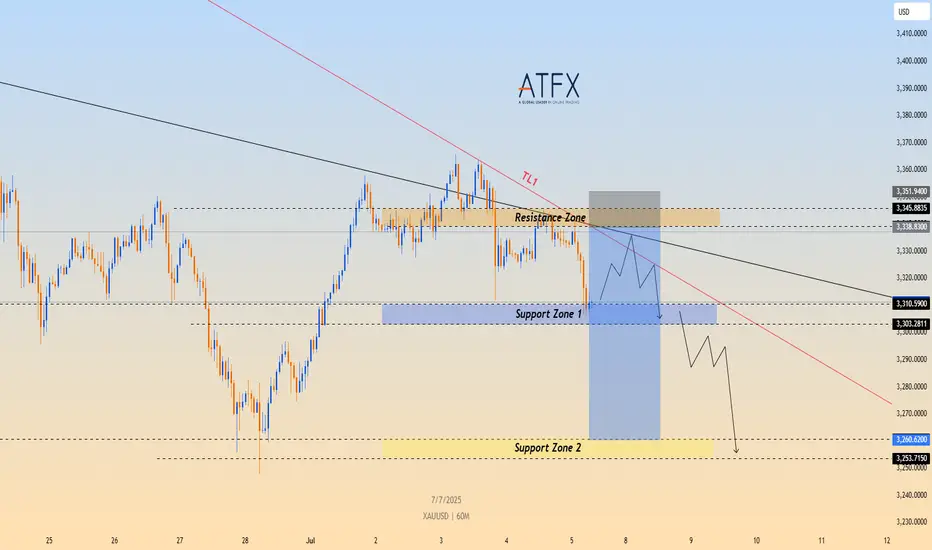
OANDA:XAUUSD Gold (XAU/USD) continues to trade below the descending trendline TL1, having failed multiple times to breach the $3,338–$3,345 resistance zone. After retesting Support Zone 1 ($3,303–$3,310), the price is showing signs of a short-term bounce. However, the broader structure remains bearish unless the price can break above TL1.
Key Technical Levels:
Resistance Zone: $3,338 – $3,345
Support Zone 1: $3,303 – $3,310
Support Zone 2: $3,260 – $3,253
Trendline: TL1 continues to act as dynamic resistance
Strategy Insight:
If TVC:GOLD gold remains below the descending TL1, bearish pressure is likely to resume. A short opportunity may arise if the price retests the resistance area and stalls. A confirmed break below Support Zone 1 would expose targets at $3,260 and $3,253.
Disclaimer:
This analysis is for educational purposes only and does not constitute investment advice. Please consult a qualified financial advisor before making trading decisions.
Xauusdanalysis
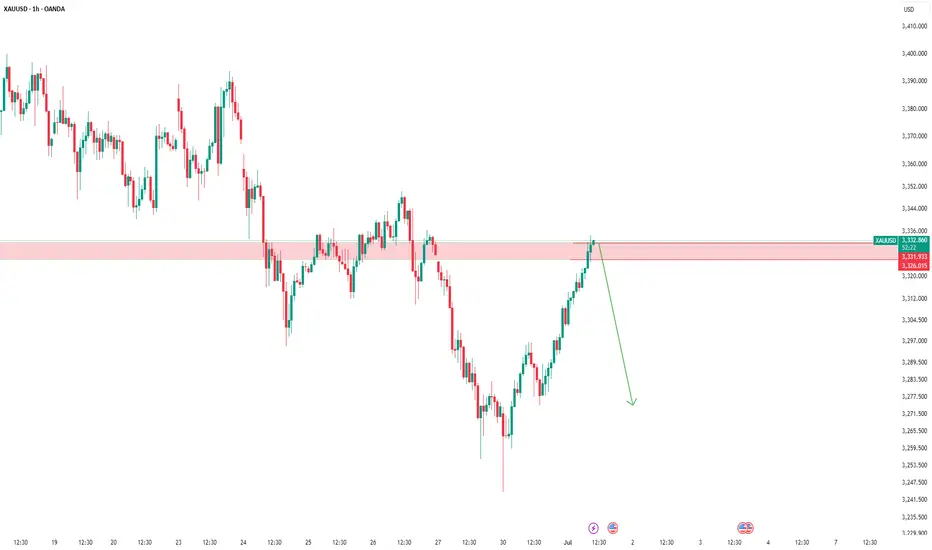
XAUUSD – Gold at a Key AreaGold is now in a crucial zone with short potential.
If the market provides a valid bearish signal, I’ll take the short.
But if this zone breaks and confirms with a pullback, I’ll switch bias and go long.
💡 Remember:
We don’t control the market — we just try to profit using structure, setups, and solid risk management.
📌 Always risk max 1% per trade.
If the market goes against your bias, you only lose 1% — not your whole account.
🧠 One trade won’t make you rich,
But one reckless trade can destroy everything.
No gambling.
Just discipline, structure, and smart execution.
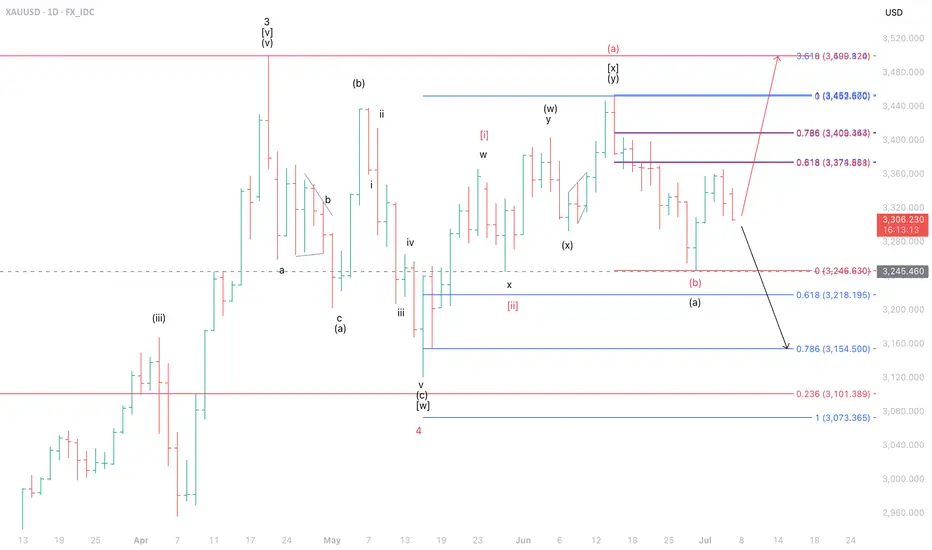
XAUUSD at a CrossroadsOn the daily timeframe, we identify two possible scenarios for XAUUSD. Under the red label, as long as XAUUSD remains above the 3,245 level—serving as a stop-loss—there is potential for further upside to test the 3,378–3,500 area.
However, in the worst-case scenario illustrated by the black label, if XAUUSD breaks below its key support, the next downside target would be in the 3,154–3,218.
The bill was introduced; the price did not rise but fell.Due to the implementation of the US bill, most traders in the market are bullish on gold and believe that gold will soar on Monday. As a result, it jumped up and fell sharply this morning. This is the uncertainty of the market. Although the short position given near 3340 last Friday was late, it fell to the low point of 3306 at the opening of the Asian market today.
In addition, the key to this sharp drop is the high point before the rebound, that is, the starting point or the position of the top and bottom conversion. Once it is broken, you have to change your mindset. The volatile market is like this, just get used to it. The turmoil caused by Trump's bill will not appear for a while. It takes a process and cannot be unilaterally considered as bullish or bearish.
In the early Asian market, the price fell all the way from 3342 US dollars to 3306. How to judge the end of the decline? It is to stare at the high point of the rebound before the last decline of 3320 US dollars. The loss of 3300 US dollars in the early trading indicates that the gap-up opening is a lure for more.
Today, I think that 3325 above 3320 can be used as the dividing point between long and short positions. You can short with a light position near 3315, and pay attention to the 3295-3290 line below. After the upward breakthrough is confirmed, consider adjusting the position and making other arrangements. For the time being, we will look at the weak adjustment during the day.
XAUUSD – Breakdown Watch: Key Demand Zone Re-tested AgainOverview
Price is once again pressing into the 3,291–3,301 key demand zone, which has already been tested multiple times. This latest move is coming after a clean lower high rejection and a developing descending trendline, hinting at weakening demand and possible bearish breakout ahead.
Key Technical Observations
Timeframe: 2H
Structure: Compression into demand with descending highs
Support Zone: 3,291 – 3,301 (major intraday demand)
Trendline: Bearish descending line from prior swing high → consistent supply pressure
Volume: Lower on this retest, but increasing slightly on recent red bars = subtle distribution
Bias: Bearish if 3,291 breaks, neutral-bullish only on strong bounce above descending line
TLDR
Gold is compressing against key 3,291 support with descending highs. Watch closely — a breakdown could accelerate toward 3,255. Only a reclaim above 3,330 would ease selling pressure.
Descending Triangle Behavior: Lower highs + flat base → bearish pattern often leads to breakdown
Previous Bounces: Each time weaker; this push lacks strong rejection wick so far
Watch For: Either a clean engulfing bounce → long trigger OR 2H close below 3,290 → short setup
Disclaimer
This is for educational purposes only. Not financial advice.

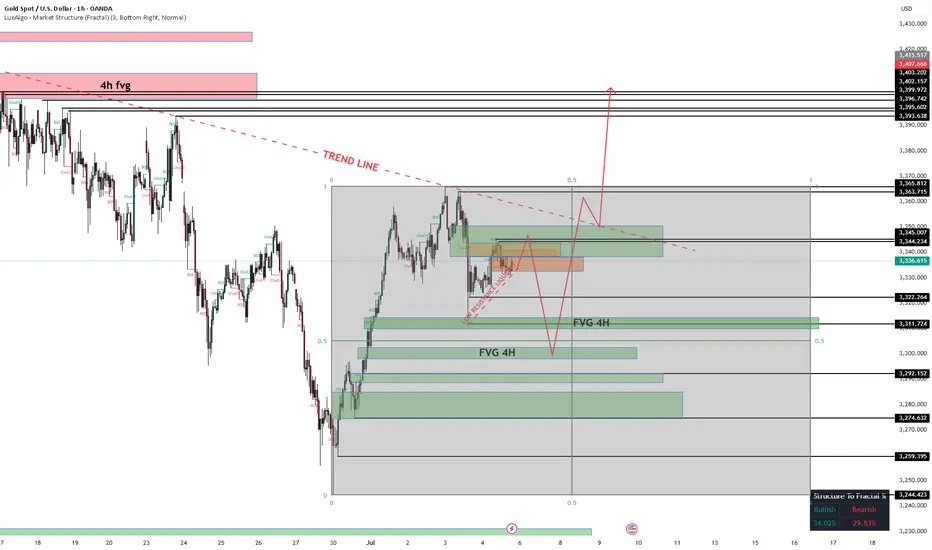
Monday Outlook on Gold (XAU/USD)My outlook for Monday is bearish at the start of the session, with price likely to drop toward the 3310–3300 area. This level aligns with a key discount zone inside the Gann box, and also overlaps with a 4H Fair Value Gap (FVG), making it a strong area of interest for potential long setups.
From that zone, I expect a bullish reaction, leading to a move back up to the trendline.
If the momentum continues, I anticipate a break of the trendline, followed by a retest, and then the beginning of a bullish trend.
I’ll be looking for confirmations around 3300 to position for the move higher.
Let’s see how Monday opens.
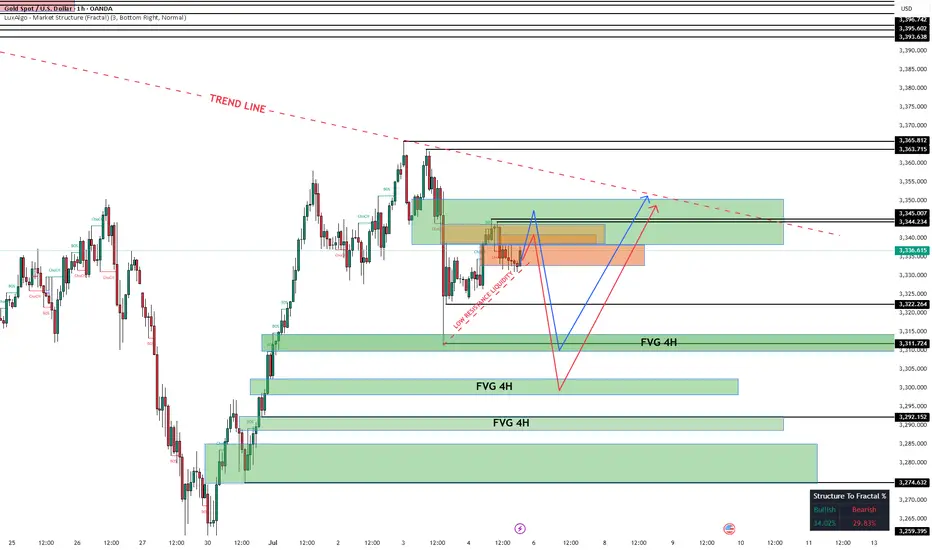
Monday Outlook on Gold (XAU/USD)In my opinion, we can expect a drop at the beginning of the week, with price potentially falling to the 3310–3300 zone. This area may act as a demand zone or liquidity pool, from where I expect a bullish reaction. After reaching that level, I anticipate the price to climb back up toward the trendline.
I’ll be watching for confirmations around 3300 for possible long entries.
Let’s see how the market opens on Monday.
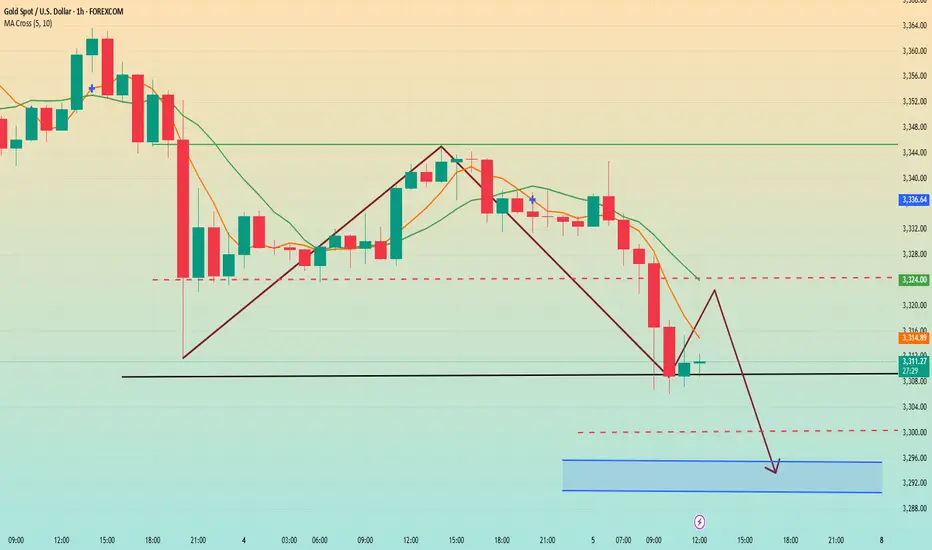
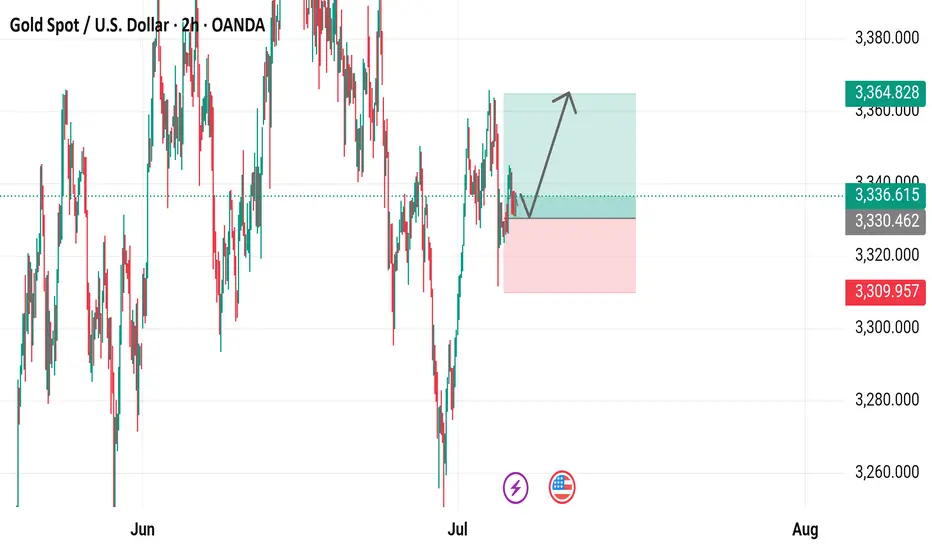
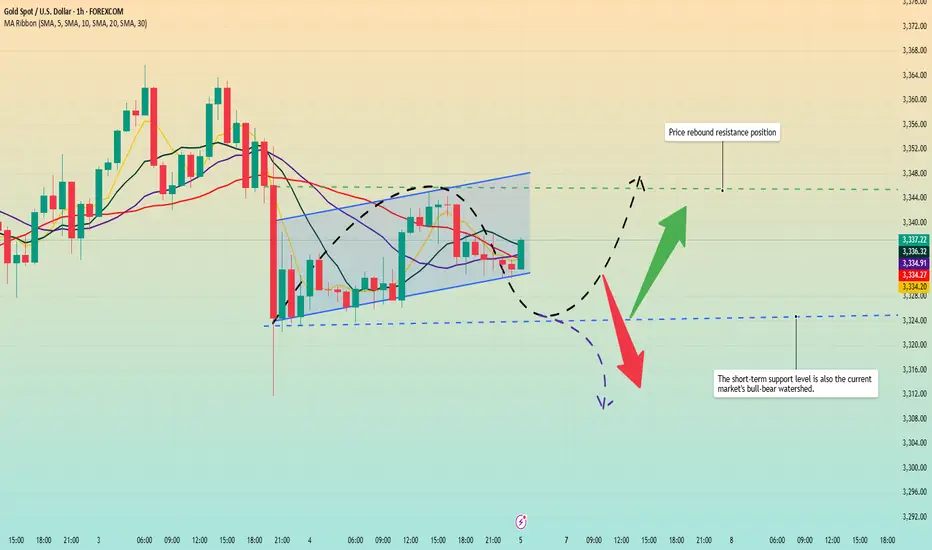
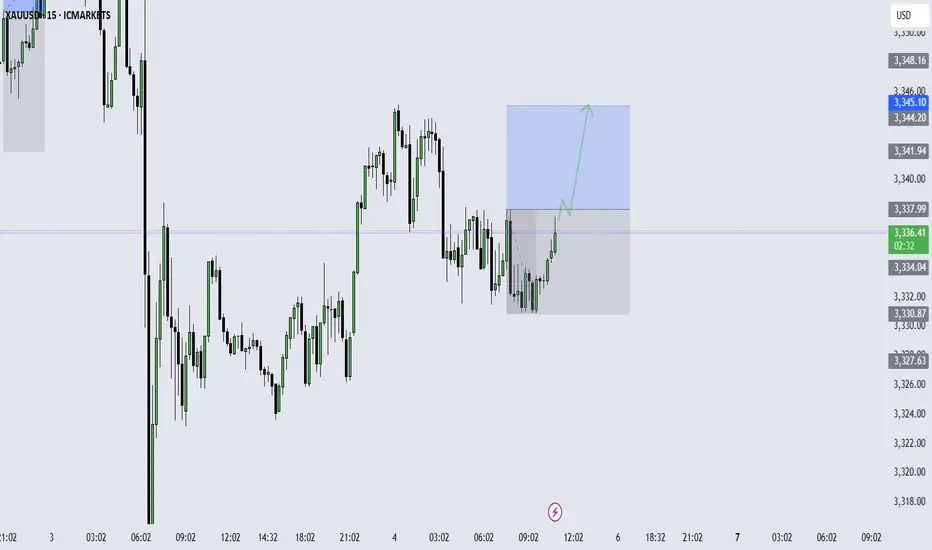
Gold Spot / U.S. Dollar (XAUUSD) 2-Hour Chart2-hour chart from OANDA displays the recent price movement of Gold Spot (XAUUSD) against the U.S. Dollar. The current price is $3,336.615, up by $10.585 (+0.32%). The chart highlights a recent upward trend with a buy signal at $3,336.970 and a sell signal at $3,336.260. Key price levels include a resistance zone around $3,364.828 and a support zone near $3,309.957, with the price showing a potential breakout above the recent consolidation range.
Big changes begin. Dominant trend?Event summary:
The United States passed the Big and Beautiful Act; how to get this part of the tax after the massive tax cut? Then it can only be obtained through other means, and the tariff war initiated by Trump is one of them. At the same time, the bill will increase the federal debt by trillions of dollars, further widening the gap between the rich and the poor.
Immediately after the bill was signed and took effect, Musk announced the establishment of the "American Party". He wrote: We live in a one-party state, not a democratic country. Today, the American Party is established to return your freedom to you. At the same time, Musk posted on July 6, when and where should we hold the first congress of the "American Party"? This will be very interesting.
This event is likely to support the trend change of gold bulls in the short term.
Market analysis:
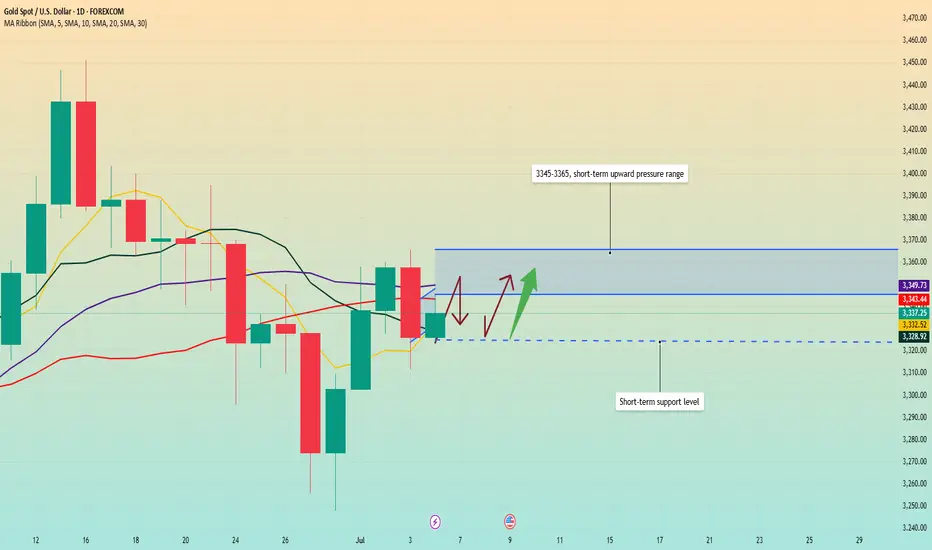
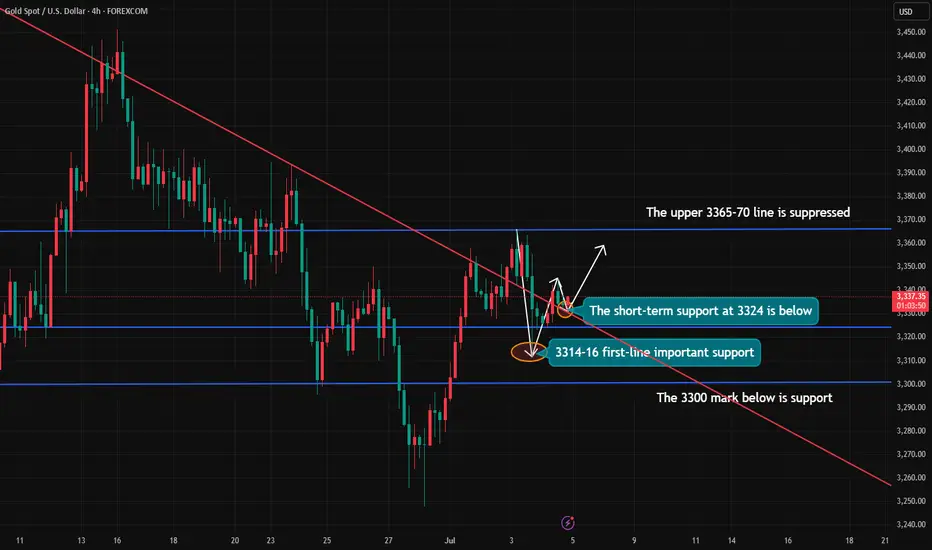
From the daily chart, after bottoming out and rebounding this week, the weekly line closed higher, and there is still upward momentum next week; short-term focus on the pressure of the 3345-3365 range, which is likely to become a key area for long and short competition. Before breaking upward, focus on the high and fall. Pay attention to the support rebound of 3320-3325 area below. Once the upper pressure range is broken, the bullish space will expand, and it is not ruled out that it will hit above 3400 and then go down.
In terms of operation, the price falls back and buy on dips in the 3315-20 area, and pay attention to the profit range of 3345-3365 on the upside.
XAU/USD Weekly & Daily Outlook | What’s Next for Gold?Gold starts the new trading week still locked in a consolidation range, holding just above the $3,328–$3,327 support zone. Despite multiple attempts, price continues to struggle at the $3,356 resistance.
The 50MA and 200MA are now compressing, suggesting the market is preparing for a breakout. Until then, structure remains neutral and range-bound.
📌Key levels to watch:
Resistance:
$3,356 ‣ $3,383 ‣ $3,400 ‣ $3,416 ‣ $3,440
Support:
$3,328 ‣ $3,313‣ $3,300 ‣ $3,267 ‣ $3,241
‣ $3,208 / $3,179 – Deeper downside if bearish pressure builds
🔎 Fundamental Focus
The key risk event this week is Wednesday’s FOMC Meeting Minutes. Markets will be looking for clues on the Fed’s internal stance regarding future rate cuts and inflation expectations.
🔗 Follow for live updates and intraday chart setups.

XAUUSD Weekly Chart Buying area📊 XAU/USD (Gold) Price Analysis – 4H Chart
🕒 Date: July 6, 2025
🔍 Technical Overview:
Gold is currently trading around the $3,337 level, showing signs of consolidation after a recent bounce.
🔸 Key Zones:
🟡 Resistance Area 1: $3,295 - $3,310
🟡 Resistance Area 2: $3,250 - $3,270
🟡 Target Zone: $3,390 - $3,410
📈 Possible Scenarios:
Price may retrace to the $3,295 - $3,310 resistance area, hold support, and aim for the $3,390 - $3,410 target zone.
A deeper pullback to the lower $3,250 - $3,270 resistance turned support area may occur before a stronger bullish move.
Breakout confirmation will come on a clean close above the $3,337 level with volume.
📌 Bias: Bullish above the $3,295 level
📌 Watch for: Bullish price action or liquidity grabs near support zones
💡 This setup is based on structure, liquidity zones, and institutional footprints.

Gold continues to fluctuate. The direction is uncertain.Gold prices did not have a large continuation breakthrough on Friday due to the impact of the US Independence Day holiday; although the non-agricultural data on Thursday fell rapidly under the unfavorable conditions and formed a bottoming-out situation, the short-term bulls and bears were once again in a deadlock. After a small sideways movement on Friday morning, it rose again. Although it did not break through the upper pressure line of 3345, it still closed in the form of a positive line, which also gave the bulls hope to dominate next week.
At present, the upper key pressure is still maintained at the 3345 line, which is also the first point for the bulls to break through. Once the upper breakthrough is successful, the next target will be maintained at around 3365-3380. The support below is maintained at around 3325. If this position is broken down on Monday, the support of 3325 will not be maintained, and the bears will continue to open the downward channel.
But overall, the market direction is still unclear, and we can conduct trial transactions. Go long when the price falls back to 3325 on Monday in the Asian market, the profit range is 3340-3350, and the stop loss is 3315. If the European market continues to strengthen, you can still go long. If the European market continues to strengthen, we can still continue to go long. Otherwise, we still need to adjust our thinking in a timely manner.
renderwithme | XAUUSD - GOLD Pre-NFP Technical AnalysisCurrent Market ContextPrice Levels: Gold (XAU/USD) is trading around $3,341.79 as of July 4, 2025, with recent price action showing consolidation between $3,300 and $3,400 after a pullback from highs near $3,500.
Recent Performance: Gold rose slightly by 0.27% to $3,335.17 per troy ounce on July 4, supported by positive momentum from trading above the 50-day EMA. However, it has faced resistance near $3,400 and experienced low liquidity due to the U.S. Independence Day holiday.
Market Sentiment: The overall sentiment remains cautiously bullish, driven by a weakening U.S. dollar amid concerns over U.S. fiscal imbalances (e.g., Trump’s tax-cut bill adding $3.4 trillion to the national debt) and expectations of a dovish Federal Reserve policy. However, short-term volatility is expected due to holiday-thinned liquidity and upcoming economic data
# Technical Outlook
Bullish Scenario: If gold holds above $3,300 and breaks $3,353, it could retest $3,400 and potentially climb toward $3,435–$3,451. A weekly close above $3,400 would negate near-term bearish risks and signal a continuation of the broader uptrend.
Bearish Scenario: A sustained break below $3,300 could trigger a deeper correction toward $3,248 (monthly low) or $3,226–$3,203. A drop below $3,203 would challenge the medium-term uptrend, potentially opening the door to $3,150 or lower.
Range-Bound Expectation: Due to low liquidity and pending NFP data, gold may consolidate between $3,320 and $3,340 early next week, with volatility increasing post-NFP
Disclaimer --
This analysis is based on recent technical data and market sentiment from web sources. It is for informational purposes only and not financial advice. Trading involves high risks, and past performance does not guarantee future results. Always conduct your own research or consult a SEBI-registered advisor before trading.
#Boost and comment will be highly appreciated

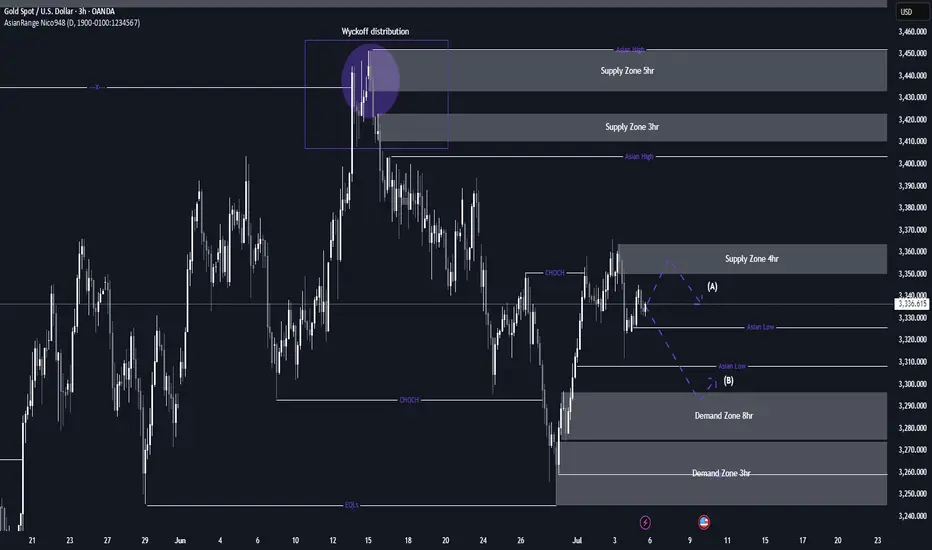
XAU/USD possible shorts from 3,350 towards 3,290 longsThis week, my focus is on a potential sell setup that could form within the 4-hour supply zone, which is currently near price. I’ll be patiently watching for signs of Wyckoff distribution within this point of interest (POI), which could confirm a short opportunity.
Given that price action has been bearish, this would be a pro-trend setup, especially with the visible liquidity resting below that we can look to target. Additionally, there is an 8-hour demand zone further below, which may provide a potential long opportunity once price reaches that level.
Confluences for GOLD Sells:
- Bearish market structure: Gold has been trending downward and has recently left behind a clean, unmitigated 4-hour supply zone, which could prompt a bearish reaction.
- Liquidity targets below: There's significant liquidity under recent lows, including Asia session lows and the 8-hour demand zone, which can be targeted.
- DXY correlation: The dollar has reacted strongly from a notable demand zone, suggesting potential upside for DXY, which may add bearish pressure on gold.
- Higher timeframe Wyckoff: A Wyckoff distribution pattern has also formed on the higher timeframe, which may indicate temporary bearish order flow.
P.S. If price disrespects the current 4-hour supply zone, I will shift focus to an extreme 3-hour supply zone above. Until price reaches that level, I may look for short-term buy setups to trade the move up.
Wishing everyone a great and profitable trading week! Stay disciplined and manage risk accordingly.
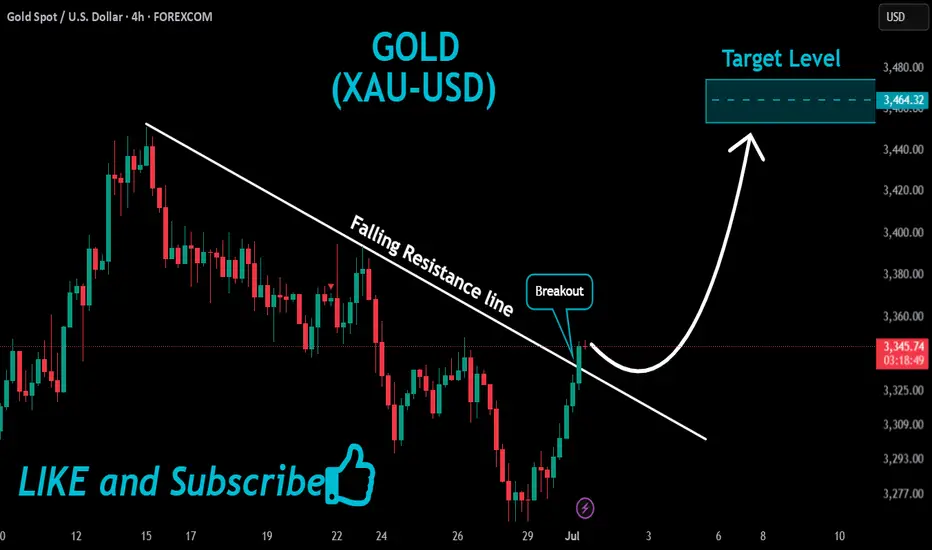
GOLD Massive Bullish Breakout!
HI,Traders !
#GOLD is trading in a strong
Uptrend and the price just
Made a massive bullish
Breakout of the falling
Resistance line and the
Breakout is confirmed
So after a potential pullback
We will be expecting a
Further bullish continuation !
Comment and subscribe to help us grow !
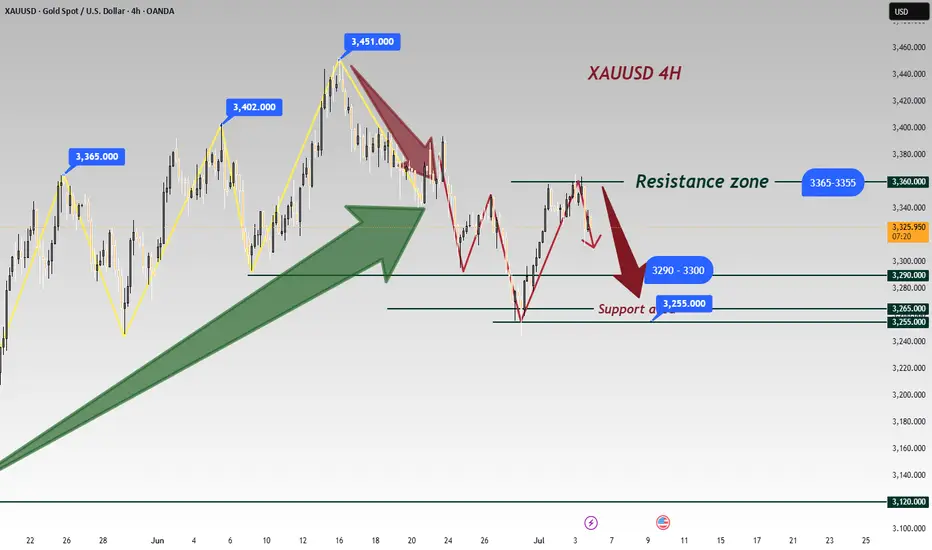
Gold - The final resistance breakout!Gold - TVC:GOLD - prepares a final rally:
(click chart above to see the in depth analysis👆🏻)
Over the past 12 months, Gold rallied more than +70%. However the past three months clearly rejected a major horizontal resistance. But price action on the smaller timeframe remains incredibly bullish. Therefore an all time high breakout will most likely follow.
Levels to watch: $3.500
Keep your long term vision!
Philip (BasicTrading)

June Nonfarm Data: Gold PlungesThe US June nonfarm payrolls data is out: 147,000 jobs were added, exceeding the expected 106,000 and the previous 139,000, with slight upward revisions to the prior two months’ figures. The unemployment rate dipped from 4.2% to 4.1%, beating the forecast of 4.3%. While the US economy slows, the job market remains robust. 🌟
Post-data release, market bets on a July rate cut have evaporated, with the probability of a September cut dropping to around 75%. US stock futures extended gains, Treasury yields rose across the board, the US Dollar Index surged, and gold plunged nearly $40 in a short squeeze—signaling an unexpected major bearish hit to gold. Weng Fuhao advises trading with the trend, focusing on shorting on rebounds. 😲
Gold, jolted by the nonfarm data, slid sharply in the short term before a minor rebound, with bearish signals across all timeframes. The data triggered an immediate breakdown, shifting the short-term trend to downward: on the 3-hour chart, moving averages formed a death cross, MACD showed a death cross with expanding volume, and gold prices fell below the Bollinger Band lower track, confirming a clear bearish momentum. 📉
🚀 Sell@3355 - 3345
🚀 TP 3335 - 3325 - 3315
Accurate signals are updated every day 📈 If you encounter any problems during trading, these signals can serve as your reliable guide 🧭 Feel free to refer to them! I sincerely hope they'll be of great help to you 🌟 👇
XAUUSD (GOLD): Buy setupXAUUSD (GOLD): Buy setup. check for 5m candle close and buy when the level is broken.
Cheers.
Gold lacks downward momentum.Today, gold is relatively quiet due to the impact of the US Independence Day holiday. Below, we continue to pay attention to the short-term quality layer of 3324. The key pressure above is maintained at yesterday's opening point of 3345-50. At midnight, gold rebounds near 3345-50 and can be shorted. The target is around 3330-33. It closes early at midnight and maintains a range of fluctuations! If your current gold operation is not ideal, I hope I can help you avoid detours in your investment. Welcome to communicate!
From the 4-hour analysis, pay attention to the support of 3324-30 below, focus on the support position of 3316, and pay attention to the short-term resistance of 3345-50 above. At midnight, the overall high-altitude low-multiple cycle participation remains unchanged. In the middle position, watch more and move less, be cautious in chasing orders, and wait patiently for key points to participate.
Go short before breaking 3350, go long before falling to 3320📰 News information:
1. Geopolitical situation
2. Tariff implementation and interest rate cut bill
📈 Technical Analysis:
As I said, the US stock market closed early today, and the market will lack some momentum. It is difficult to have a large fluctuation. It is expected to fluctuate and consolidate. I also explained in the previous post that the upper pressure in the short term is at 3340-3350. If it is touched, we can try to short and defend 3360. If it falls back to 3323, we can try to go long for the first time. If it continues to fall, it is expected to reach 3315-3305. Therefore, if it first touches 3323, go long, SL 3316, and consider going long if it touches 15-05 below.
🎯 Trading Points:
SELL 3340-33350
TP 3330-3320-3310-3300
BUY 3323
TP 3333-3340-3350
BUY 3315-3305
TP 3325-3333-3340
In addition to investment, life also includes poetry, distant places, and Allen. Facing the market is actually facing yourself, correcting your shortcomings, confronting your mistakes, and strictly disciplining yourself. I hope my analysis can help you🌐.
TVC:GOLD OANDA:XAUUSD FX:XAUUSD FOREXCOM:XAUUSD PEPPERSTONE:XAUUSD FXOPEN:XAUUSD
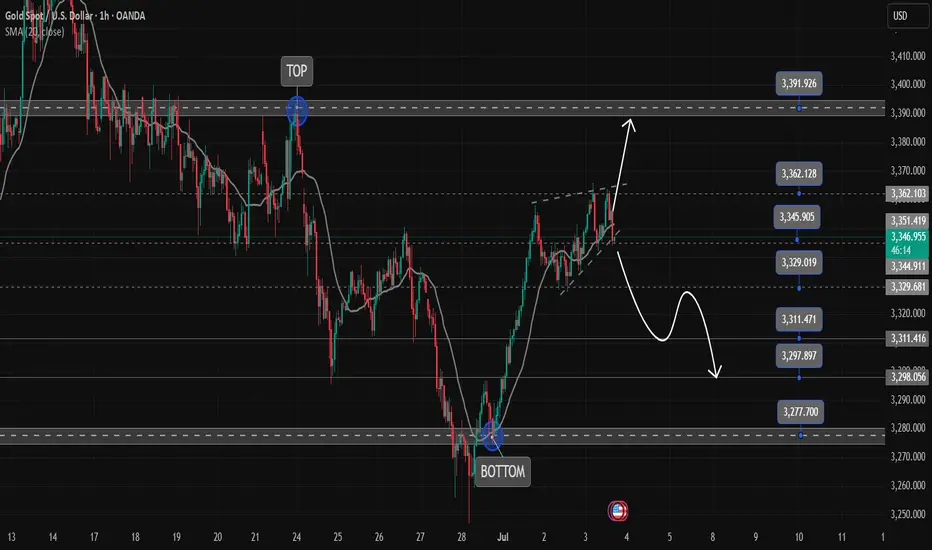
Gold Trading Strategy July 3✏️D1 candle continues to increase towards the price gap zone. At the beginning of the European session, sellers accept to enter the market at this resistance price zone around 3365. The accumulation pattern of gold price is forming a triangle pattern.
The lower boundary is broken, it will lead to the breakout point of the lower boundary and vice versa, if the upper boundary of the triangle is broken, the price will move towards the next resistance.
📉 Key Levels
Resistance: 3388-3363
Support: 3330-3311-3297-3277
Buy trigger: breakout above 3363
Sell trigger: breakout below 3330
If this idea resonates with you or you have other ideas, please comment. I look forward to reading your thoughts!
Best regards, VHT Traders!
Gold suffered a heavy blow from non-farm payrolls! Yesterday's decline in gold prices was mainly affected by news, and such declines usually do not last too long. From a technical point of view, gold prices received support near 3322 at night, which is the key support level today. It is worth noting that on Wednesday, gold prices were under pressure in the 3340-3344 area, while on Thursday, prices formed support in this range, indicating that the area is forming a top-bottom conversion, so 3340-3345 has become an important pressure level today. It is expected to fluctuate and consolidate in the 3322-3340/45 range during the day. The impact of news on gold prices is usually short-term. When the fundamentals and technical directions are consistent, price fluctuations will be more obvious; when the two are inconsistent, price fluctuations will weaken, but will not change the technical trend. The rebound pattern established at the beginning of the week is still valid. After a short-term shock, gold prices are expected to re-stand above 3345 and continue to maintain the rebound trend.

Important data such as non-agricultural are all negativeGold hourly chart;
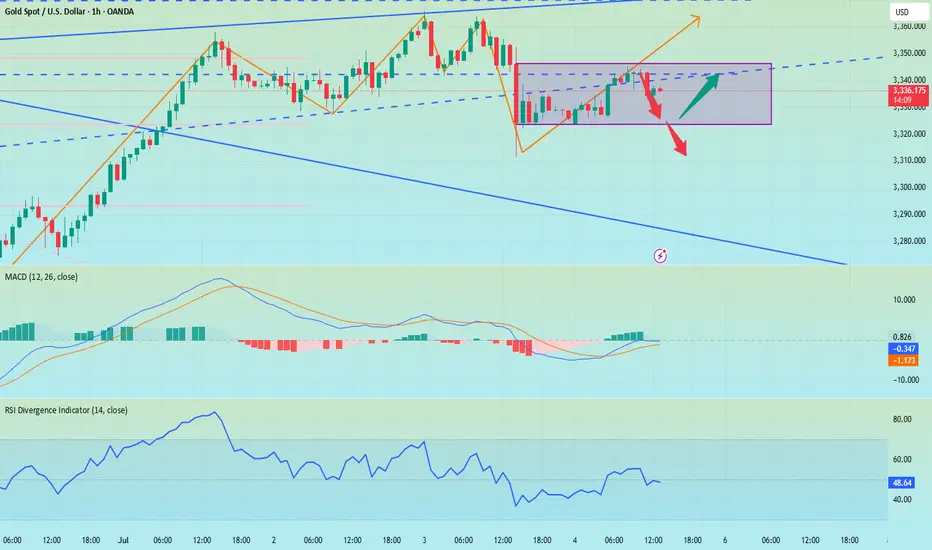
Gold short-term analysis; Gold 4-hour analysis shows that the stochastic indicator is golden cross, which is a bullish signal; MACD indicator double lines stick together upward, which is a bullish signal; 4-hour bias continues to rise; 4-hour downward trend channel is temporarily suppressed, and the pressure position is around 3355-60.
