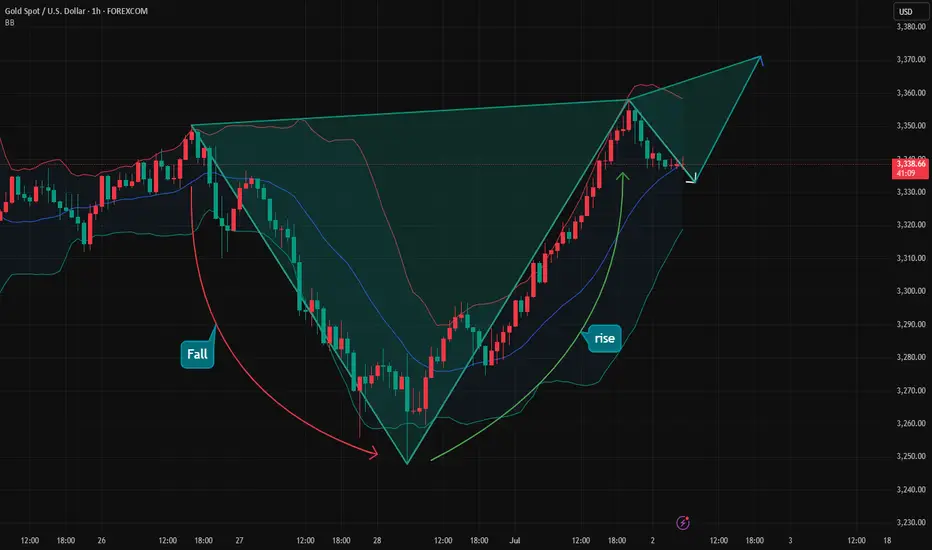
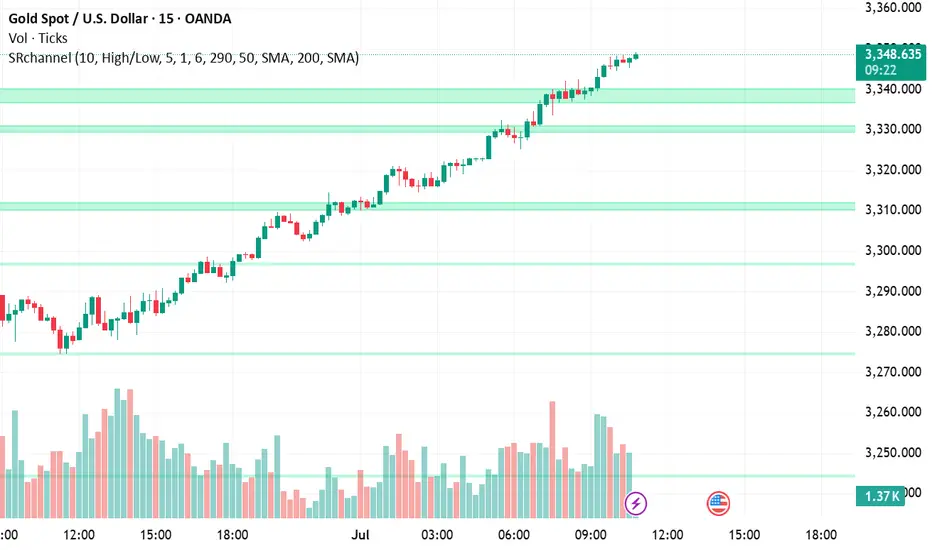
Gold may collapse again, don't get buried in it!In the past two trading days, gold began to rebound from a low of around 3245, and has now rebounded to around 3358, with a rebound of up to $113. Moreover, there has been no significant retracement during this rebound, indicating that gold has little intention to fall, and may even continue to rise.
But for me, gold rebounded from 3245. Even if a double bottom structure with 3275 as the secondary low was constructed on the technical level, it should not be enough for gold to rebound more than $113 in just two days as it fell below many supports in the early stage and bullish confidence suffered a serious blow. Moreover, it happened before the uncertain news of the NFP market.
So I have to consider that the market did it deliberately, and its primary purpose was to kill a large number of short chips in the market and lure more attracted long chips; secondly, the sharp rise before the NFP market may be to reserve room for the NFP market to fall in advance; in addition, I have to consider that the US dollar has fallen to a three-year low. If it continues to fall, there may be a global crisis of confidence in the US dollar, and the oversold rebound demand for the US dollar will also suppress gold.
Therefore, I still will not advocate chasing the rise of gold for the time being; on the contrary, I will actively seek opportunities to short gold in the 3350-3370 area; and once gold turns to a downward trend again, it may at least test the 3325-3315-3305 area downward in the short term.
Xauusdanalysis
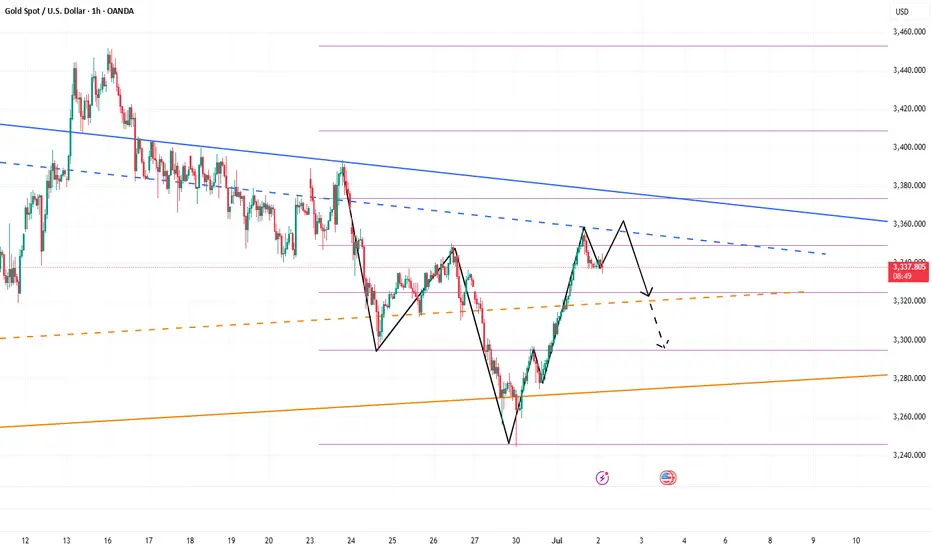
Gold (XAUUSD) – Bias for July 2Yesterday, price broke above the key H4 Lower High zone (3348–3350) with strong bullish momentum.
This breakout suggests a possible shift in the higher timeframe structure — indicating that the market may now be building toward a larger uptrend.
But we don’t chase breakouts — we prepare for the pullback phase .
🔍 What to Watch:
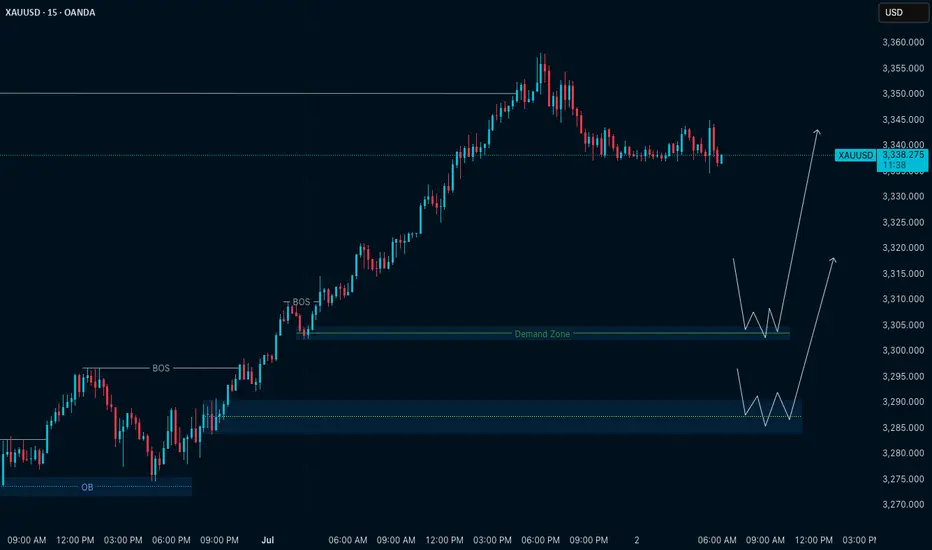
At present, M15 remains in a clean uptrend , fully in sync with the new H4 structure.
This multi-timeframe alignment gives us a clear bullish bias — but not an entry by itself.
We now need to see how price develops the pullback.
The best trades come when structure retraces with clarity — and confirms before continuation.
📍 Key M15 Level to Track:
• 3302 – Current M15 Higher Low
→ If this level holds, we may see a continuation of the uptrend from here.
→ If it breaks, the next potential reversal zone is around 3290 , where demand may reappear.
🎯 Execution Plan:
The trend is now clearly bullish across HTF and LTF.
We will only look for long setups , and only where structure confirms — either at the current HL or at deeper demand zones.
No confirmation = No trade.
No alignment = No edge.
Let price come to you. Our job is not to anticipate, but to align.
📖 From the Mirror Philosophy:
“In trend-following, the edge lies in waiting — not in chasing.
The market will reflect your patience back at you.”
📘 Shared by @ChartIsMirror
Author of The Chart Is The Mirror — a structure-first, mindset-grounded book for traders
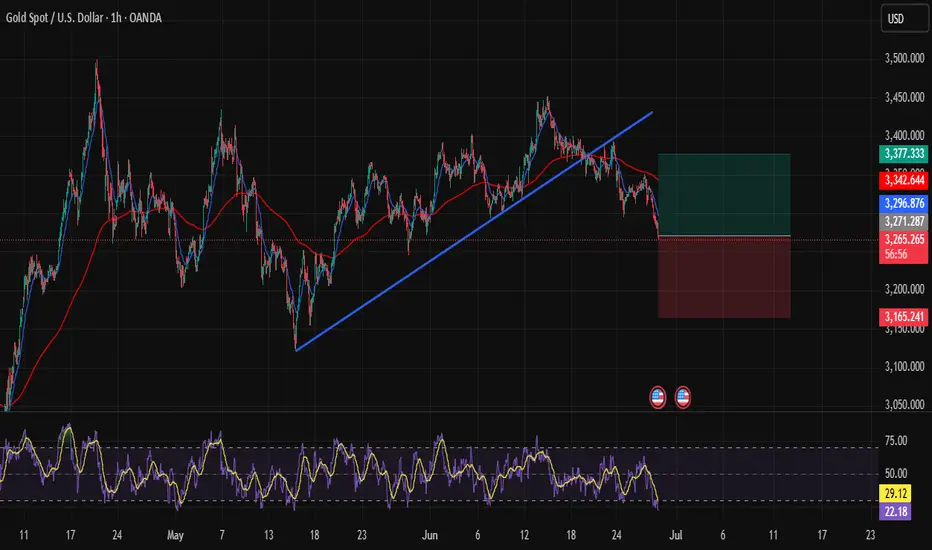
Catching the Perfect Rebound on XAUUSD!Hi traders! , Currently analyzing GOLD (XAUUSD) on the 1H timeframe.
Price has dropped aggressively but is now reacting strongly from a key support zone around 3,271.00, where buyers are stepping in. This area has previously shown significant bullish reactions.
I'm now buying from 3,271.00, expecting a bullish correction towards my target.
Take Profit: 3,377.00
Stop Loss: 3,165.00
RSI is in oversold, indicating potential exhaustion of sellers.
Price may have created a fake breakout below the trendline, trapping liquidity before bouncing back.
Currently managing the trade, watching how price develops around this key area.
Disclaimer : This is not financial advice. This is my personal analysis shared for educational purposes only.
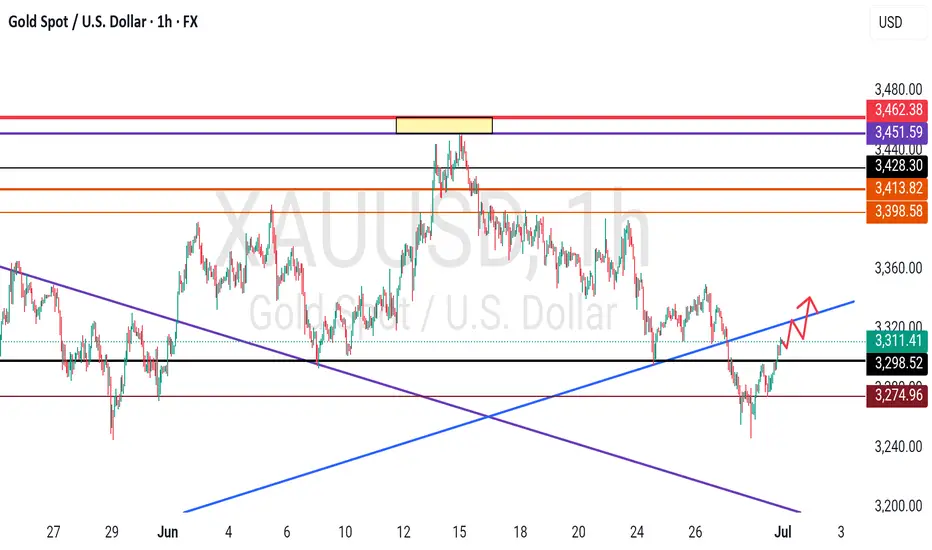
Gold operation suggestionsLooking back at the market in May and June, although gold has experienced adjustments, its shape is very resilient. In the monthly cycle, the price of gold is firmly above the MA5 moving average. From the perspective of large-cycle technical analysis, this is a typical strong bullish pattern, demonstrating the strong control of the bulls. As the adjustments are gradually in place, the later bullish outbreak is worth looking forward to. However, the adjustment to 3247 this time is not small, so in the short term, the gold price is likely to fluctuate upward. At present, 3451 is an important watershed. Once it is effectively broken through, the gold price is expected to hit the 3500 mark, and I personally believe that 3500 will not be the end point, and it is expected to be refreshed later.
GOLD - at CUT n REVERSE area? Holds or not??#GOLD ... Perfect holdings of our upside resistance area that was actually 3357
And now market just at his current ultimate supporting area, that is 3336-37
Keep close that area and if market thold it in that case we can expect again bounce otherwise not.
NOTE: we will go for cut n reverse below 3336-37
Good luck
Trade wisely
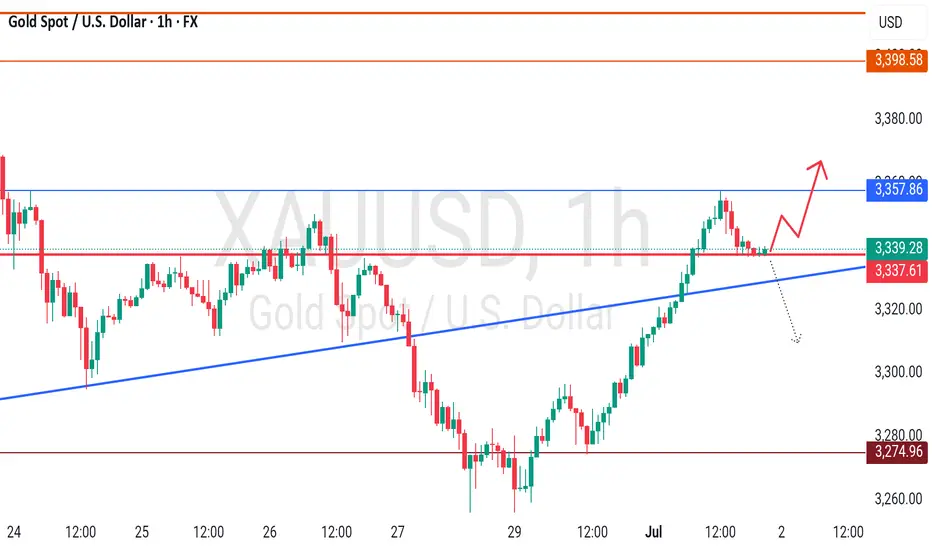
Short gold, it may retreat again after reaching 3340-3350Although the rebound in gold has exceeded my expectations to a certain extent, it is obviously not a good time to chase the rise in gold. The gold rebound mainly benefits from Trump's repeated requests for the Federal Reserve to cut interest rates, which has led to the continued weakness of the US dollar. In fact, we can clearly see that the gold rebound is not supported by trading volume, and the rebound without volume may face the risk of collapse again at any time. So I don't advocate chasing long gold at present.
Currently, gold has rebounded to around 3339, almost recovering most of the losses in the previous downward wave (the starting point of the previous wave was 3350), but gold is still under pressure in the 3340-3350-3355 area. In the absence of volume support, gold may fall again after touching this resistance area.
Therefore, shorting gold is still the first choice for short-term trading at present; at least make sure not to chase high!
You can consider shorting gold with the 3340-3350-3355 area as resistance, and look at the target: 3320-3310-3300
Gold retreats as expected, how to trade in the future📰 News information:
1. Geopolitical situation
2. PMI data
3. Global Central Bank Governors Meeting
📈 Technical Analysis:
Our short orders have achieved profits. I closed the position near 3337, turning losses into profits. Interested friends can follow my previous post. In the short term, I am still optimistic that gold will retreat below 3335-3325. Today, gold rose sharply, and the rebound momentum was strong, while the short-term correction was slightly weak, so the space for a second decline in the short term will be limited. If it falls to the 3333-3323 range during the day and gets effective support, you can consider going long. The short-term upper resistance is 3360-3375.
🎯 Trading Points:
BUY 3333-3323-3315
TP 3341-3355-3360-3375
In addition to investment, life also includes poetry, distant places, and Allen. Facing the market is actually facing yourself, correcting your shortcomings, confronting your mistakes, and strictly disciplining yourself. I hope my analysis can help you🌐.
TVC:GOLD OANDA:XAUUSD FX:XAUUSD FOREXCOM:XAUUSD PEPPERSTONE:XAUUSD FXOPEN:XAUUSD
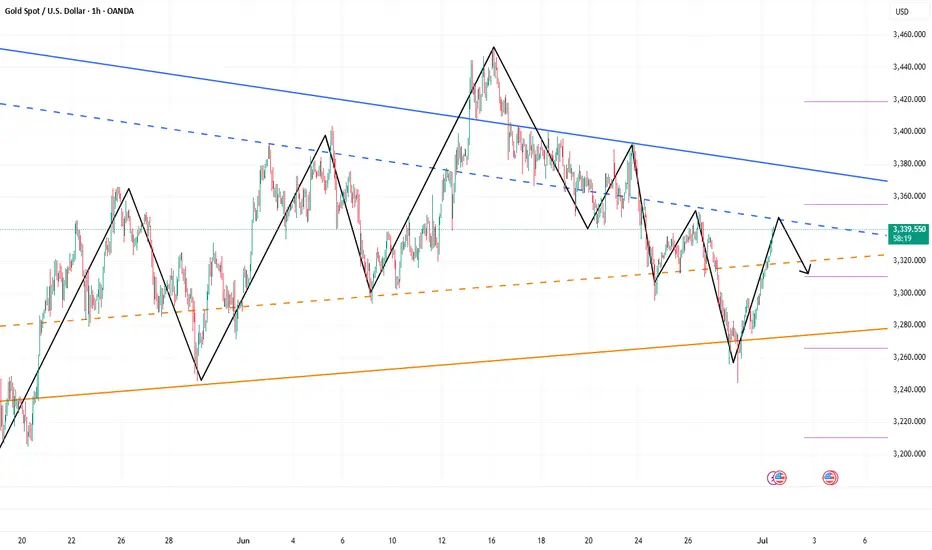
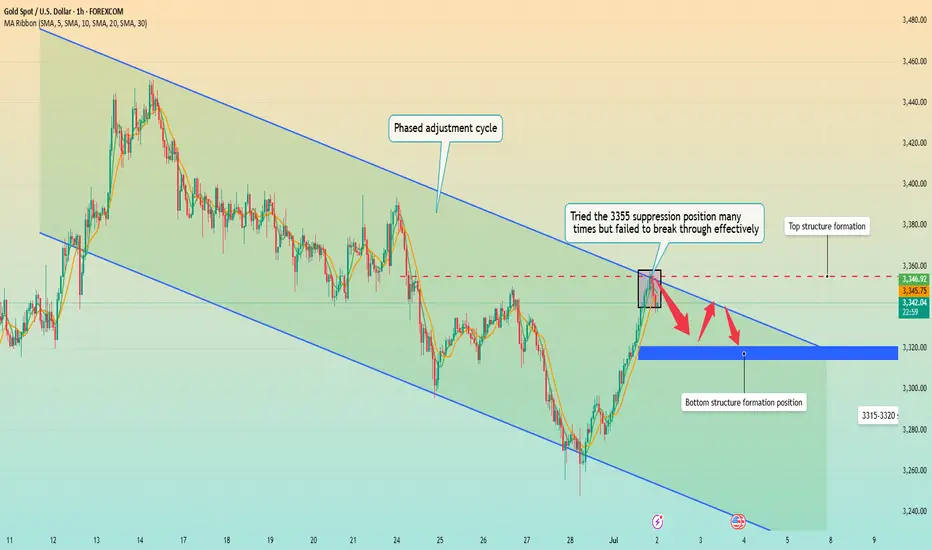
Gold falls back, is a bottom structure emerging?In terms of one-hour structure, this round of phased adjustment started from 3450 has not ended yet, but it will soon, especially the rapid rebound after the bottom of 3260 on Monday. This rebound has strong momentum. After bottoming out and rebounding, it is currently fluctuating around 3340, with a large overall span. This also shows that after the price has risen, the amplitude of the correction has increased, which means that the upward space is limited. This adjustment is likely to be over soon, but there is no definite bottom structure yet, so we need to wait for some time.
Before going out of the definite bottom structure, based on the principle of following the trend, you can try to short with a light position. At present, in terms of the one-hour pattern, the key point is here at 3355, and it is currently falling back from this position to 3340. If it falls back to the 3320 area today and stabilizes above it, you can operate a long strategy. On the whole, Quaid suggests that the short-term operation strategy for gold today should be mainly long on pullbacks, supplemented by shorting on rebounds.
Operation strategy:
Short at 3345, stop loss at 3355, profit range 3330-3325.
Long at 3320, stop loss at 3310, profit range 3340-3345.
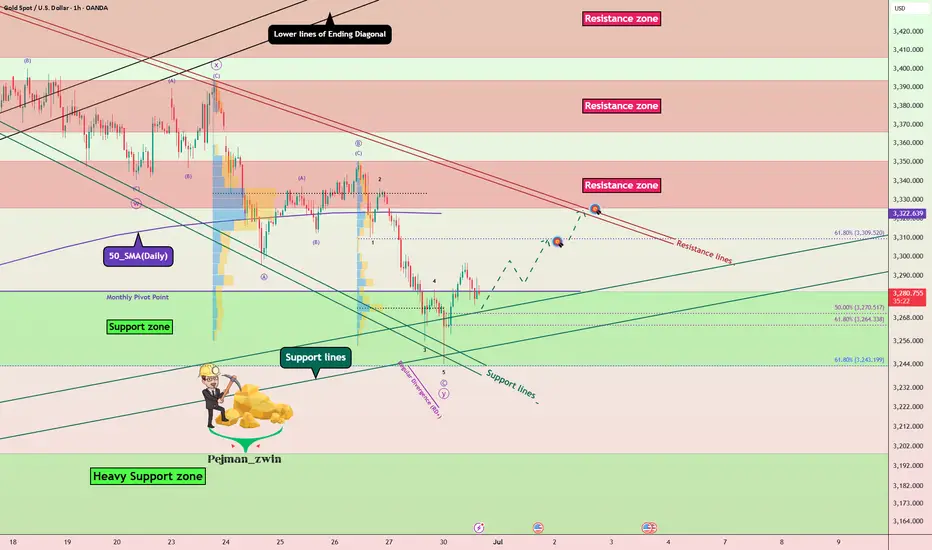
Gold Rebound Underway – Support Zone Holds Strong! - Short termGold( OANDA:XAUUSD ), as I anticipated in the previous idea , has attacked the Support zone($3,281-$3,243) and Support lines .
From an Elliott Wave theory perspective , it appears that Gold has completed 5 sub-waves of the main wave C .
Also, we can see the Regular Divergence(RD+) between Consecutive Valleys.
I expect Gold to rise to at least $3,307 in the coming hours.
Second Target: $3,321
Note: Stop Loss (SL) = $3,240
Gold Analyze (XAUUSD), 1-hour time frame.
Be sure to follow the updated ideas.
Do not forget to put a Stop loss for your positions (For every position you want to open).
Please follow your strategy; this is just my idea, and I will gladly see your ideas in this post.
Please do not forget the ✅ ' like ' ✅ button 🙏😊 & Share it with your friends; thanks, and Trade safe.
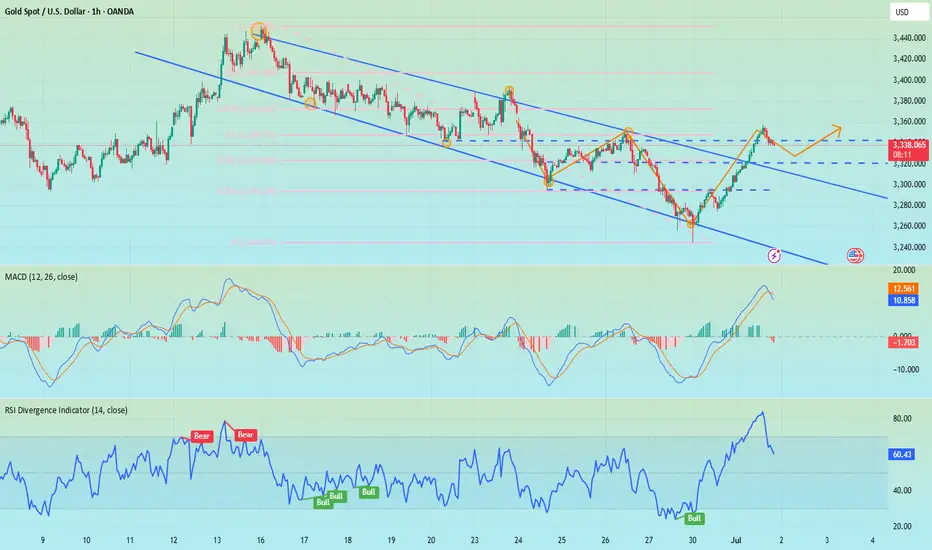
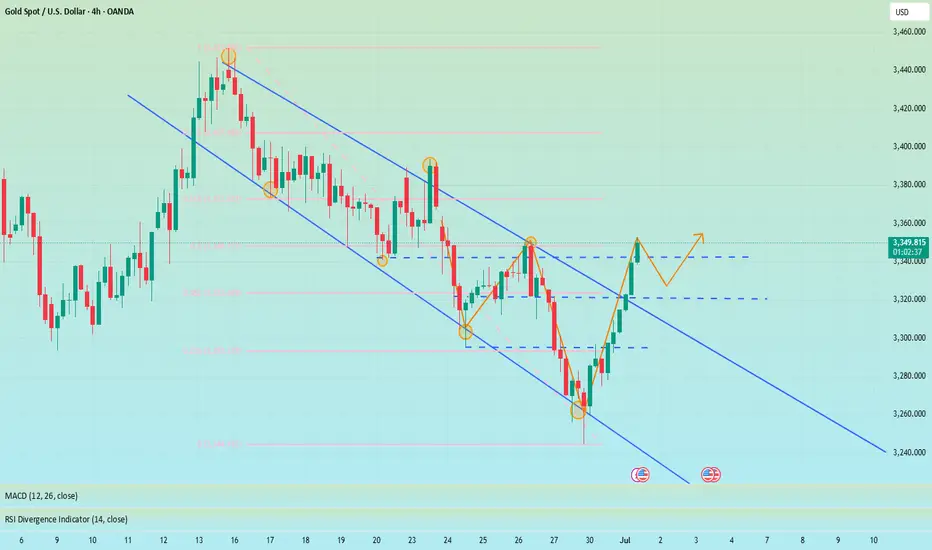
Can gold hit a new high again?During the U.S. trading session, spot gold trended higher in a volatile manner, reaching a three-day high of 3,357.88 as of 22:30. The rally was primarily driven by a weaker U.S. dollar, heightened uncertainty over U.S. trade agreements, and intensified market expectations for Federal Reserve rate cuts. The global economic uncertainties have highlighted gold's safe-haven value. Market participants should monitor the negotiation progress ahead of the tariff deadline on July 9. Traders have priced in at least two rate cuts in 2025. This Thursday's U.S. employment report may catalyze a decline in U.S. Treasury yields. Trump plans to replace Powell, demanding that the new chairman supports rate cuts. The market is focused on this week's ADP and non-farm payroll data to gauge the Fed's policy trajectory.
From a 4-hour technical perspective, the MACD has formed a bullish divergence, triggering a rebound with expanding red histogram bars. Prices are advancing along short-term moving averages, breaking through the previous range of resistance levels, indicating a short-term bullish trend. Before the non-farm payroll data, prices are expected to remain range-bound, with attention paid to safe-haven demand triggered by geopolitical risks. Focus on the opportunity for a secondary rally after the end-of-session pullback confirmation. Short-term resistance is seen at the 3,375-3,380 zone.
On the hourly chart, prices are in a narrow high-range consolidation with limited pullback momentum. Candlesticks maintain strength by relying on short-term moving averages.
you are currently struggling with losses,or are unsure which of the numerous trading strategies to follow,You have the option to join our VIP program. I will assist you and provide you with accurate trading signals, enabling you to navigate the financial markets with greater confidence and potentially achieve optimal trading results.
Trading Strategy:
buy@3330-3335
TP:3360-3365

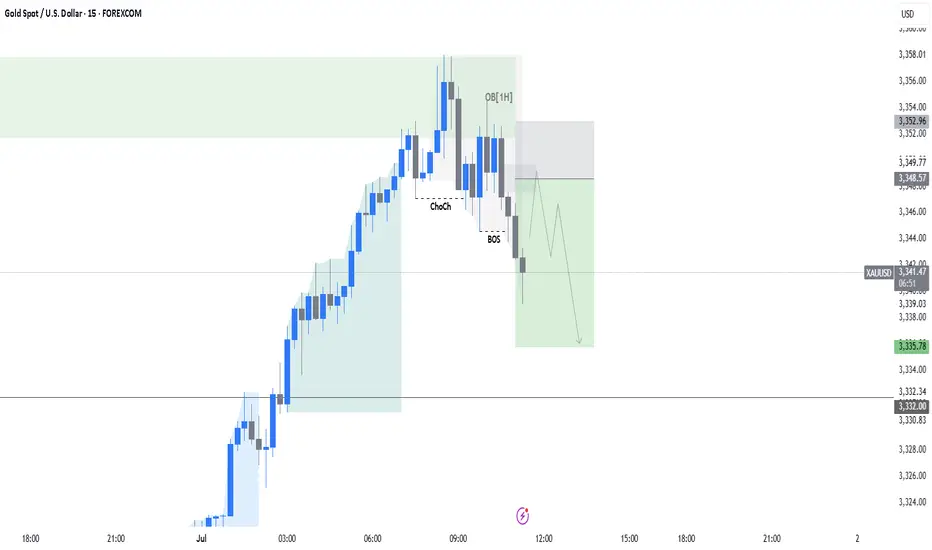
XAU/USD : GOLD AnalysisGold now shifts its direction downward as it was rejected from an hourly Order Block.
I am planning a short position in it, you guys can trade accordingly by managing your risk
Gold price rises by more than $100, will the bull run continue?📰 News information:
1. Geopolitical situation
2. PMI data
3. Global Central Bank Governors Meeting
📈 Technical Analysis:
The NY session is about to begin, and there are two things we need to pay attention to. First, the PMI data, and second, the talks between global central bank governors. If Powell again hints that the inflation outlook is weaker than expected, this will increase the Fed's easing bets and trigger a new round of decline in the US dollar. The dovish tone may help gold prices to further rebound. On the contrary, if Powell makes some hawkish or cautious remarks, this may exacerbate the recent downward trend in gold prices. The key point at present is the 3350 mark. If the 4H closing line of the NY session remains below 3350, then in the short term we are expected to continue to retreat to the 3330-3320 range. If the 4H closing line is above 3350 and stabilizes, gold may rebound to the 61.8% position, which is around 3372.
🎯 Trading Points:
SELL 3340-3350-3355
TP 3330-3325-3320
BUY 3330-3320
TP 3340-3350-3372
In addition to investment, life also includes poetry, distant places, and Allen. Facing the market is actually facing yourself, correcting your shortcomings, confronting your mistakes, and strictly disciplining yourself. I hope my analysis can help you🌐.
FX:XAUUSD FXOPEN:XAUUSD PEPPERSTONE:XAUUSD FOREXCOM:XAUUSD FX:XAUUSD OANDA:XAUUSD TVC:GOLD
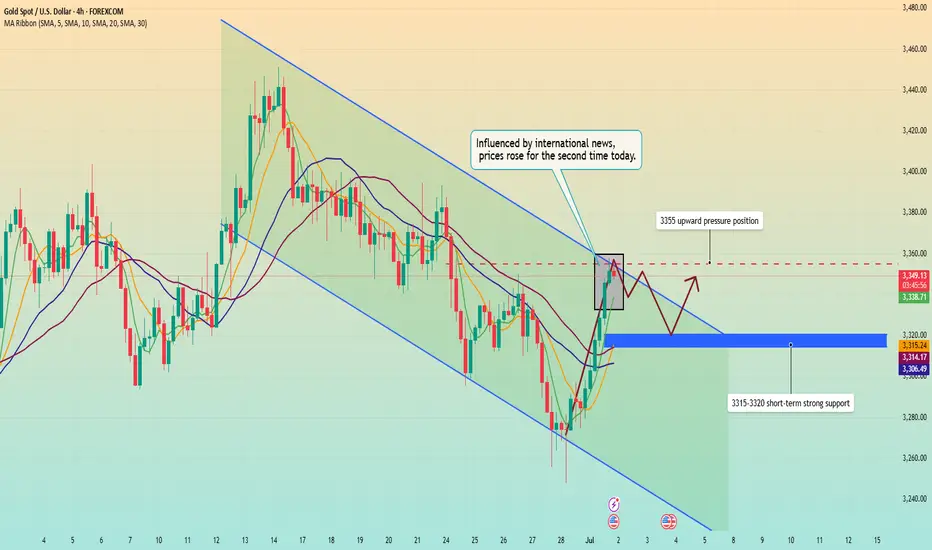
Gold surged and then fell. Has it reached its peak?Information summary:
Today, the United States and Japan negotiated on tariffs. Trump said that the US-Japan deal was unfair and might send a letter to Japan; the US-Japan trade negotiations seemed to be at a standstill. Trump also threatened that he would not extend the expiring tariff period and would send letters to most countries and regions in the next few days.
Secondly, the United States accused the EU of unfair digital legislation and asked the EU to relax its supervision of US technology giants. In addition, Trump accused "Mr. Too Late" Powell and the entire committee on social media that they should be ashamed of not cutting interest rates.
Affected by the above news, gold's risk aversion sentiment heated up and prices started to rise for the second time.
Market analysis:
From the 4-hour chart, the market is currently in a slow upward trend in a downward channel, and the price is also repeatedly testing the upward pressure position of 3355. MA5-day and 10-day moving averages turned upward and crossed with the 20-day and 30-day moving averages. At present, the upward momentum is slightly insufficient. In the short term, we should focus on the suppression position of 3355. If we fail to break through this position for a long time, the trend will most likely turn into a downward trend. If no black swan event occurs, today's price will most likely fluctuate around the 3320-3350 range. If there is no black swan event, the price today will most likely fluctuate around the range of 3320-3350.
Operation strategy:
Short near 3355, stop loss 3365, profit range 3340-3330.
Long near 3315 when the price falls back, stop loss 3305, profit range 3340-3345.
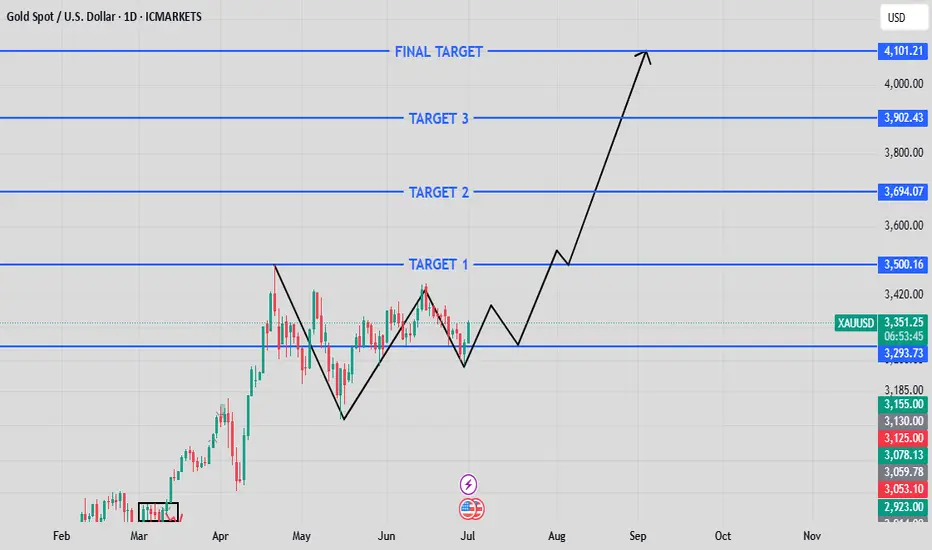
XAUUSD MONTHLY/WEEKLY ANALYSISWhat we’re seeing here on **XAUUSD (Gold Spot)** is a **classic higher-timeframe accumulation pattern** followed by **a potential explosive bullish leg**.
After a strong move up in April, we witnessed a **textbook V-reversal**, consolidation, and now — **a higher low** forming around the \$3,290 zone. That’s our key demand level. 💥
✅ If this higher low holds and price starts pushing with volume, we may be gearing up for a **multi-phase breakout** with the following potential targets:
🔹 **Target 1:** \$3,500
🔹 **Target 2:** \$3,694
🔹 **Target 3:** \$3,902
🎯 **Final Target:** \$4,101+
This isn’t just a short-term scalp setup. This is a **position trade opportunity** for those with patience and precision. The structure is clean, momentum is returning, and the levels are marked.
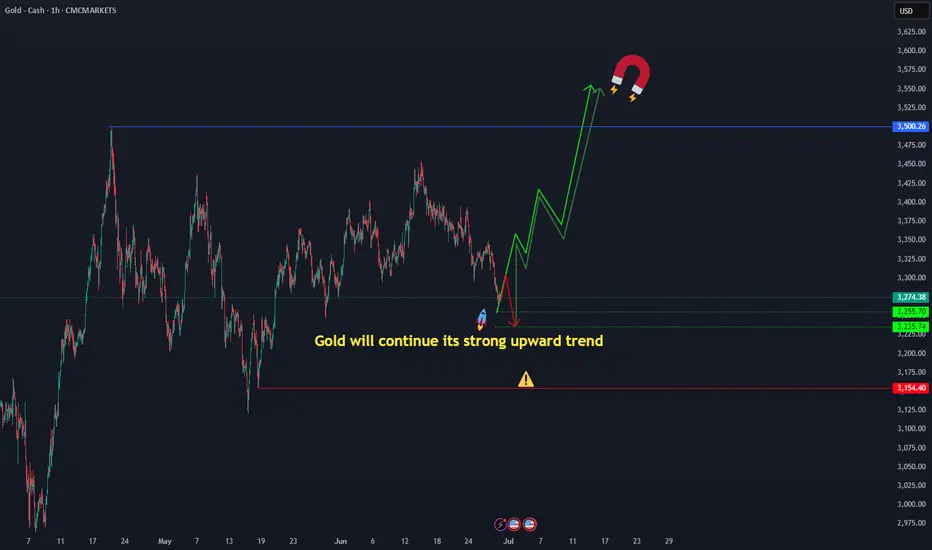
gold strong upwardGold will continue its strong upward trend, the corrections seem to have come to an end, the gold price is certain to reach above $3500, if the current price and the price of 3235 break down, you should not panic, the direction of the gold price movement is still towards the ceiling ( ATH ) CMCMARKETS:GOLD
#XAUUSD:First Buy, Then Sell Swing! Big Move In Making! Gold failed to decline further as previously predicted in our analysis. Instead, it continues to exhibit bullish sentiment. The current price trading in a critical region between 3350 and 3360, where significant resistance is observed. We anticipate that the price must pass through this region before it can clearly surpass the 3400 mark.
When this occurs, it is advisable to implement precise risk management strategies while trading gold due to its volatile nature. Additionally, the DXY index is experiencing a decline and currently trading at its all-time low since 1976. This development will likely have a substantial impact on the gold price.
We wish you the best of luck and ensure safe trading practices.
Kindly consider liking, commenting, and sharing this idea.
Team Setupsfx_
❤️🚀
gold on sell retest#XAUUSD price have retest 3350 which have short bearish retest, fundamental is possible to change market direction.
Sell limit 3350, target 3336-21, stop loss 3360.
2 times breakout above 3353 today high will continue bullish till 3370 bearish retracment.
GOLD - bottom out here? What's next??#GOLD.. perfect move as per our analysis and now market looking bottom out here.
Our immediate supporting area is now 3298-98
Keep close with and keep in mind that
We will go for cut n reverse below 3298 on confirmation .
Good luck
Trade wisely
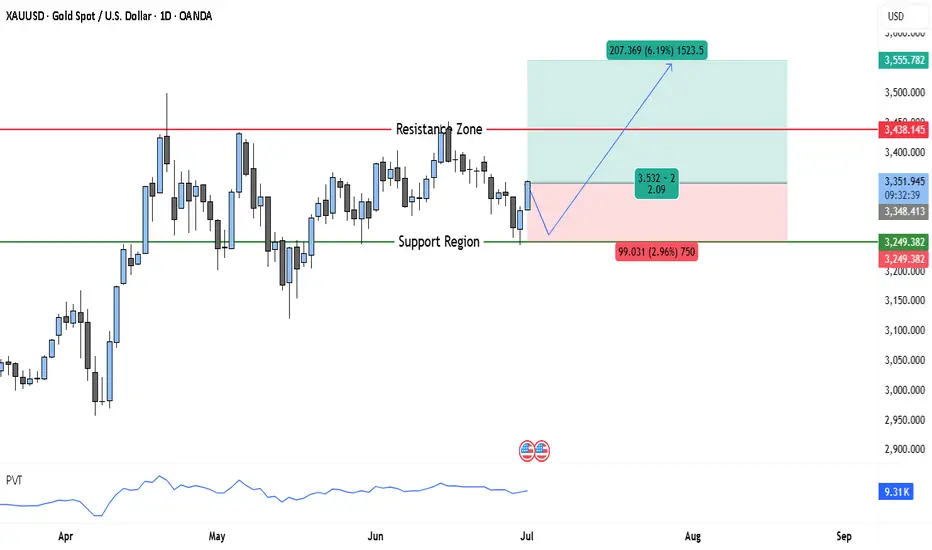
Gold Bulls Ready to Charge: $3,500 Target Could Be Days AwayThe chart shows a strong medium-term uptrend in gold that began in late 2024, carrying the price steadily higher through the first half of 2025. After peaking, price has been consolidating in a clear range bounded by a well-defined resistance and support zone.
The Resistance Zone is marked around $3,438, where price has been repeatedly rejected. Each time the market approached this level, sellers stepped in, causing retracements. This reinforces the area as a significant supply zone.
Below, the Support Region near $3,249–$3,250 has provided a floor for price action. It’s notable that this area was once a resistance, making it a classic breakout-retest structure. Buyers have stepped in multiple times to defend this level, indicating healthy demand that aligns with the broader bullish trend.
The recent candles suggest the market is trying to build momentum for another test of the resistance. Wick rejections near support indicate that buyers are showing interest again. At the same time, the overall structure remains constructive, with higher highs and higher lows visible on the longer timeframe.
The Price-Volume Trend (PVT) indicator along the bottom is gradually climbing, which suggests accumulation is still happening beneath the surface. This can be a signal that a fresh breakout attempt is brewing.
Trade Setup
Here’s how the trade idea is structured visually on your chart:
• Entry Zone: Around $3,348, near the midrange and just above support.
• Stop-Loss: ~99 points below the support area (around $3,249), offering a cushion against volatility.
• Target: Approximately $3,555–$3,560, the next major resistance above the current consolidation.
• Reward Potential: ~207 points (6.19%) upside.
• Risk-Reward Ratio: ~2.09, which is a favorable setup for a trend continuation trade.
Analysis Summary
This is effectively a range-bound bullish continuation setup. The idea is to enter on support retest and ride the next impulse leg higher. Price is consolidating above the former breakout area, with clear evidence of accumulation on the PVT. If gold can close convincingly above $3,438, it will likely trigger breakout buying interest and stop-loss clusters from short sellers, which could drive price rapidly toward your target.
However, keep in mind that failure to hold above $3,249 support would invalidate the setup and could lead to a deeper correction or range breakdown. For this reason, your stop-loss level is well-placed to limit risk.
#XAUUSD 30MIN 📉 #XAUUSD 30m Sell Setup – Bearish Continuation Ahead
Gold is currently retracing after a strong drop, consolidating within a short-term Supply Zone. We anticipate a temporary bullish push toward the 3345–3350 premium area, where the broader bearish trend is expected to resume.
🔻 Sell Zone: 3345 – 3350 (Supply / OB Zone)
🎯 Targets: 3300 → 3260
❌ Stop Loss: Above 3358
⚠ Note: This is a short-term retracement, not a trend reversal.
We expect selling pressure to return once price taps into the 3350 Order Block, in line with the higher timeframe bearish structure.
#gold #XAUUSD #forexsignals #SmartMoney

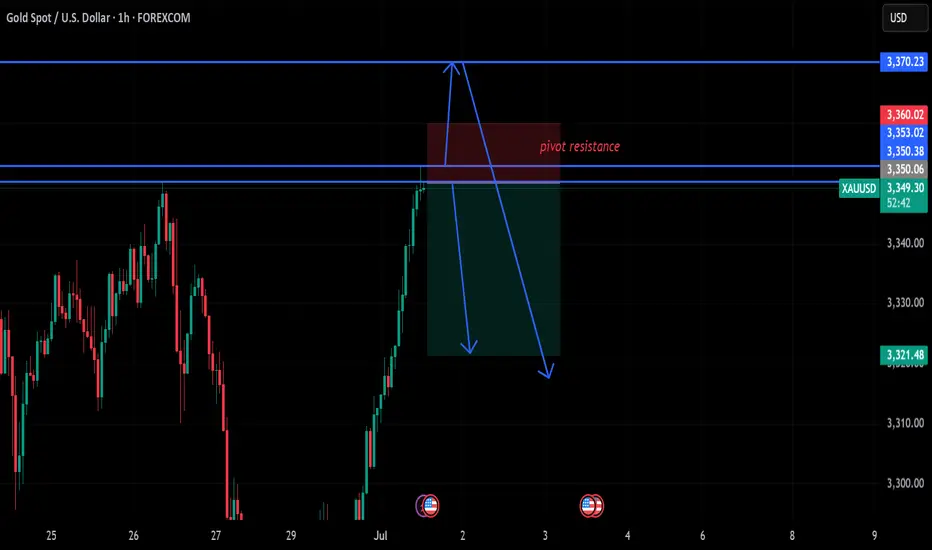
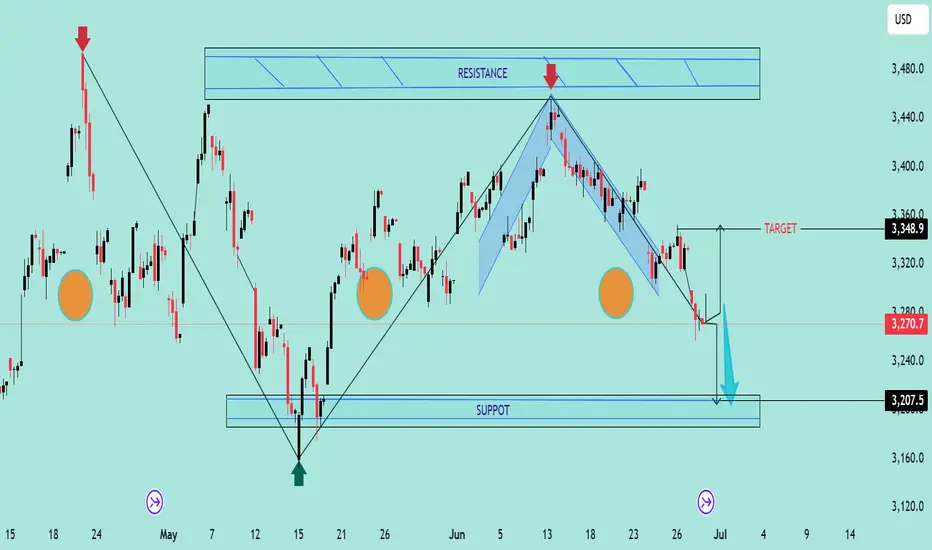
Double Top Breakdown at Resistance ZoneThe chart reveals a classic Double Top pattern formation near the 3,360–3,480 resistance zone, followed by a clear bearish rejection (highlighted with red arrows). This confirms the presence of strong supply pressure in that region.
🔍 Key Technical Highlights:
🔺 Double Top Pattern
The price formed two swing highs near the resistance zone, failing to break above.
After the second peak, the price started declining, confirming the reversal pattern.
📉 Bearish Channel
The recent downtrend is contained within a descending channel, with consistent lower highs and lower lows.
Price broke below the neckline of the double top pattern around 3,270.
🎯 Target Projection
Based on the height of the double top pattern, the projected downside target is near 3,207.5, aligning perfectly with the support zone marked below.
🟠 Historical Support Areas
The large orange circles indicate key reaction points, confirming that the 3,207–3,220 area has acted as support in the past.
📊 Outlook:
If the current bearish momentum continues, price is likely to head towards the support target zone at 3,207.5. Any pullback toward 3,320–3,350 could provide a shorting opportunity with stops above the recent highs.
🔧 Bias: Bearish
📍 Resistance: 3,360–3,480
📍 Support: 3,207–3,220
📍 Target: 3,207.5
XAU/USD – Bullish Trend Faces Resistance at $3,350 XAU/USD – Bullish Trend Faces Resistance at $3,350 | Watch for Breakout or Pullback!
📅 Published on: Jul 01, 2025
✍️ By: MR_MARK0
🧠 Market Context:
Gold (XAU/USD) has been riding a strong bullish wave, pushing through multiple resistance levels. Currently, price is hovering just below the $3,350 resistance, which marks a critical level for either trend continuation or a potential pullback. Momentum remains in favor of buyers, but signs of exhaustion are beginning to surface.
🔍 Key Zones:
🔴 Resistance Zone: $3,350.0 – $3,352.5
🟢 Support Zone: $3,338.0 – $3,340.0
🟢 Demand Block: $3,310.0 – $3,315.0 (bullish base before recent breakout)
📌 Strategy in Play:
The chart reflects a Trend Continuation Strategy with key support/resistance zones identified. Price has shown strength, but we are now at a make-or-break level. Patience is crucial here.
🧭 Trade Idea:
🔁 Buy the Dip:
Entry Zone: $3,340 – $3,342
SL: Below $3,338
TP1: $3,352
TP2: $3,360
🔁 Breakout Play (Aggressive):
Entry: On breakout above $3,352 with bullish volume
SL: Below breakout candle low
TP: $3,360 and $3,372
⚠️ Risk Note:
Price is extended; a fake breakout above $3,350 may trigger a bull trap. If price fails and drops below $3,338, expect a corrective move toward $3,330 – $3,310. Watch volume divergence and candle rejection patterns.
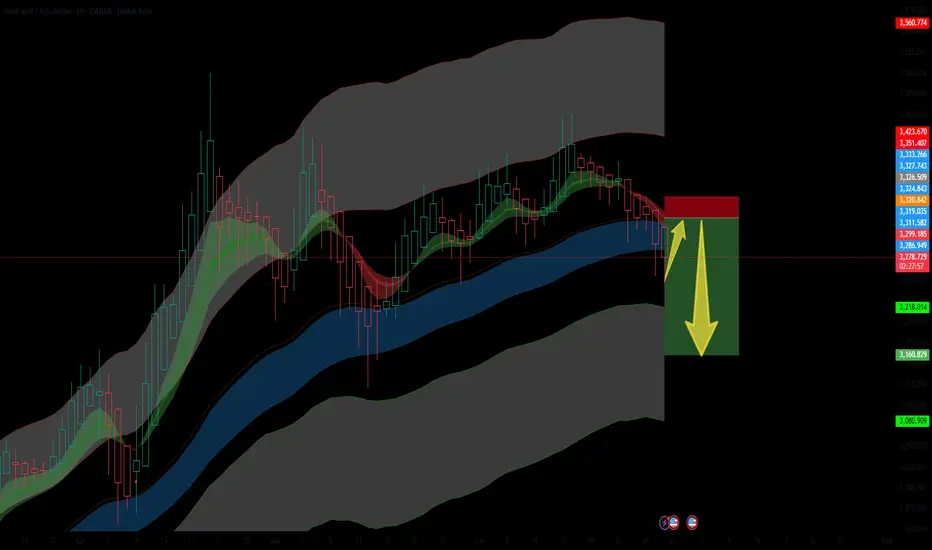
Bearish Setup for GoldGold is currently in a retracement phase after breaking below the mid Keltner channel zone. The small upward arrow marks this temporary relief rally, which I anticipate will be short-lived.
Price is testing the lower band of the inner Keltner channel after rejecting from the upper zones. The structure suggests a classic lower high formation before a potential major sell-off, targeting the deeper liquidity zones around $3,218 – $3,160 and possibly $3,080 if momentum accelerates.
📉 Bias: Bearish
📌 Invalidation: A clean break and close above the red resistance block (~$3,320+)
📌 Target Zones: $3,218 → $3,160 → $3,080
🔔 Look for volume drop and wick exhaustion confirming the next leg down.
This retracement may offer one final short entry opportunity before a deeper correction unfolds.