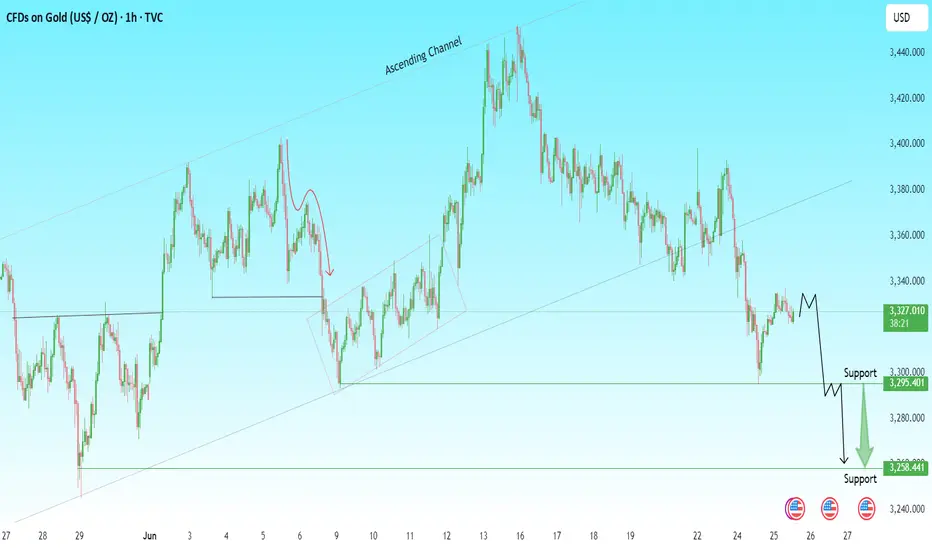
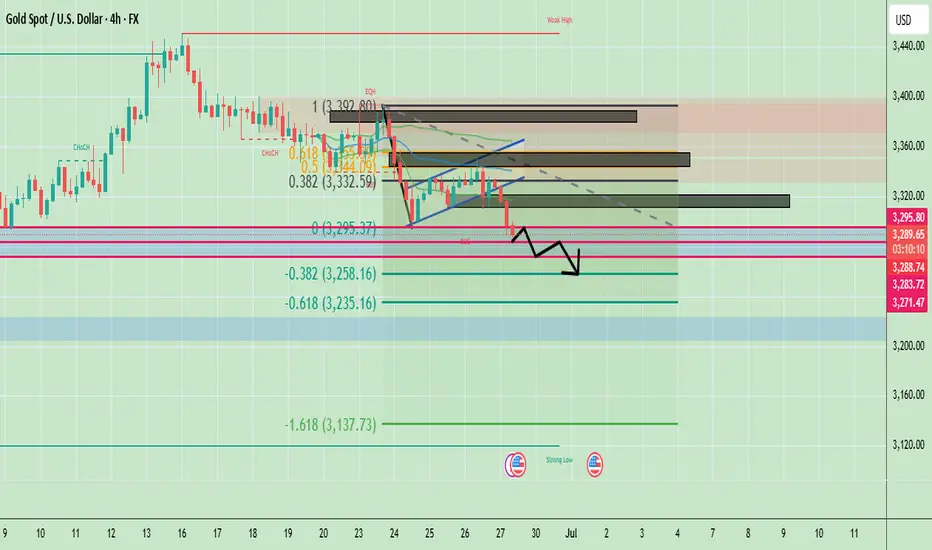
XAUUSD Bearish Setup | Support Levels in SightGold has broken down from the ascending channel, indicating a potential shift in market structure toward bearish momentum.
🔎 Technical Highlights:
Clear breakdown from the ascending channel
Price currently facing resistance near $3,323
Two key support zones:
🟩 First Support: $3,295 – potential bounce area
🟩 Second Support: $3,258 – deeper downside target
📊 Short-Term Outlook: Expecting a minor pullback before continuation lower toward the $3,295 support. If that level fails to hold, the next target becomes $3,258.
💡 Trade Idea: Watch for rejection below $3,323 for a possible short opportunity targeting $3,295 and $3,258. Keep an eye on momentum and volume.
🔔 Note: Always use proper risk management. This setup is based on current price action and may change with market dynamics.
Xauusdanalysis
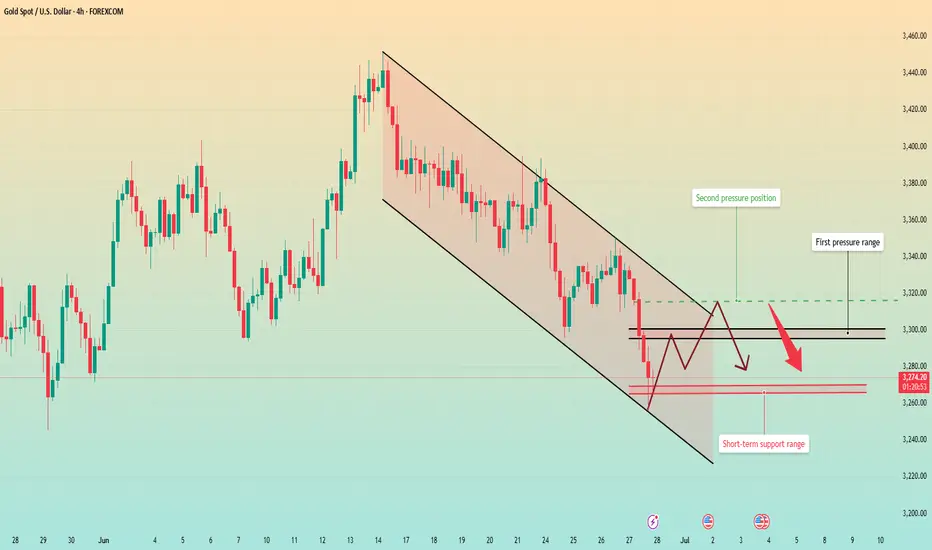
The data is negative. Will the price rebound from the bottom?Gold prices have continued to fall since the high near 3450. This trading day started the downward mode near 3328, and the European session continued to fall, breaking a new low. The negative PCE data also continued the downward mode. So far, it has rebounded after hitting the lowest level near 3255. However, the rebound is small, and the upper pressure is still very strong.
From the 4-hour chart, short-term resistance focuses on the vicinity of 3295-3300, followed by important pressure near 3315. The short-term support below focuses on the vicinity of 3265-3270. The overall strategy of shorting at high positions remains unchanged based on this range.
Operation strategy:
Short at the price rebound near 3295, short covering at the high point of 3315, stop loss 3325, profit range 3370-3360.
At present, the price fluctuates greatly. If you want to try scalping transactions, you can trade with a light position and float up and down 5 points to stop loss or profit in time.
This is the last trading day of this week. I hope you all will gain something and have a happy weekend with your family.
Gold Analysis and Trading Outlook – June 27Good morning, everyone!
Yesterday, gold encountered resistance in the 3348–3352 zone and fell back to around 3310 before rebounding toward the 3336 resistance area. Today’s session opened with renewed weakness, and so far, the overall price action has closely followed our expectations. Whether it was selling near resistance, buying after the dip, or shorting the rebound, each opportunity yielded solid profits.
Some traders have asked about my strategy’s win rate. Those who’ve followed consistently already know—the overall win rate has remained above 80%, with very few instances of error. Even in the rare case of a misjudgment, I apply specific recovery strategies to minimize risk and avoid large losses. That’s the core reason why I’m confident I can help many traders.
Technically, the daily chart still shows a bearish trend, and prices are now approaching the key 3300 support zone. While the current geopolitical uncertainty adds complexity, it doesn't prevent us from executing flexible intraday trades. In fact, range-bound markets can still be highly profitable with a disciplined approach.
Key intraday levels to watch:
Dynamic support: 3318–3313
Major support: 3300–3287
Resistance levels: 3336, 3348–3352, and 3370
Today’s trades can continue to focus on these levels, using a sell-high, buy-low strategy with flexibility.
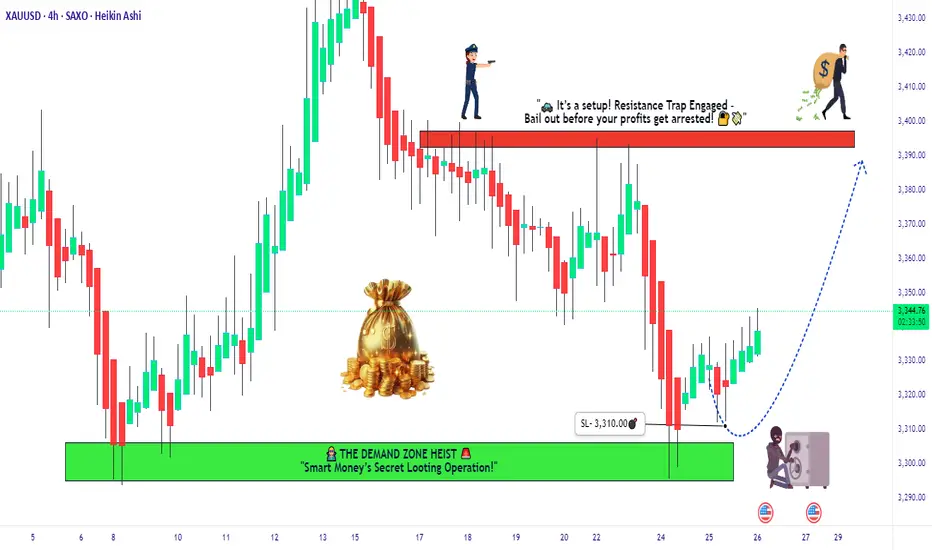
"Gold Vault Breach! XAU/USD Heist Plan in Motion"🏴☠️💰 XAU/USD Gold Heist Blueprint 💰🏴☠️
“The Vault’s Open… Time to Load Up!”
🌟Hi! Hola! Ola! Bonjour! Hallo! Marhaba!🌟
Dear Money Makers & Market Robbers 🤑💰💸✈️
Get ready to execute the Golden Robbery with style and precision! Based on our 🔥Thief Trading Style🔥 using both technical & fundamental weapons, we’ve decoded the latest gold vault password: XAU/USD (Gold vs USD) is showing bullish bias!
🎯 Heist Instructions:
📈 Entry Point –
“The vault is wide open!”
Enter long anytime — but for the sharp shooters, place buy limits on the most recent 15/30min swing lows or pullback zones for a stealthier entry. Let the retracement pull the guards away 😏🔐
🛑 Stop Loss –
🔒 Set your Thief SL just below recent swing lows on the 4H timeframe (around 3310.0).
🔧 Adjust based on risk tolerance, lot size, and number of open trades — every heist has its escape plan!
🏁 Target Zone –
🎯 Aim for 3395.0 — or vanish before the cops show up!
Trail the stop as you go and don’t get greedy — wealth is preserved when exits are clean! 🏃♂️💨
🧲 Scalper's Advisory:
Only steal on the Long Side! Bulls are funding this operation.
💼 Big pockets? Dive in.
💳 Small stack? Swing with the pros & follow the plan.
🎯 Use Trailing SL to keep the loot safe.
📊 Market Insight – Why We Rob Gold Now?
XAU/USD shows bullish momentum 🐂 backed by:
Macro & Fundamental Data 🧠
Geopolitical & Intermarket Trends 🌍
COT Reports & Sentimental Outlook 💼
Dollar Weakness + Safe Haven Flow 💸
📚 Always cross-check the news wires & reports to validate the path! Fundamentals are the lockpick tools behind every breakout! 🔓📈
⚠️ Stealth Warnings:
📆 News Events = Increased Surveillance!
🚫 No new entries during high-volatility news drops.
🛡 Use Trailing SL on live trades to secure the bag.
💖 Wanna Support Our Heist Style?
Smash that 🚀 BOOST BUTTON 🚀
It fuels our Thief Army and helps you & your crew loot the market with confidence and flair!
Every day’s a new caper — follow the plan, manage your risk, and stay outta jail! 🏆💪🤝🎉
🔐 See you in the next Robbery Blueprint — Stay Locked & Loaded!
🐱👤💼📈💣💸
XAUUSD - Gold Bearish Bias Remains StrongXAU/USD remains under bearish pressure on the 4-hour timeframe. Until price breaks and closes above $3,336 with strength, selling the rallies remains a preferred strategy. However, watch for potential bounces near support zones, especially if momentum weakens or reversal candles appear. The price is currently trading below both the 50, 100 and 200 EMA, indicating a short-term downtrend. The recent price action has respected the trendline resistance and failed to break higher, reinforcing sellers’ control.
Price structure has formed a descending channel, which often signals a bearish continuation. However, if price finds a strong reaction from support, a temporary rebound could occur before further downside. Overall sentiment is cautious due to recent geopolitical de-escalation between Iran and Israel, which reduced gold’s safe-haven demand. Dollar strength, driven by hawkish Fed tone, continues to pressure gold.
Key Support Levels :
$3,295 – A minor support where previous candles showed buying interest.
$3,289 – Critical horizontal support and psychological level.
$3,270 – Next significant support if $3,289 breaks.
$3,240 – Major support zone, last line before larger downside moves.
Key Resistance Levels:
$3,310 – Near-term resistance and EMA zone.
$3,320 – Price rejection level from earlier 4H candles.
$3,336 – Strong resistance with previous swing highs.
Note
Please risk management in trading is a Key so use your money accordingly. If you like the idea then please like and boost. Thank you and Good Luck!
Gold Fails to Hold the Fear – Ceasefire Triggers 500+ Pip DropIn yesterday’s analysis, I pointed out that despite the weekend escalation in the middle-east, which triggered a gap up in Gold, the price action didn’t confirm the fear narrative. Gold failed to hold its gains – a clear sign of weakness.
📌 What happened next?
Throughout the day, Gold attempted multiple pushes toward 3400 – but each effort was met with strong selling pressure.
Then came the ceasefire announcement… and Gold dropped hard, now trading around 3320, locking in over 500 pips of profit from my short setup.
________________________________________
❓ More importantly, what’s next for Gold?
More important than the short-term noise is what the charts are now telling us:
📉 Weekly chart? Bearish.
🕯️ Daily chart? Also turned bearish after last week’s indecisive price action.
________________________________________
📌 Strategy remains the same:
I continue to sell rallies, and I’m now watching the 3280 support zone for a possible test in the coming hours.
Patience. Discipline. Let the market come to you. 🚀
Disclosure: I am part of TradeNation's Influencer program and receive a monthly fee for using their TradingView charts in my analyses and educational articles.
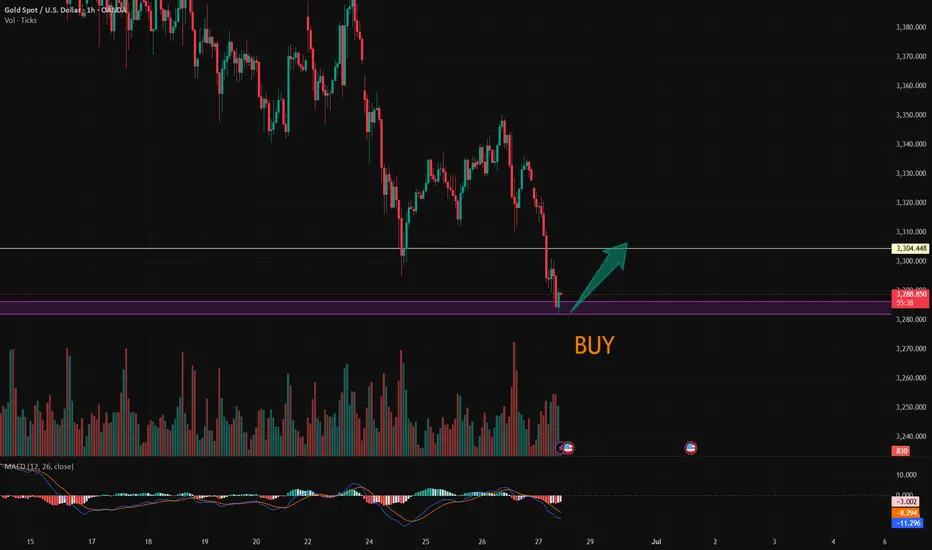
Waiting for data release to rebound and short📰 Impact of news:
1. PCE and Consumer Index
📈 Market analysis:
The current price of 3280 has a higher profit and loss ratio advantage. Technical indicators show that the hourly chart is severely oversold. Combined with the top and bottom conversion of 3300 above, there is a 20-point rebound space in the short term. If the PCE data is in line with the trend, gold prices are expected to quickly regain the 3,300 mark. Note that negative data beyond expectations may cause a brief decline.
🏅 Trading strategies:
BUY 3295-3280-3275
TP 3298-3300-3310
SELL 3300-3310
TP 3290-3280-3260-3250
If you agree with this view, or have a better idea, please leave a message in the comment area. I look forward to hearing different voices.
TVC:GOLD FXOPEN:XAUUSD FOREXCOM:XAUUSD FX:XAUUSD OANDA:XAUUSD
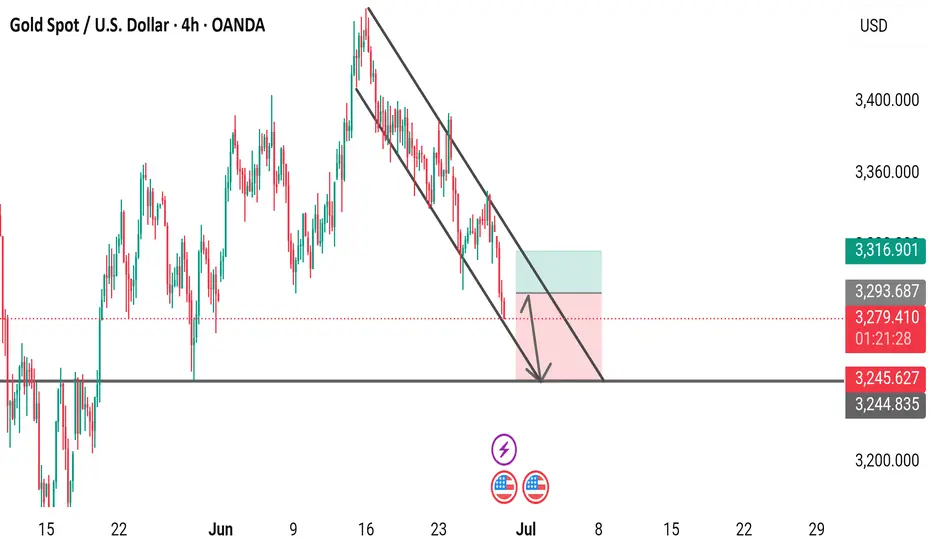
Gold Spot / U.S. Dollar - 4 Hour Chart (OANDA)4-hour chart from OANDA shows the price movement of Gold Spot (XAUUSD) against the U.S. Dollar, with the current price at 3,282.135, reflecting a decrease of 45.685 (-1.37%). The chart includes a descending trendline, support and resistance zones (highlighted in pink and teal), and key price levels ranging from 3,244.835 to 3,400.000. The analysis suggests a potential downward movement as the price approaches a support zone near 3,244.975, with indicators like the U.S. flag and lightning bolt possibly signaling significant market events or volatility.

Gold Spot / U.S. Dollar (XAUUSD) 4-Hour Chart - OANDA4-hour chart from OANDA shows the price movement of Gold Spot against the U.S. Dollar (XAUUSD), with the current price at 3,282.080, reflecting a decrease of 45.740 (-1.37%). The chart includes a downward trendline indicating a potential bearish trend, with key support and resistance levels marked at 3,245.627 and 3,316.901, respectively. The chart covers data from June to July 2025, with the latest update at 01:22:46.
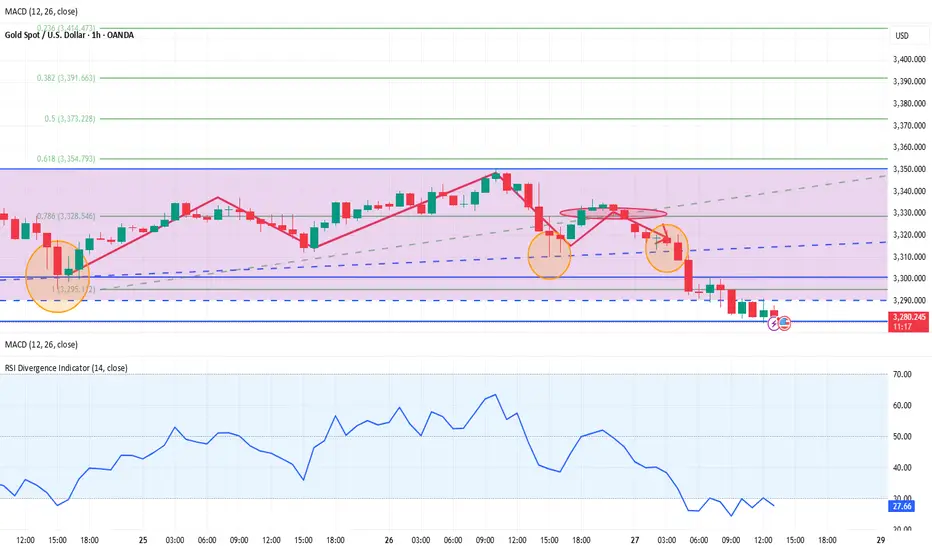
Gold is weak. Can it continue?Gold is still fluctuating and falling slightly today. Gold is weak, so gold is likely to be short-term. If the price rebounds, it will be a short opportunity.
We need to pay attention to the release of US PCE data later.
From the 1-hour chart
the moving average continues to cross the short arrangement and diverge downward. After gold fell below the early support near 3340, it began to move downward weakly. The current upward pressure is around 3295-3310.
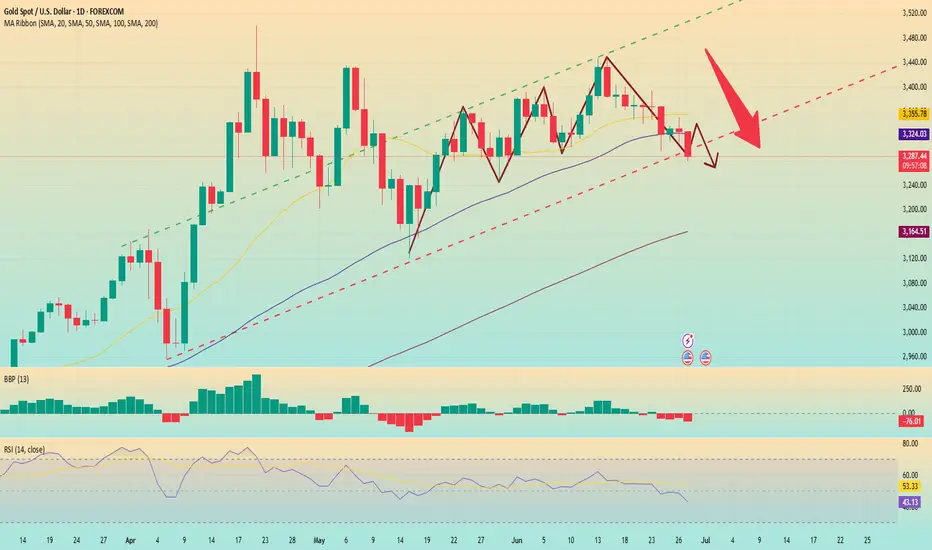
From the daily chart, the price is below the MA20 cycle and the 50 cycle, but remains above the 100 cycle. The technical indicators turned higher, but the momentum indicator is at a neutral level, and the RSI index is around 42.7, which does not point to an upward trend.
Since the upcoming data may have some impact on the price, the price may have a short-term high opportunity. Steady trading is still waiting for the price to rise and then short. Of course, if your trading strategy is more aggressive, you can use a long strategy before the price rises.
Operation suggestions:
Radical: Buy near 3280, stop loss at 3265, profit range 3305-3310.
Conservative: Wait for the price to rise and then bear pressure, sell near 3310, stop loss at 3320, profit range 3290-3285.
XAUUSD:Go long
Short - term first do a rebound.
Trading Strategy:
BUY@3283-86
TP:3297-3304
More detailed strategies and trading will be notified here ↗↗↗
Keep updated, come to "get" ↗↗↗
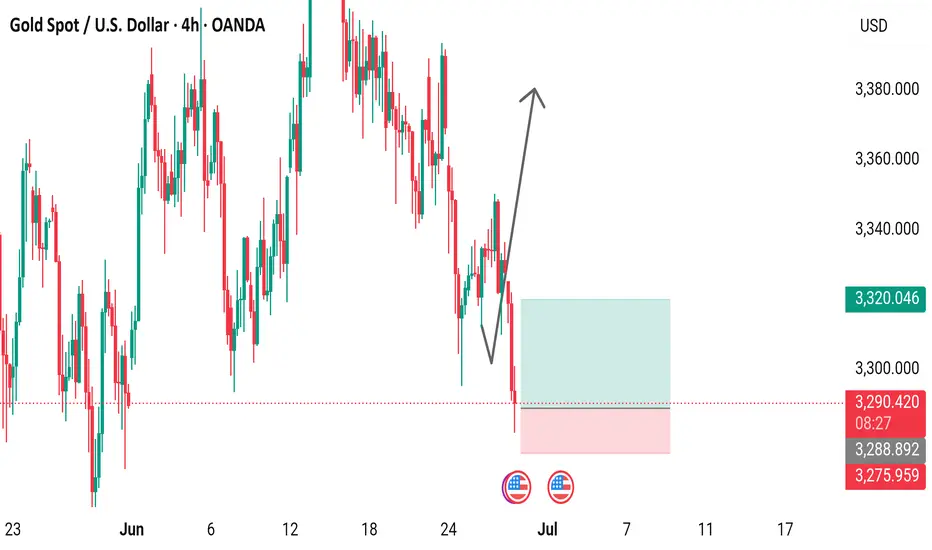
Gold Spot / U.S. Dollar (XAU/USD) 4-Hour Chart - OANDA4-hour chart from OANDA displays the price movement of Gold Spot (XAU/USD) from late June to mid-July 2025. The current price is $3,290.270, reflecting a decrease of $37.475 (-1.13%) as of 09:42. The chart highlights a recent upward trend followed by a potential support zone around $3,200-$3,300, with a marked resistance level near $3,380. The analysis suggests a possible reversal or consolidation phase.
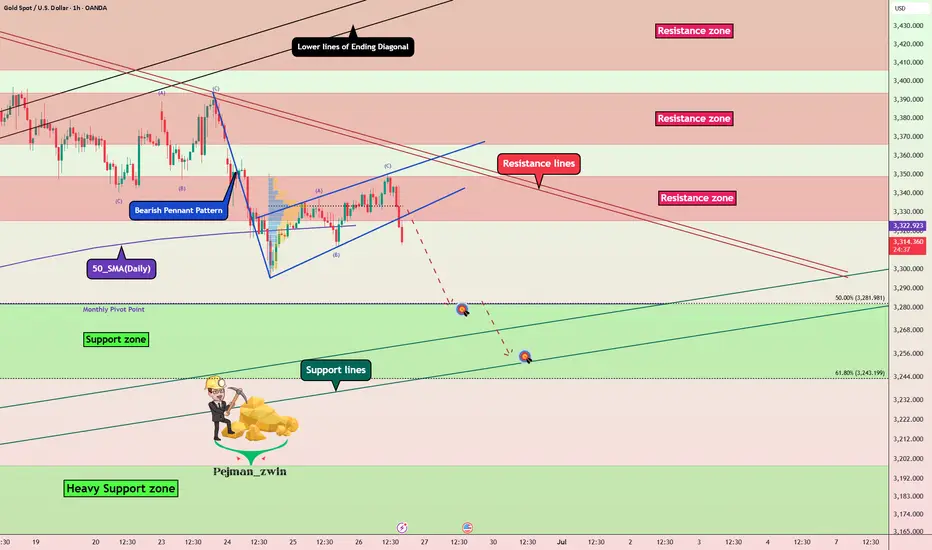
Gold Breakdown Confirmed — Bearish Pennant Targets UnfoldingGold ( OANDA:XAUUSD ) started to decline as I expected in my previous idea after the lower lines of the Ending Diagonal broke .
Gold is moving near the Resistance zone ($3,349-$3,325) . And Gold seems to be crossing the 50_SMA(Daily) .
From a Classical Technical Analysis perspective , the Bearish Pennant Pattern seems to indicate a continuation of the downtrend in Gold .
From an Elliott wave theory perspective , it seems that Gold has completed the Zigzag Correction(ABC) , and we can expect the next 5 downwaves .
I expect Gold to continue to decline at least to the Support zone($3,281-$3,243) and Monthly Pivot Point .
Note: Stop Loss (SL) = $3,360
Gold Analyze (XAUUSD), 1-hour time frame.
Be sure to follow the updated ideas.
Do not forget to put a Stop loss for your positions (For every position you want to open).
Please follow your strategy; this is just my idea, and I will gladly see your ideas in this post.
Please do not forget the ✅ ' like ' ✅ button 🙏😊 & Share it with your friends; thanks, and Trade safe.
XAUUSD: Gold's Muted Ascent Below $3350 XAUUSD: Gold's Muted Ascent Below $3350 – Navigating Key Levels Amidst USD Weakness!
Hello TradingView Community!
Let's delve into the intricate world of Gold (XAUUSD) today. The yellow metal is showing a subtle positive bias, largely influenced by a weaker US Dollar, yet a decisive bullish breakout above the $3350 mark remains elusive.
🌍 Macroeconomic Landscape: Forces Shaping Gold's Path
Gold has maintained a slight positive stance for the second consecutive day, but it's struggling to find significant follow-through, staying below the $3350 level in early European trading.
USD Under Pressure – A Tailwind for Gold: The primary driver for Gold's recent strength is the weakening US Dollar. Reports suggesting President Trump is considering replacing Fed Governor Jerome Powell have sparked concerns about the US central bank's future independence. This speculation has fueled market expectations for further Fed rate cuts this year, pushing the USD to its lowest point since March 2022, thereby providing support for non-yielding assets like Gold.
Cautious Outlook Prevails: Despite USD weakness, a definitive bullish trend for Gold is not yet confirmed. The ongoing ceasefire between Israel and Iran holds firm, with prevailing optimism limiting significant safe-haven rallies. This complex environment necessitates caution before confirming a definitive bottom for Gold or positioning for a substantial recovery from levels below $3300.
Key Data Ahead: Traders are keenly awaiting upcoming US macroeconomic data and speeches from FOMC members. These insights will be crucial in influencing XAU/USD, particularly ahead of Friday's pivotal US Personal Consumption Expenditures (PCE) Price Index release.
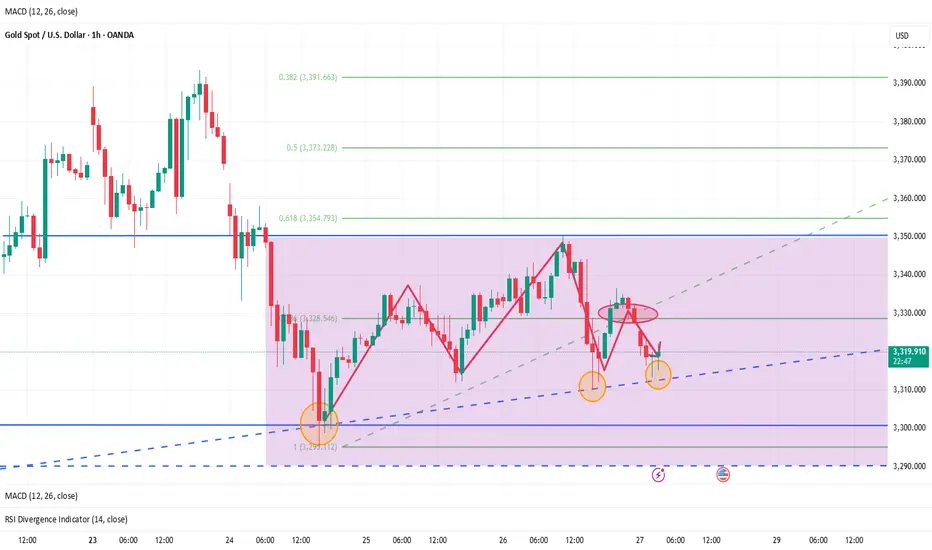
📊 XAUUSD Technical Outlook: Pinpointing Strategic Zones
Based on recent technical analysis (referencing image_e9d325.png for key levels), Gold is in a consolidation phase after a recent sharp decline, trading around the $329X mark. Price action below shorter-term moving averages suggests either lingering bearish pressure or an accumulation phase.
Strong Support Zones (Potential Buy Areas): Critical demand areas are identified around 3294.414, 3276.122, and notably 3264.400. These levels are crucial for potential price bounces.
Key Resistance Zones (Potential Sell Areas): Significant supply zones are found at 3313.737, 3321.466, 3330.483, and 3341.947. These are points where selling pressure may emerge.
🎯 XAUUSD Trading Plan: Your Actionable Strategy
Here's a breakdown of the strategic entry and exit points for your XAUUSD trades:
BUY ZONE (Strong Support - Long-Term Bias):
Entry: 3266 - 3264
SL: 3270
TP: 3280 - 3284 - 3290 - 3295 - 3300 - 3305 - 3310 - 3320
BUY SCALP (Quick Buy at Intermediate Support):
Entry: 3284 - 3282
SL: 3278
TP: 3288 - 3292 - 3296 - 3300 - 3305 - 3310 - 3320 - 3330
SELL ZONE (Key Resistance):
Entry: 3331 - 3333
SL: 3337
TP: 3326 - 3320 - 3316 - 3310 - 3305 - 3300
SELL SCALP (Quick Sell at Near Resistance):
Entry: 3313 - 3315
SL: 3320
TP: 3310 - 3305 - 3300 - 3295 - 3290 - 3280
⚠️ Key Factors to Monitor Closely:
US Macro Data: Friday's US Personal Consumption Expenditures (PCE) Price Index is paramount for market direction.
FOMC Member Speeches: Any official comments on monetary policy or inflation outlook will significantly impact USD and Gold.
Geopolitical Stability: Developments related to the Israel-Iran ceasefire can influence safe-haven demand.

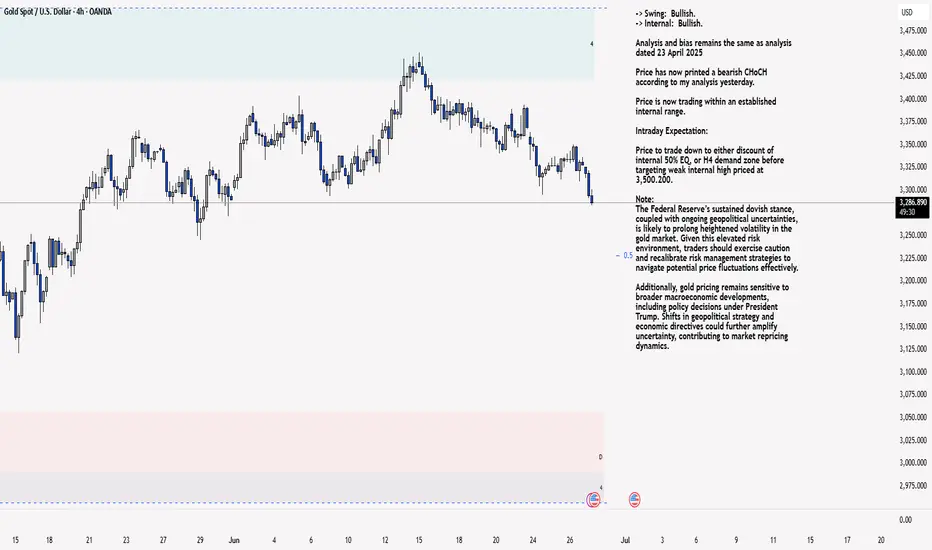
XAU/USD 27 June 2025 Intraday AnalysisH4 Analysis:
-> Swing: Bullish.
-> Internal: Bullish.
Analysis and bias remains the same as analysis dated 23 April 2025
Price has now printed a bearish CHoCH according to my analysis yesterday.
Price is now trading within an established internal range.
Intraday Expectation:
Price to trade down to either discount of internal 50% EQ, or H4 demand zone before targeting weak internal high priced at 3,500.200.
Note:
The Federal Reserve’s sustained dovish stance, coupled with ongoing geopolitical uncertainties, is likely to prolong heightened volatility in the gold market. Given this elevated risk environment, traders should exercise caution and recalibrate risk management strategies to navigate potential price fluctuations effectively.
Additionally, gold pricing remains sensitive to broader macroeconomic developments, including policy decisions under President Trump. Shifts in geopolitical strategy and economic directives could further amplify uncertainty, contributing to market repricing dynamics.
H4 Chart:
M15 Analysis:
-> Swing: Bullish.
-> Internal: Bullish.
Following previous high, and printing of bearish CHoCH, price has pulled back to an M15 supply zone, where we are currently seeing a reaction. Therefore, I shall now confirm internal high.
Price is now trading within an established internal range.
The remainder of my analysis shall remain the same as analysis dated 13 June 2025, apart from target price.
As per my analysis dated 22 May 2025 whereby I mentioned price can be seen to be reacting at discount of 50% EQ on H4 timeframe, therefore, it is a viable alternative that price could potentially print a bullish iBOS on M15 timeframe despite internal structure being bearish.
Price has printed a bullish iBOS followed by a bearish CHoCH, which indicates, but does not confirm, bearish pullback phase initiation. I will however continue to monitor, with respect to depth of pullback.
Intraday Expectation:
Price to continue bearish, react at either M15 supply zone, or discount of 50% internal EQ before targeting weak internal high priced at 3,451.375.
Note:
Gold remains highly volatile amid the Federal Reserve's continued dovish stance, persistent and escalating geopolitical uncertainties. Traders should implement robust risk management strategies and remain vigilant, as price swings may become more pronounced in this elevated volatility environment.
Additionally, President Trump’s recent tariff announcements are expected to further amplify market turbulence, potentially triggering sharp price fluctuations and whipsaws.
M15 Chart:
XAU/USD GOLD 4H + 1H PREMIUM TECHNICAL OUTLOOK – JUNE 27, 20254-HOUR TIMEFRAME – HIGHER TIMEFRAME BIAS
Gold continues to trade near its all-time highs, consolidating just below a recent swing high of $3,315. Despite minor pullbacks, the macro trend remains bullish, with bullish structure still intact. Recent price action shows shallow retracements and strong rejections of key fib levels, a typical sign of underlying smart money accumulation.
Price Action & Market Structure
Gold recently printed a Break of Structure (BOS) at $3,290, followed by a retest of the broken level.
We observed a Change of Character (CHoCH) near $3,300, quickly invalidated by bullish strength – further confirming accumulation behavior.
Market remains in bullish alignment unless $3,250 is broken decisively.
Key Support & Resistance Zones
Resistance $3,315–$3,320
Demand $3,275–$3,282
Support $3,250
Targets $3,340 / $3,355
Smart Money Concepts (SMC)
Liquidity Grab beneath $3,275 likely triggered retail stop hunts
4H Bullish Order Block between $3,275–$3,282 remains unmitigated
Imbalance Zone: $3,283–$3,289 – price may wick into this before launch
Sell-side liquidity taken below $3,275 → bullish reaction
Buy-side liquidity sits above $3,315 → likely short-term magnet
ZOOMING INTO 1-HOUR CHART – INTRADAY SETUPS
The 1-hour chart aligns with the bullish higher-timeframe bias, offering two potential premium-level setups:
Setup #1: Bullish Rejection from 4H OB
Entry Zone: $3,275–$3,282
This setup targets a liquidity sweep beneath $3,275 followed by bullish mitigation of a clean order block and imbalance zone. Confluence across fibs, OB, and structure support increases probability.
Setup #2: Breakout Retest Play
Trigger: Clean breakout and retest of $3,315
Entry: On successful retest (bullish confirmation candle)
Ideal if momentum pushes through local resistance, clearing buy-side liquidity. Reclaim of structure suggests smart money continuation.
Bearish Contingency (Low Probability for Now)
If price breaks below $3,250 and confirms below structure:
Look to short on retests into $3,275
Target next demand around $3,235
Until that happens, bullish bias remains dominant.
Gold remains one of the most structured and responsive instruments to smart money technicals right now. A well-planned entry around demand, imbalance, or breakout levels provides excellent RRR potential if structure holds.

Gold prices are consolidating at a low level!International spot gold continued to fluctuate and fall. Looking back at the market performance on Thursday, gold prices maintained a narrow range of consolidation. Investors focused on the upcoming US inflation data to judge the direction of interest rate policy, while paying close attention to signs of easing geopolitical tensions in the Middle East. The current gold market is facing the influence of multiple factors: in the short term, PCE inflation data will become a key variable in determining the trend of gold prices. If the data is lower than expected, the market will strengthen the Fed's expectations of rate cuts, thereby supporting the upward trend of gold prices; on the contrary, if the inflation data exceeds expectations, it may delay the Fed's pace of rate cuts, resulting in pressure on gold prices. From a medium- and long-term perspective, the low interest rate environment, continued geopolitical risks and the potential weakening trend of the US dollar jointly provide structural support for gold prices. In addition, it is necessary to focus on the capital diversion effect that may be caused by the rising heat of the platinum and palladium markets. It is recommended to closely track the changes in capital flows in the precious metals sector.
From the analysis of the gold 4-hour level chart, today's gold price showed a downward trend at the opening, and the lowest fell to around US$3289.25 and then temporarily stabilized at US$3298. Technical indicators show that the 4-hour moving average system shows a dead cross arrangement, the MACD indicator dead cross continues, the gold price has fallen below the lower track support of the Bollinger Band, and the Bollinger Channel shows a narrowing trend, and the short-term price is in a low-level weak consolidation pattern. In view of the fact that the weekly line is about to close this week and the volatility of the end-of-month market is intensifying, it is necessary to focus on preventing the risk of a second bottoming out of the price. Comprehensively judged, the current gold trend is bearish, and the operation strategy is recommended to focus on rebound shorting.
Operation strategy:
1. It is recommended to short gold in the rebound area of 3311-3316, with a stop loss at 3324 and a target of 3300-3290

GOLD - XAUUSD Bear Flag PatternVery simple and clean chart with Bear flag pattern. If it breaks then hoping for retrest of 3300 area or more down.

XAUUSD maintaining the falling pattern H4 Timeframe Analysis
Gold is currently holding the falling wedge pattern on H1 & H4 and Market has to lift up at range of 3380-3285.
What's possible scanarios we have?
As we have seen h4 candle closes above 3280-3285 then keep buying and eyes at 3305 then 3320 milestone also I'm holding my buy positions.
On the otherhand if The H4 candle closes below 3280-3275 then buying will be limited and market will join the 3250 zone.i will sell accordingly .
Additional TIP:
Above 3280-3285 keep buy
Below 3275 keep sell
#XAUUSD

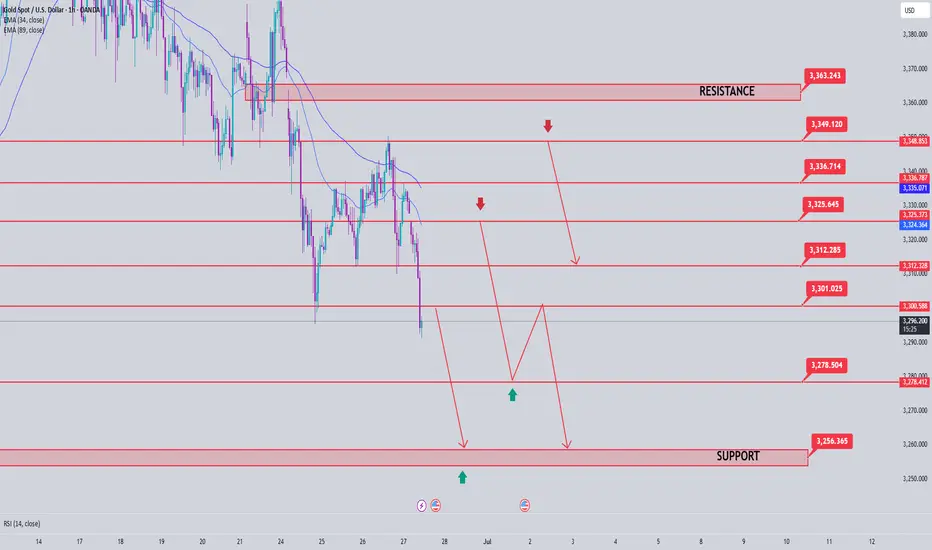
Gold Price Analysis June 27Daily Trend Analysis:
The price has reacted strongly at the 3348 level, forming a clear and sustainable bearish structure. The 3296 zone is now a critical level — a confirmed breakout below this area could lead to a deeper decline, especially with limited potential for recovery on Friday.
Today, the bearish trend is likely to face less resistance compared to the bullish side. As such, a move toward the support zones at 3278 and 3255 is highly probable.
Any bullish retracement during the European session should be viewed as a good opportunity to look for SELL setups, targeting 3278 and 3255.
As previously analyzed, SELL zones are clustered around key resistance levels. Traders should closely watch price reactions in these areas for potential entry signals.
🔹 Breakout key level: 3296
🔹 Support zones: 3278 – 3255
🔹 Resistance zones: 3300 – 3312 – 3325 – 3336 – 3348 – 3363
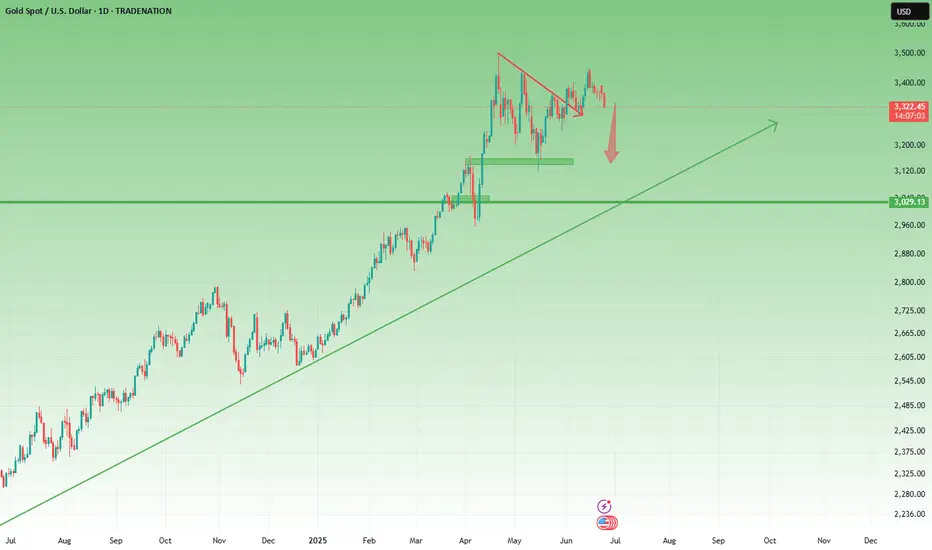
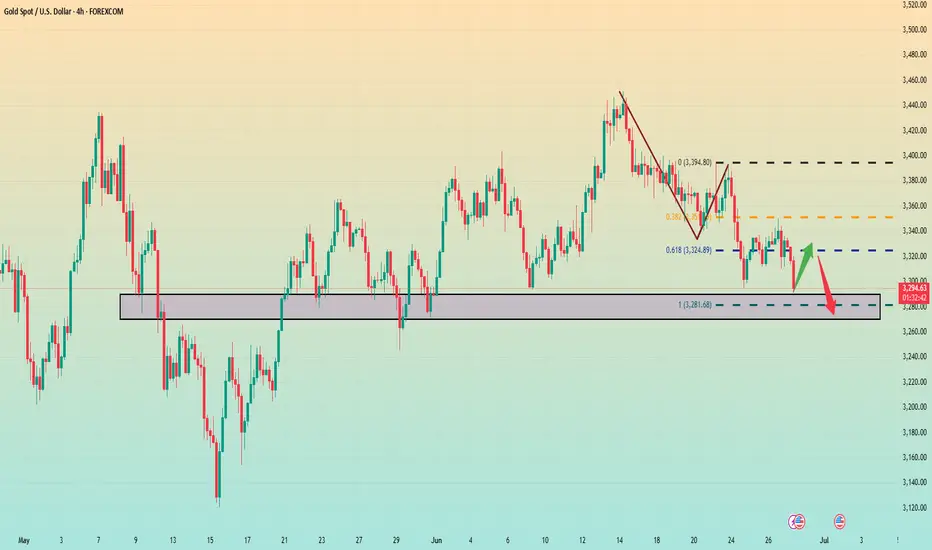
Gold breaks down. It may reach a low point.From the current market daily chart
The absolute support of gold is around 3280. Gold is basically in the process of maintaining this daily trend support line. Therefore, I personally think that around 3280 is a long-short dividing line for gold. If gold falls below 3280 on the daily line, it is very likely that the decline will just begin. On the contrary, be careful. If 3280 does not fall below, there is still a possibility of rebounding.
In the 4-hour chart, from the high point of 3450 to now, the 0.382 position is just around yesterday's high point of 3350. The 0.618 position is at 3325, and the final 100% position is around 3280. 3280 also coincides with the daily chart.
Therefore, gold must at least test around 3280 today, and it is not ruled out that there will be lower positions.
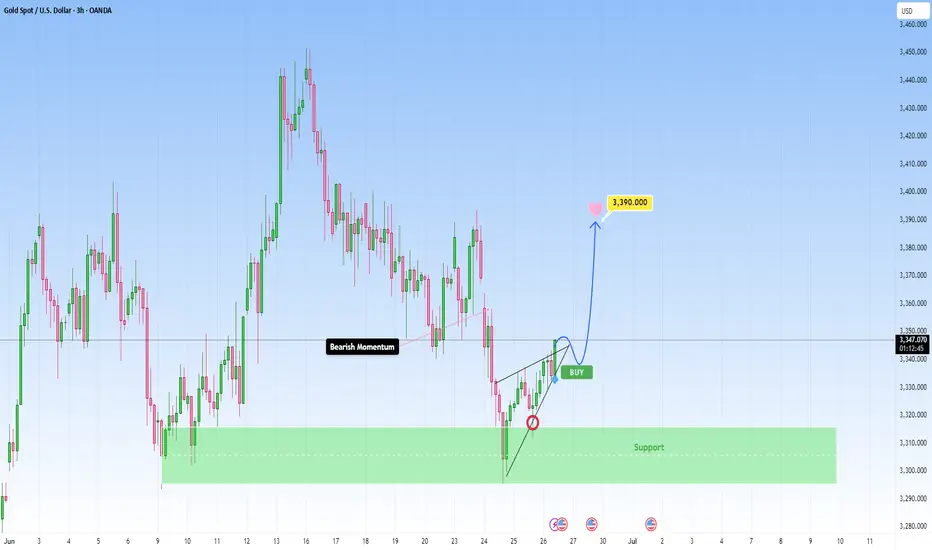
GOLD drops sharply to 3300 and found important support areaThe recent bearish momentum on GOLD has met a good support zone and at present we started to see early signs of bullish interest returning, right after we got a beautiful rejection from the zone.
Currently I’m expecting for the price to bounce to the target near 3,390 . If this bullish push continues with strong volume and momentum, I’ll be locking in that bias and planning my entry accordingly. I could get involved right here for a more aggressive entry. It’s a bit riskier, but if the structure confirms, I’m more than happy to take the shot, as sometimes the best trades come when you trust your setup.
This is not financial advice.
Analysis and layout of the latest gold trends during the day📰 Impact of news:
1. PCE and Consumer Index
📈 Market analysis:
Judging from the 4H chart, the Bollinger Bands are closing and the MACD is showing a trend of forming a death cross, indicating that the short-selling momentum is still relatively strong in the short term. However, as the overall upward structure has not been destroyed, there is still a possibility of a rebound and repair in the future. During the day, we need to pay special attention to the support strength of the MA5 and MA10 moving averages. It is recommended to adopt the idea of shorting at high levels and going long at low levels. The key support below is the 3305-3295 area, and the upper resistance is the 3340-3350 range. However, judging from the chart, in the short term, there may be a rebound near 3313. At present, it has indeed rebounded to around 3319 as expected. If it falls weakly to this week's low of 3295, you can buy if it does not break. On the whole, if it rebounds to 3335-3345, you can consider shorting, and if the support below 3305-3295 is not broken, go long. Today is Friday, and as it is near the end of the month, market liquidity is strong. Please be cautious in your operations today and be sure to set stop losses strictly.
🏅 Trading strategies:
SELL 3335-3345-3350
TP 3320-3315-3300
BUY 3305-3295
TP 3310-3320-3330
If you agree with this view, or have a better idea, please leave a message in the comment area. I look forward to hearing different voices.