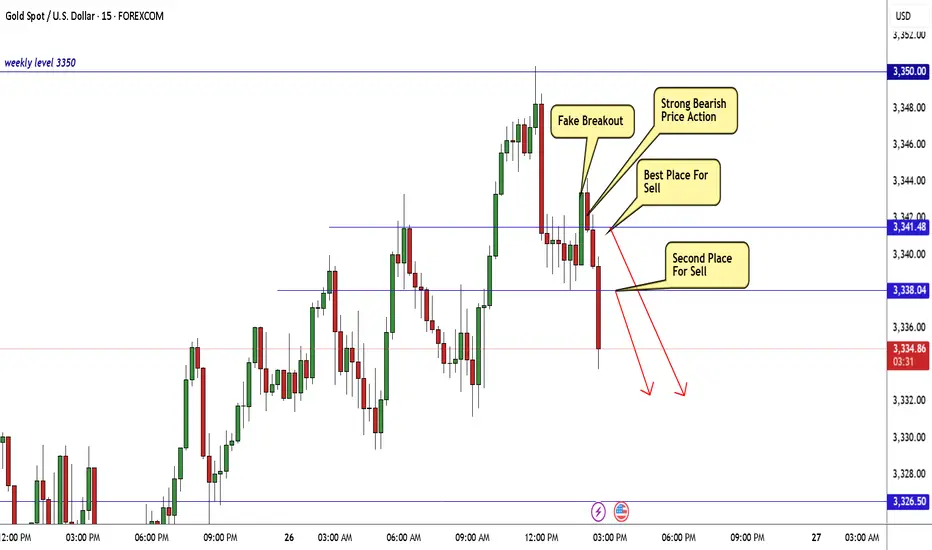
Gold Breakout Done New Short Entry Valid To Get 200 Pips !Here is my opinion on gold at he moment , in 15 mins T.F wr have a fake breakout but 3343.00 forced the price to go down which is a great res for this pair and we have avery good bearish price action and good closure below my res level 3341.00 so it`s my num 1 place to enter a sell trade if the price go back to retest it , and if not , 3383.00 will be my best place to sell it .
Xauusdanalysis
Gold Builds Bullish Momentum After $3,294.0 ReboundGold bounced from $3,294.0, forming a double bottom pattern as XAU/USD consolidates near $3,330.0. Stochastic has exited oversold territory, signaling strengthening bullish momentum.
If $3,294.0 holds as support, the uptrend may continue toward the $3,393.0 target.
Dxy is recovering impact on XAUUSD?H4 Timeframe Analysis
Gold is currently holding the falling wedge pattern on H1 & H4 now market is range of 3330-3380 structural zone .
What's possible scanarios we have?
As we have seen h4 candle closes above 3335 .once 3345 cross keep your eyes at 3365 then 3380 milestone also I'm holding my buy position at 3331 .
On the otherhand if The H4 candle closes again below 3335 and I will wait to break of 3325 buying will be limited and market will join the 3290 zone.i will sell accordingly
Additional TIP:
Above 3335 keep buy
Below 3325 keep sell
#XAUUSD

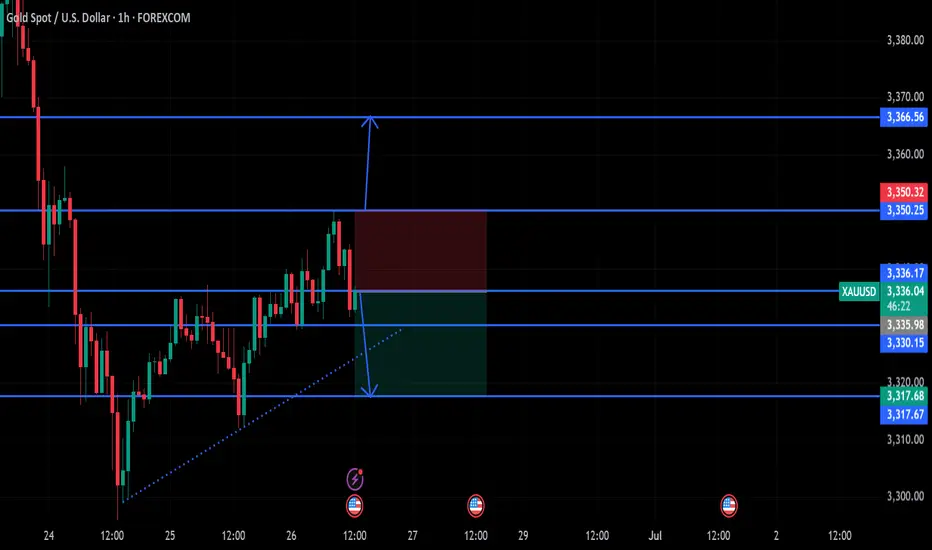
gold on bearish retest#XAUUSD price have retrace back 3350.2 which is retesting back below day low.
Below 3336 holds short sell which target 3330-3317, but main entry for selling 3330, SL 3346.
Breakout above 3350.2 holds strong buy which will reach 3366 for bearish reversal.
GOLD - Its breakout? What's next??#GOLD... market broke our resistance area that is 3338 around
So keep close now and sustain above means a bounce expected.
Good luck
Trade wisely
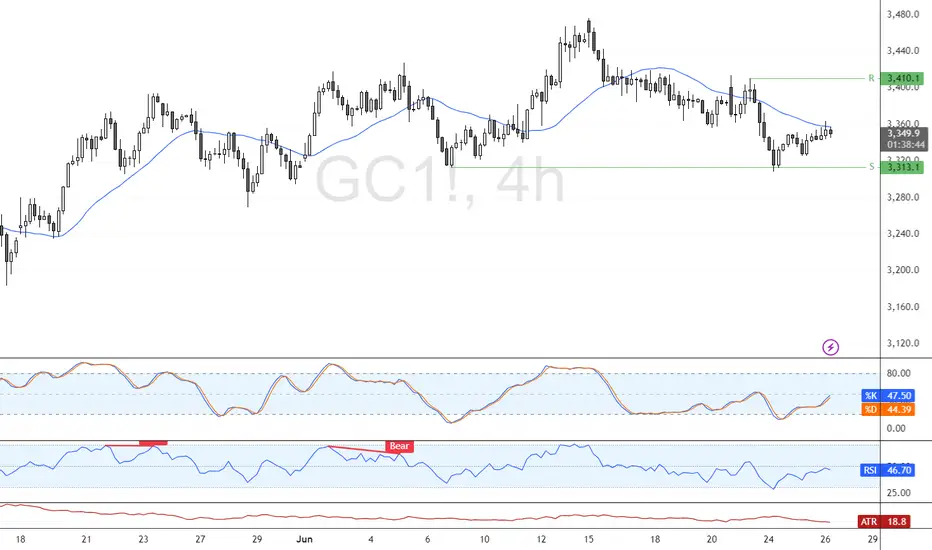
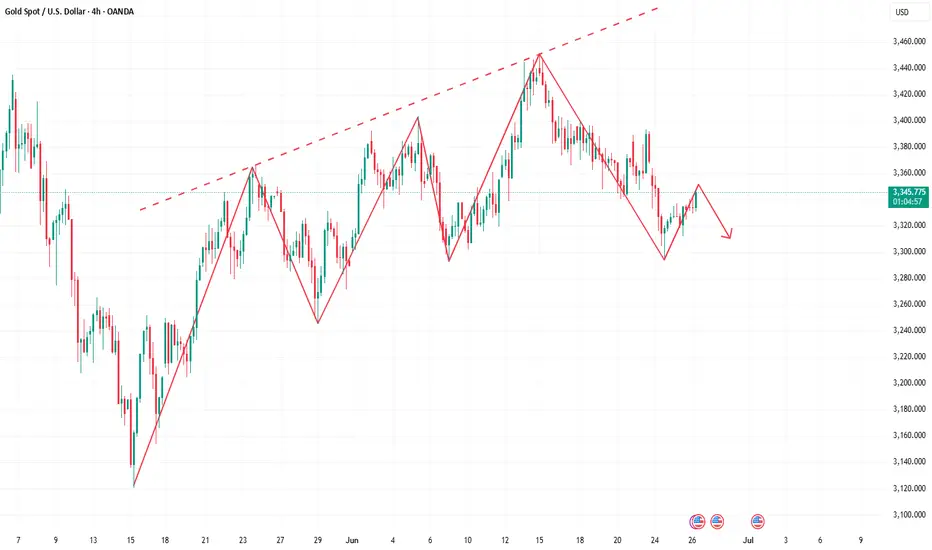
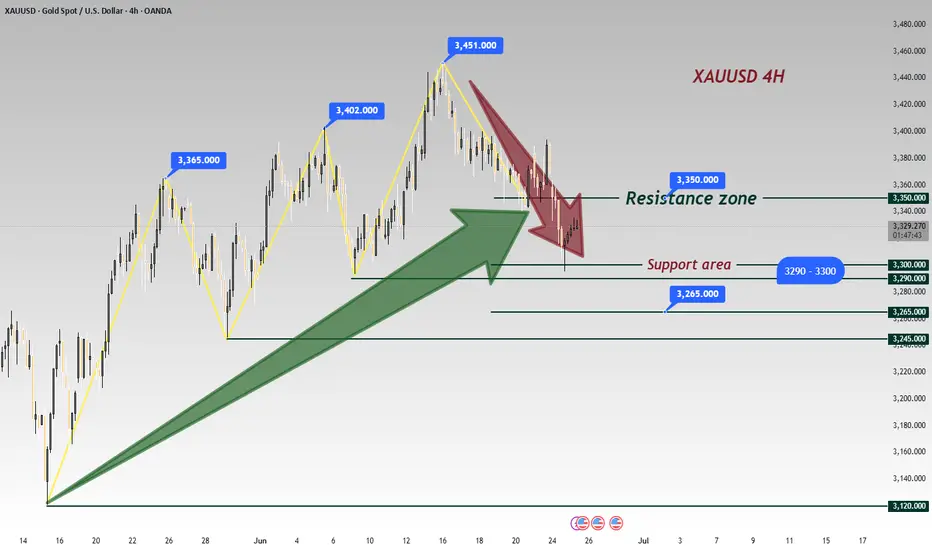
It’s the right time to short goldThe daily gold line presents a three-top gathering pattern. The historical trend shows that the 3290-3280 area has triggered technical pullbacks many times, all of which rebounded to around 3350. The current 4-hour chart trend line suppression level coincides with the Fibonacci 0.618 pullback resistance from the previous high of 3450 to 3300 in the 3350-3360 range. This area constitutes the core pressure zone. If the price fails to effectively break through and stand above 3360 when it probes this area again, it is highly likely to replicate the previous two resistance and fall patterns. At that time, short orders will be arranged based on the 3350 first-line resistance area, with the goal of breaking the key support of 3300 and further looking down at the 3280 and 3260 levels. The overall bearish tendency is maintained, and the resistance to rebound is a signal to enter the market and sell short.
Gold recommendation: Gold is short around 3345-3352, target 3330-3320
XAUUSD on correction H4 Timeframe Analysis
Gold is currently holding the falling wedge pattern on H1 & H4 now market is range of 3330-3380 structural zone .
What's possible scanarios we have?
As we have seen h4 candle closes above 3335
And we have bullish potential towards 3380 .once 3345 cross keep your eyes at 3365 then 3380 milestone.
On the otherhand if The H4 candle closes again below 3335 buying will be limited and market will join the 3290 zone
Additional TIP:
Above 3335 keep buy
Below 3325 keep sell
#XAUUSD
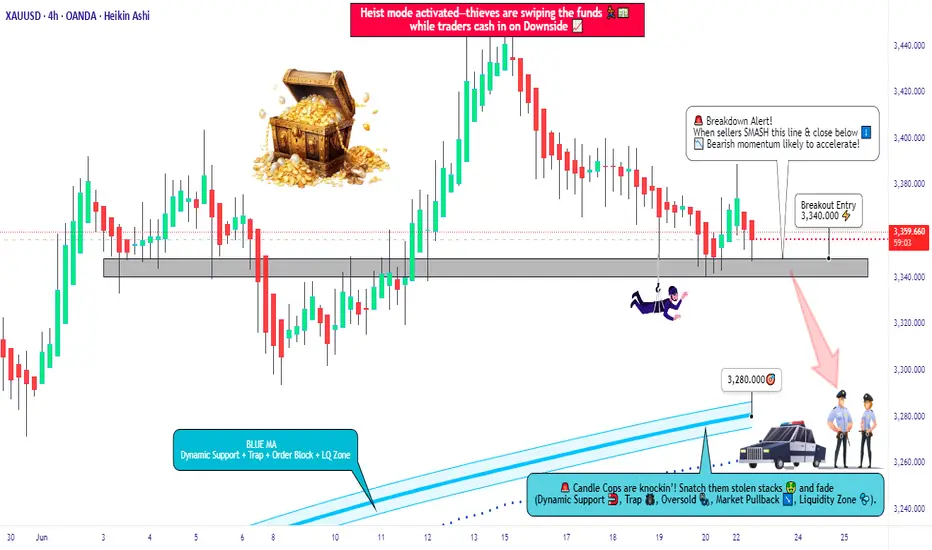
XAU/USD Bearish Bomb Ready to Explode? (Entry Levels Inside)🏦💰 GOLD HEIST ALERT: XAU/USD Bearish Raid in Progress! (Short Setup Inside) 💰🏦
🚨 Cops Waiting at Resistance? Here's How to Steal Pips & Escape Safely! 🚨
🦹♂️ ATTENTION ALL MARKET BANDITS!
To the Profit Pirates & Risk-Takers! 🌍💣
Using our 🔥Thief Trading Tactics🔥 (a lethal mix of liquidity grabs + institutional order flow + macro traps), we're executing a bearish gold heist on XAU/USD—this is not advice, just a strategic robbery plan for traders who play by their own rules.
📉 THE GOLD VAULT RAID (SHORT ENTRY PLAN)
🎯 Loot Zone: 3280.00 (or escape earlier if bulls fight back)
💣 High-Stakes Play: Neutral trend turning bearish - trap for late buyers
👮♂️ Cop Trap: Where bullish traders get arrested by resistance
🔪 ENTRY RULES:
"Heist Activated!" – Strike when price breaks 3340.00
Sell Stop Orders above MA OR Sell Limit on pullbacks (15-30min TF)
Aggressive? Enter at market but use tighter stops
📌 SET ALERTS! Don't miss the breakdown
🚨 STOP LOSS (Escape Plan):
Thief SL at 3390.00 (4H swing high)
⚠️ Warning: "Ignore this SL? Enjoy your margin call."
🎯 TARGETS:
Main Take-Profit: 3280.00
Scalpers: Ride the bear waves only
🔍 FUNDAMENTAL BACKUP (Why This Heist Works)
Before raiding, check:
✅ COT Data (Are big players dumping gold?)
✅ Real Yields (TIPS vs Gold correlation)
✅ Geopolitical Heat (Safe-haven flows drying up?)
✅ DXY Strength (Dollar crushing commodities?)
🚨 NEWS RISK WARNING
Avoid NFP/CPI/FOMC periods (unless you like volatility torture)
Trailing stops = your get-out-of-jail-free card
💎 BOOST THIS HEIST!
👍 Smash Like to fund our next raid!
🔁 Share to recruit more trading outlaws!
🤑 See you at the target, rebels!
⚖️ DISCLAIMER: For entertainment only. Trade at your own peril.
#XAUUSD #GoldTrading #TradingView #LiquidityGrab #ThiefTrading
💬 COMMENT: "Short already—or waiting for confirmation?" 👇🔥
The Fed's rate cut cannot stop the decline in gold pricesThe 4-hour technical pattern is repaired, the short-term moving average diverges upward, and the K-line stands firm on the moving average support and fluctuates upward. In the short term, pay attention to the breakthrough of the 3350 pressure level and the confirmation of the European and American market retracement. The daily price stabilizes at the 3300 support level, and the downward momentum is weakened. The overall pattern of fluctuations is maintained. Be vigilant about the short-term adjustment risk after continuous highs. In terms of operation, it is recommended to arrange short orders in batches in the 3347-3352 area, and strictly stop loss and take profit.

XAUUSD: Gold's Inflationary Tug-of-WarXAUUSD: Gold's Inflationary Tug-of-War – Navigating Powell's Remarks & Key Levels
Hello TradingView community!
Let's dive into Gold (XAUUSD) today, as its price action continues to be shaped by the Federal Reserve's (Fed) cautious stance on inflation and interest rates. Recent comments from Fed Chair Jerome Powell are particularly noteworthy.
🌍 Macroeconomic Drivers: Tariffs, Inflation, and Fed's Deliberation
The market finds itself in a complex situation following key statements from Fed Chair Jerome Powell:
Powell indicated that substantial tariffs could trigger a prolonged wave of inflation, potentially moving beyond conventional economic models. This introduces a new and significant factor into the inflation outlook.
Despite recent inflation moderation, Powell stressed the necessity of more data from June and July before considering any rate cuts. This underscores the Fed's cautious approach and lack of immediate urgency.
He also cautioned about the risk of "price shocks turning into persistent inflation".
In this environment, where market sentiment is stretched between hopes for rate cuts and the emerging risk of tariff-driven inflation, Gold maintains its role as a crucial psychological anchor. Should the Fed be slow to react to this potential new inflationary pressure, Gold's appeal could intensify.
📊 XAUUSD Technical Analysis & Trading Plan:
Based on the XAUUSD charts (H4/M30 timeframe) you provided (e.g., image_008403.png): Gold is currently undergoing a corrective or consolidating phase after a notable pullback. The price is trading below shorter-term moving averages, suggesting either bearish momentum or an accumulation phase.
Key Resistance Zones (Potential SELL Areas):
3,352.383 - 3,353.860: An immediate resistance point, coinciding with the 0.5 Fibonacci level.
Higher up: 3,391.750 - 3,395.000: This represents a very strong previous peak and a major resistance barrier.
Key Support Zones (Potential BUY Areas):
3,317.738 - 3,311.214: An intermediate support area, close to the 0.236 Fibonacci level.
3,302.939 - 3,302.857: A strong demand zone, aligning with the recent low.
Further down: 3,286.257: This is the next significant support level if preceding zones are breached.
🎯 XAUUSD Intraday Trading Plan:
Here are our refined zones and targets for today's trading:
BUY SCALP:
Entry: 3316 - 3314
SL: 3310
TP: 3320 - 3324 - 3328 - 3332 - 3336 - 3340
BUY ZONE:
Entry: 3304 - 3302
SL: 3298
TP: 3308 - 3312 - 3316 - 3320 - 3330 - 3340 - 3350
SELL SCALP:
Entry: 3353 - 3355
SL: 3360
TP: 3350 - 3345 - 3340 - 3335 - 3330
SELL ZONE:
Entry: 3390 - 3392
SL: 3396
TP: 3386 - 3382 - 3378 - 3374 - 3370 - 3360
⚠️ Key Factors to Monitor:
Fed Official Speeches: Any new comments from Fed officials regarding inflation or monetary policy outlook.
US Economic Data: Upcoming inflation (CPI, PCE) and employment reports (NFP) will be crucial for policy expectations.
Geopolitical Developments: Ongoing global tensions consistently bolster Gold's safe-haven appeal.
Trade wisely and always manage your risk effectively! Wishing everyone a profitable trading day!

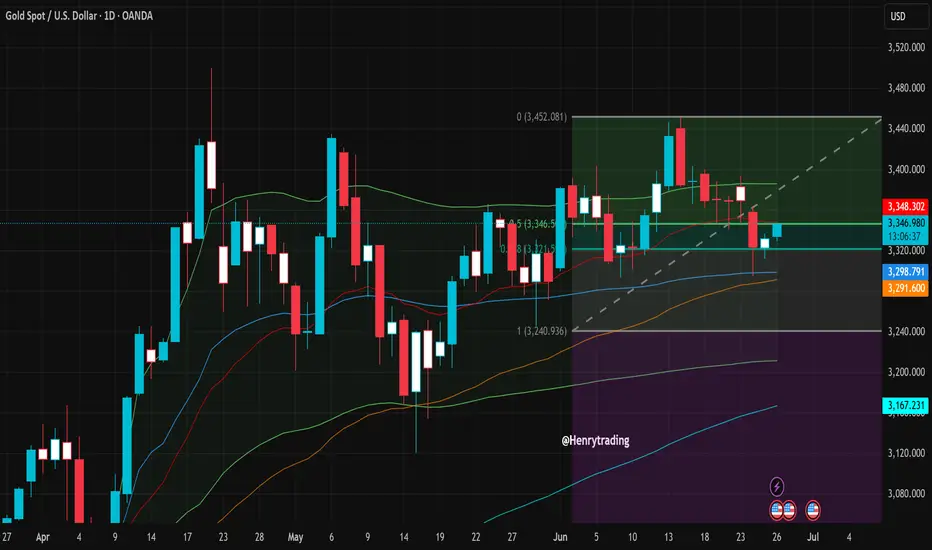
XAUUSD: Breakout or Bull Trap?Gold (XAUUSD) on the daily timeframe is showing signs of a temporary rebound after a sharp drop from the resistance zone at 3,452 USD. Specifically, the price has bounced back from the support area around 3,291 – 3,298 USD – a region aligned with dynamic EMA support and the 0.382 Fibonacci retracement of the previous bullish leg.
1. Key Technical Structure:
A clear reversal candlestick pattern has formed at a strong support zone, paving the way for a short-term technical rebound.
The 0.5 Fibonacci level at 3,346.5 is currently acting as the nearest resistance – aligning closely with today’s closing price.
EMA 20 and EMA 50 are beginning to converge, indicating market indecision on the next directional move.
2. Short-Term Price Scenarios:
Bullish Scenario: If price holds above the 3,291 – 3,298 support zone and breaks above 3,348, it could retest the 3,400 – 3,452 highs in the coming days. In this case, strengthening EMAs and bullish candle momentum would support this setup.
Bearish Scenario: Conversely, if the price fails to break through the 3,348 – 3,352 resistance zone and falls below 3,291 again, the market may head toward deeper support levels at 3,240 – or even as low as 3,167 USD.
3. Trading Recommendations:
Short-term Buy if there is a confirmed bullish candle closing above 3,348 with strong volume; stop loss below 3,291.
Sell on rally around 3,348 – 3,352 resistance if no clear breakout is confirmed.
Apply strict risk management, especially in a choppy market environment ahead of key macroeconomic data at the end of the month.
Conclusion:
XAUUSD is currently in a “trend re-evaluation zone.” Closely monitoring the 3,291 – 3,348 range will be the key to timing efficient entries in the short term.

XAU/USD 26 June 2025 Intraday AnalysisH4 Analysis:
-> Swing: Bullish.
-> Internal: Bullish.
Analysis and bias remains the same as analysis dated 23 April 2025
Price has now printed a bearish CHoCH according to my analysis yesterday.
Price is now trading within an established internal range.
Intraday Expectation:
Price to trade down to either discount of internal 50% EQ, or H4 demand zone before targeting weak internal high priced at 3,500.200.
Note:
The Federal Reserve’s sustained dovish stance, coupled with ongoing geopolitical uncertainties, is likely to prolong heightened volatility in the gold market. Given this elevated risk environment, traders should exercise caution and recalibrate risk management strategies to navigate potential price fluctuations effectively.
Additionally, gold pricing remains sensitive to broader macroeconomic developments, including policy decisions under President Trump. Shifts in geopolitical strategy and economic directives could further amplify uncertainty, contributing to market repricing dynamics.
H4 Chart:
M15 Analysis:
-> Swing: Bullish.
-> Internal: Bullish.
Following previous high, and printing of bearish CHoCH, price has pulled back to an M15 supply zone, where we are currently seeing a reaction. Therefore, I shall now confirm internal high.
Price is now trading within an established internal range.
The remainder of my analysis shall remain the same as analysis dated 13 June 2025, apart from target price.
As per my analysis dated 22 May 2025 whereby I mentioned price can be seen to be reacting at discount of 50% EQ on H4 timeframe, therefore, it is a viable alternative that price could potentially print a bullish iBOS on M15 timeframe despite internal structure being bearish.
Price has printed a bullish iBOS followed by a bearish CHoCH, which indicates, but does not confirm, bearish pullback phase initiation. I will however continue to monitor, with respect to depth of pullback.
Intraday Expectation:
Price to continue bearish, react at either M15 supply zone, or discount of 50% internal EQ before targeting weak internal high priced at 3,451.375.
Note:
Gold remains highly volatile amid the Federal Reserve's continued dovish stance, persistent and escalating geopolitical uncertainties. Traders should implement robust risk management strategies and remain vigilant, as price swings may become more pronounced in this elevated volatility environment.
Additionally, President Trump’s recent tariff announcements are expected to further amplify market turbulence, potentially triggering sharp price fluctuations and whipsaws.
M15 Chart:

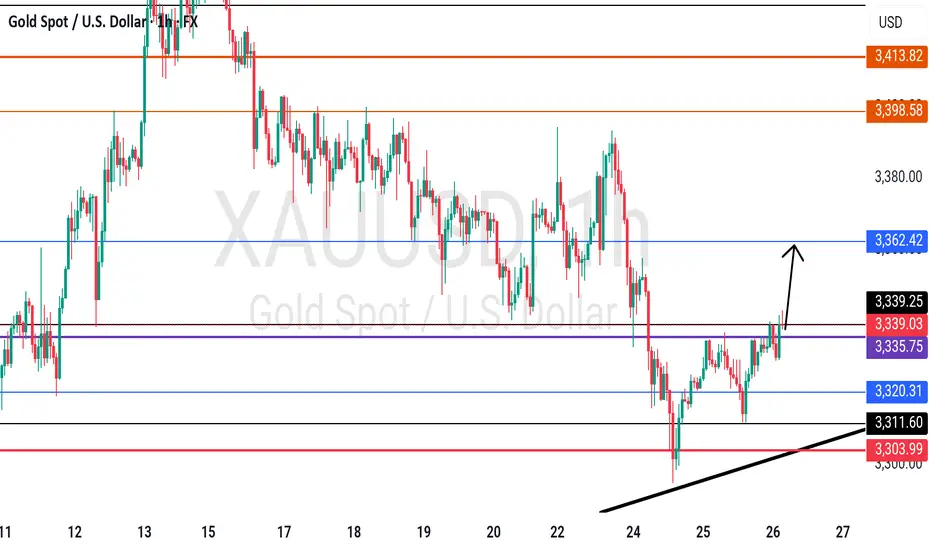
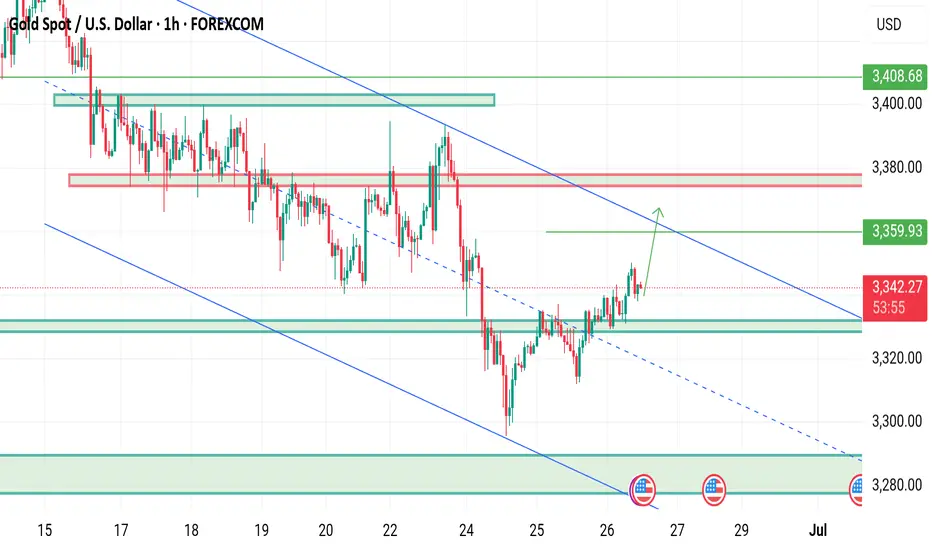
Gold (XAUUSD) – Pullback Setup Before Breakout? – JUNE 26, 2025🟡 GOLD PRICE OUTLOOK – June 26, 2025
Bias: Bullish | Looking for long entry on pullback
📊 Technical Overview :
OANDA:XAUUSD Gold continues to build a bullish market structure, forming consistent Higher Highs (HH) and Higher Lows (HL). Price is currently moving within a rising wedge, approaching a short-term resistance zone.
🔴 Sell Zone (Resistance) : 3359 – 3373
– Rising wedge top + upper trendline
– Fakeout trap possible near 3379.26
🟢 Buy Zone (Support) : 3294 – 3300
– Strong confluence zone
– Matches previous structure support + trendline
– Ideal for HL formation and long setup
🌍 Fundamentals & Macro Drivers :
💵 USD Weakness:
• DXY near 3.5-year low after Powell replacement rumors
• Boosting gold's upside momentum
☢ Geopolitical Risk:
• Iran–Israel ceasefire in place, but fragile
• Safe-haven demand still supportive
🏦 Central Bank Demand:
• 20% of global gold demand from central banks
• China 🇨🇳 & India 🇮🇳 are major buyers
📅 Upcoming Catalysts:
• US PCE Inflation & GDP due tomorrow
→ Weak data = Potential breakout above 3370+
📌 Trade Plan :
✔ Watch for rejection at 3359–3373
✔ Long setup if price retests 3294–3300
🎯 Target = 3370+
❌ Invalidation = Daily close below 3280
📈 Summary :
Gold remains structurally bullish, supported by weak USD, central bank demand, and macro risks.
Waiting for a healthy pullback into demand for long continuation setups.

The Direction After Sideways Fluctuation at 3330Trump's announcement of an Israel-Iran ceasefire dented safe-haven sentiment, curbing safe-haven buying 🛑. Gold opened with a sharp plunge, then extended losses as Powell later stated that more time is needed before considering rate cuts—dovish expectations eased, sending gold further lower ⬇️. The price briefly fell below the 3,300 level, nearing 3,295 at its lowest, but failed to breach the 3,290-3,300 support zone 📊. As I indicated yesterday, traders could test rebound strength near support; once news impacts faded, gold rebounded to close at 3,323 🔄.
Currently trading sideways around 3,330, gold faces resistance at 3,350 while downside support remains at 3,290-3,300 📈📉. We therefore maintain a bearish stance
⚡️⚡️⚡️ XAUUSD ⚡️⚡️⚡️
🚀 Sell@3345 - 3335
🚀 TP 3325 - 3315 - 3305
Accurate signals are updated every day 📈 If you encounter any problems during trading, these signals can serve as your reliable guide 🧭 Feel free to refer to them! I sincerely hope they'll be of great help to you 🌟 👇
XAUUSD and GBPJPY Analysis todayHello traders, this is a complete multiple timeframe analysis of this pair. We see could find significant trading opportunities as per analysis upon price action confirmation we may take this trade. Smash the like button if you find value in this analysis and drop a comment if you have any questions or let me know which pair to cover in my next analysis.
