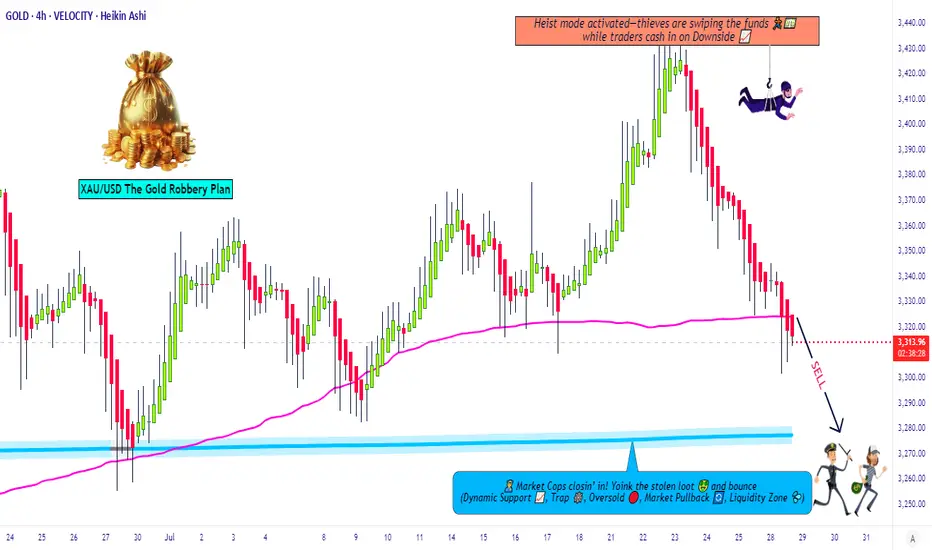
Gold Robbery Blueprint: Smart Bears on the Move Now!💣 XAU/USD GOLD HEIST PLAN: Robbery Begins at Resistance Zone! 🔐💰
🌟Hi! Hola! Ola! Bonjour! Hallo! Marhaba!🌟
Dear Money Makers & Market Robbers, 🕵️♂️💸🚀
Welcome to another strategic strike by Thief Trading Style™—where smart analysis meets bold execution. We're targeting XAU/USD (Gold) in this scalping/day-trade opportunity, primed with fundamentals, technicals, and pure robbery logic.
🔍 THE GAME PLAN
We're looking at a neutral zone turning bearish, and here’s how the robbery unfolds:
🔑 ENTRY POINTS
🎯 “Vault wide open” signal!
Initiate short orders at current price zones or set layered SELL LIMITS near swing highs on 15M/30M charts. We're running a DCA-style pullback entry for max loot.
🕵️♀️ Entry isn't about one shot—it's about precision raids.
🛑 STOP LOSS: THE ALARM SYSTEM
Set SL just above the nearest swing high (4H timeframe preferred).
Use candle wick tips as your defense line (Example: 3350.00).
Adjust SL based on risk appetite and number of orders stacked.
🎯 TARGET: THE GETAWAY PLAN
💸 First Vault: 3280.00
💨 Or escape earlier if price action signals reversal. Protect your gains. Professional thieves don't get greedy.
📊 WHY WE’RE ROBBING HERE
This level is a high-risk barricade zone—police aka "market makers" are strong here.
We spotted consolidation, oversold signals, trend reversal setups, and a bullish trap disguised as support. A perfect time to strike. 🧠🔍
📰 FUNDAMENTAL & SENTIMENTAL CHECKPOINTS
🔎 Stay updated with:
Global news drivers
Macro & Intermarket analysis
COT reports & future trend targets
👉 Check the 🔗🔗🔗
⚠️ TRADING ALERT - STAY SAFE DURING NEWS BOMBS!
Avoid entries during major economic data releases.
Use trailing SL to protect running profits.
Monitor volatility spikes & price anomalies.
💖 JOIN THE CREW, BOOST THE HEIST!
If this plan adds value to your trades, hit that Boost Button 💥
Support the Robberhood and help grow the gang of smart money snipers 🕶️💼💣
Every boost = more ammo for next mission. Let's rob the market—not each other. 🚀🤑
📌 Remember: Market is fluid. Stay sharp, adapt quick, and trade like a shadow.
Catch you soon in the next grand heist 🎭💼
#XAUUSD #GoldTrade #ScalpingStrategy #DayTrading #ThiefTrader #RobTheMarket #BoostForMore #NoChaseNoCase
Xauusdanalysis
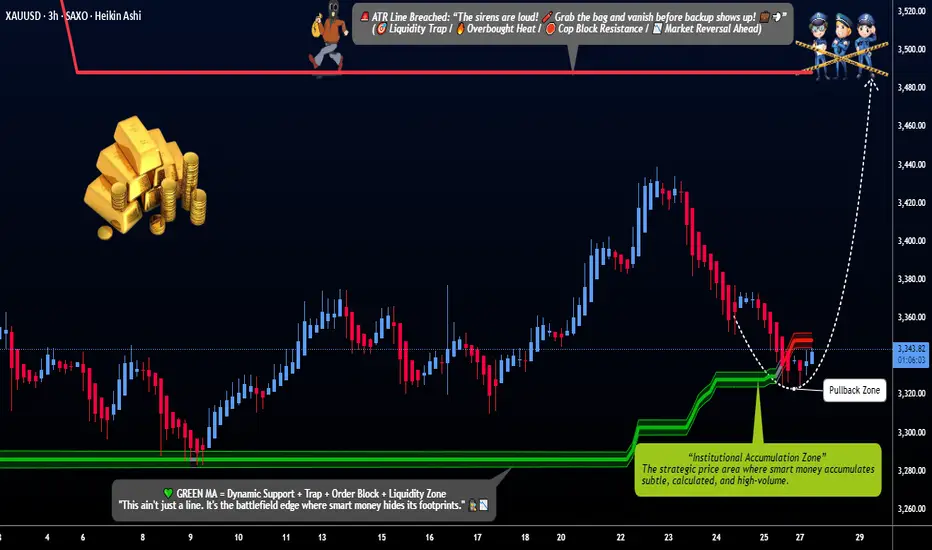
"XAU/USD Gold Heist Plan | Pullback Entry for Big Bullish Move"🔐💰“GOLD HEIST PLAN UNLOCKED: Thief Trader’s XAU/USD Breakout Blueprint”💰🔐
by The Market Robber a.k.a. Thief Trader – Stealing Pips, One Candle at a Time!
🌍 Hey Money Makers, Market Hustlers, Robbers, & Chart Crackers! 🌍
Bonjour! Hola! Marhaba! Hallo! Ola! What's poppin'?
Welcome to another exclusive robbery plan crafted in pure Thief Trading style—built off technicals, fundamentals, market psychology, and a bit of outlaw intuition. 💸⚔️
This one’s for the GOLD DIGGERS – literally. We’re targeting XAU/USD for a high-voltage bullish heist 🎯💥. Stick to the plan, follow the chart, and you might just make it out with a sack full of pips 💰🔥.
🔓 THE SETUP: GET READY TO ROB THE GOLD MARKET
We're eyeing a LONG ENTRY, with clear intent to break past the consolidation zone and avoid the trap laid by the "market police" at the ATR barricade zone 🚨. This level is where overbought drama and bear claws are strongest – we slip in, grab the profits, and bounce before they know what hit ‘em.
🧠 Use caution: This level is filled with liquidity traps, reversals, fakeouts and retail bait zones. Classic Thief style means we know where the guards are sleeping and where the cameras don't reach. 🎥🔕
💸 ENTRY PLAN:
🟢 Entry Zone: Watch for a pullback to 3320.00 or above. Don’t jump early.
💡 Tactics:
Use Buy Limit Orders (DCA / Layered Entry Style)
Drop them in on 15min/30min swing levels – catch price slipping into liquidity
Confirm with minor structure breaks / order block retests
🔔 Set those alerts – the real move happens when the breakout candle hits.
🛑 STOP LOSS STRATEGY:
🧠 Pro Rule: No stop-loss before breakout.
Once breakout confirms:
🔴 SL Zone: Recent swing low (approx. 3280.00) on the 4H chart
🎯 Adjust SL based on:
Lot size
Order count
Risk appetite
You know the game: manage your risk like a pro thief—quiet, calculated, and fast on the getaway. 💨
🎯 TARGET ZONE:
🏁 TP Zone: 3490.00
⚠️ Escape earlier if the pressure gets heavy – smart thieves never overstay the job.
🧲 SCALP MODE:
Only scalp LONG SIDE – don’t get caught chasing shorts unless you're rich enough to burn your drawdown 🔥
🔐 Use trailing SL to secure bags while climbing the ladder.
🧠 FUNDAMENTALS & MACRO EDGE:
The Gold market is currently in a BEAR structure with hints of bullish reversal potential. This heist isn’t just technical – it’s backed by:
🌍 Global Macro Flows
💼 COT Reports
📰 Sentiment & News Risk
💣 Geo-political Heat
📊 Intermarket Analysis (Dollar, Yields, Risk-On/Off correlations)
Dig deep for the full macro breakdown. Knowledge is leverage.
(Find full reports on reputable sources — you know where to look 👀)
🚨 RISK ALERT:
Before, During & After News Releases:
Avoid fresh entries 🔕
Use Trailing SLs to protect live trades
Watch spread spikes & low-liquidity traps
👉 Don't trade when the market's drunk.
💖 SHOW LOVE – BOOST THE PLAN:
💥Smash that Boost Button💥 if you want more precision heist strategies like this. Support the Thief Trading Style, and we’ll keep robbing the markets clean and teaching the crew how to get in & get out profit-heavy. 🏴☠️📈💰
🎭 I’ll be back with another chart crime scene soon. Until then, stay sneaky, stay profitable, and always move like the market’s watching (because it is). 😎
🔐 Thief Trader Out. Rob. Exit. Repeat. 🔁💸
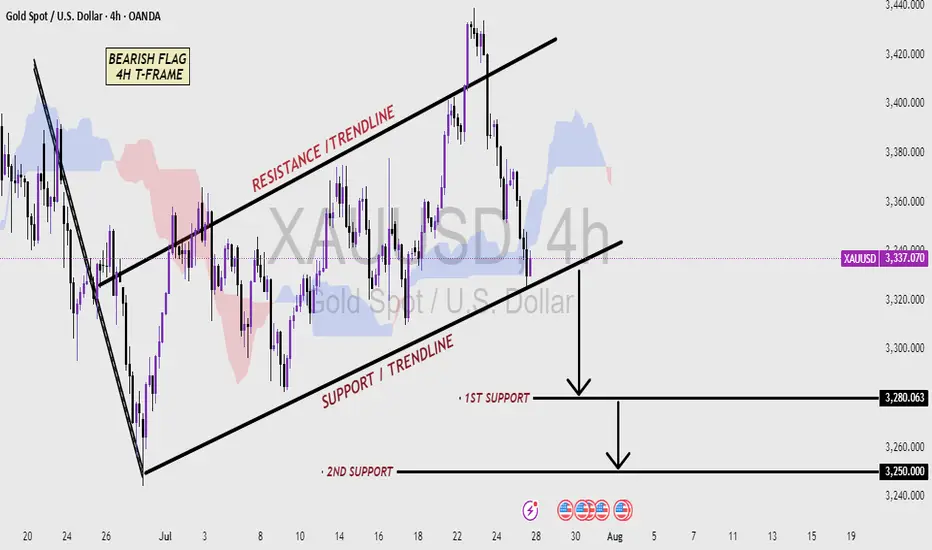
XAUUSD 4H CHART - Bearish pattern Analysis (read the caption)📉 XAUUSD 4H Chart – Bearish Flag Pattern Analysis
This 4-hour chart of Gold (XAUUSD) shows a classic Bearish Flag pattern, which is typically a continuation signal in a downtrend. After a strong bearish move, price entered a consolidation phase inside a rising channel, forming higher highs and higher lows—this creates the flag structure.
The price is currently trading within the Resistance and Support Trendlines of the flag. A break below the Support Trendline would confirm the bearish flag breakout, suggesting a continuation of the downtrend.
Key support levels to watch:
🔻 First Support: 3280.063 – Initial target after breakout
🔻 Second Support: 3250.000 – Extended target if bearish momentum continues
Traders should monitor for a confirmed breakdown with volume and bearish candlestick confirmation to validate short entries. This setup favors sellers if the support breaks decisively.
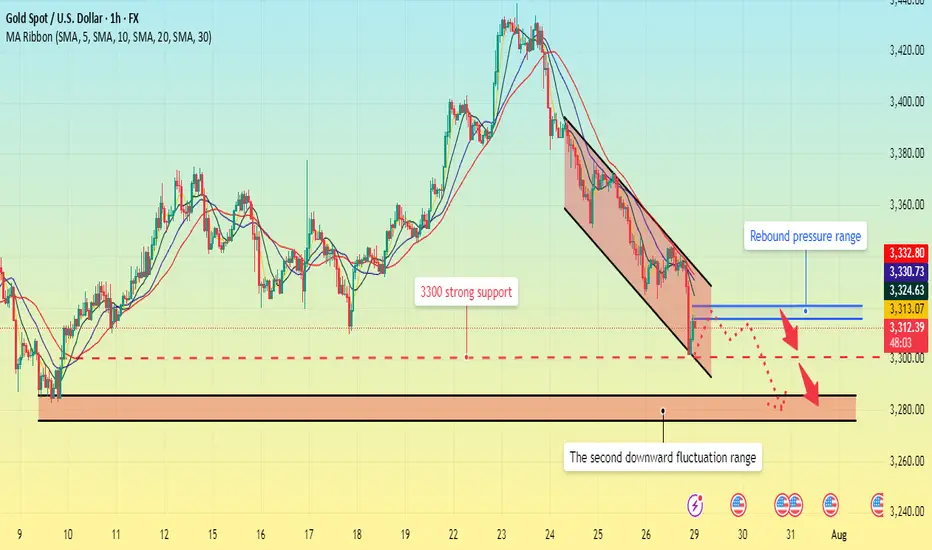
Gold fell below support. What will be the subsequent trend?The 1-hour moving average of gold continues to show a downward short position, indicating that the downward momentum is still sufficient; the wave pattern of gold's current decline remains intact, but the rebound strength is very weak, showing an obvious short trend of gold. Moreover, when gold rebounded in the short term, obvious resistance began to form above 3320, and the upward momentum was slightly insufficient.
From the daily chart, before 3300 fails to fall, it is likely to fluctuate around 3300-3350. On the contrary, if it falls below 3300, it is likely to reach the bottom of the 3385-3375 range.
This week is a super data week. The data of each day may affect the trend of gold on that day, but it will not form a unilateral strong trend. Therefore, the volatility before and after the data is released is likely to be large, so traders should focus on the following data:
1. US ADP employment report, US second quarter GDP preliminary value;
2. Federal Reserve interest rate decision;
3. US PCE annual rate, monthly rate;
4. The last trading day of this week will usher in non-agricultural data.
GOLD Continuation and ReversalIt still needs one more fall
Sell from 3348 to 3312
Buy from 3312 to 3392
GG

3300 may fall below, possibly setting a new low#XAUUSD
From the daily chart perspective, gold has a tendency to form a converging triangle, and observing the technical indicators of the daily chart, the downward trend may have just begun📉.
So, how should we plan for the evening?📊 Now there are certainly many outside buyers who will continue to increase their positions and try to recover their losses💰. So, should we continue to be long?📈 My opinion is to wait and see.👀 If the daily chart does not fall below 3300 points, it will consolidate between 3300 and 3350 points in the future. If it falls below 3300 points, we will next focus on the support level of 3295-3285 points, and then consider whether to go long🤔.
If you are more aggressive, you can consider going long near 3305 points and exit after earning $10-20. All opinions have been informed and everyone can choose to adopt them according to their own circumstances.😄
Institutional Footprint Detected Gold Hits FVG + Breaker Block.GOLD has now entered a significant confluence zone, aligning with both a bullish Fair Value Gap (FVG) and a breaker block areas commonly respected by institutional algorithms. In the process, it has also swept sell-side liquidity resting below recent lows, which often serves as fuel for a reversal. This combination of technical factors suggests a high-probability scenario for a bullish bounce from this region.
Traders should closely monitor price behavior around the marked Equal Relative Liquidity (ERL) zone for additional confirmation before executing any trades.
Always conduct your own analysis (DYOR) and manage risk accordingly.

How to plan for the evening, pay attention to the 3300 markAfter the shorts took profits, gold consolidated in the 3310-3300 area. Judging from the daily chart, the decline in gold seems to have just begun, with the middle track of the Bollinger Band at around 3345 and the lower track at 3285. The possibility of falling below the 3300 mark cannot be ruled out in the evening. If gold falls below the 3300 mark, it may first hit 3295. If the decline continues, it may even hit the low of 3285-3275 below. However, if the 3300 mark can be effectively defended, then the possibility of maintaining the consolidation of 3300-3345 in the evening may be maintained. Therefore, it is not recommended to easily participate in transactions at the current position in the evening. It is mainly advisable to wait and see and pay attention to the breakthrough of the 3300 mark.
My premium privileges are about to expire, and subsequent trading strategies and analysis will be published in the group.

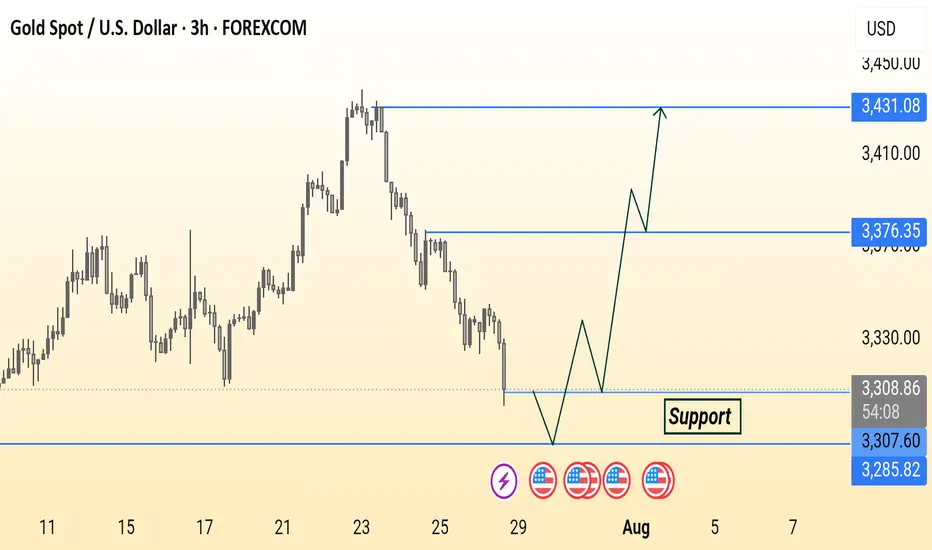
Xauusd bullish setupGold (XAU/USD) is approaching a key support zone around 3,285.82. The chart suggests a potential bullish reversal from this level, targeting resistances at 3,376.35 and 3,431.08. Price action may form a double bottom before moving upward.
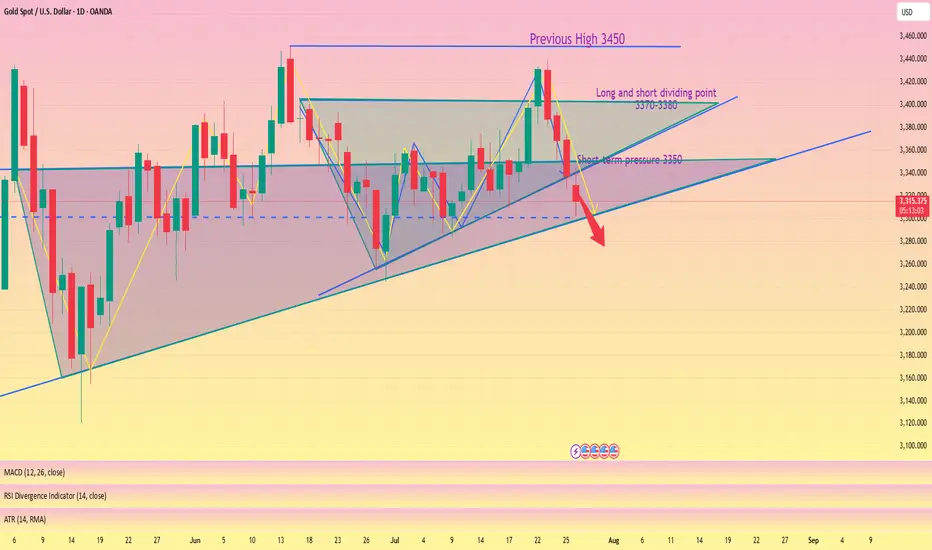
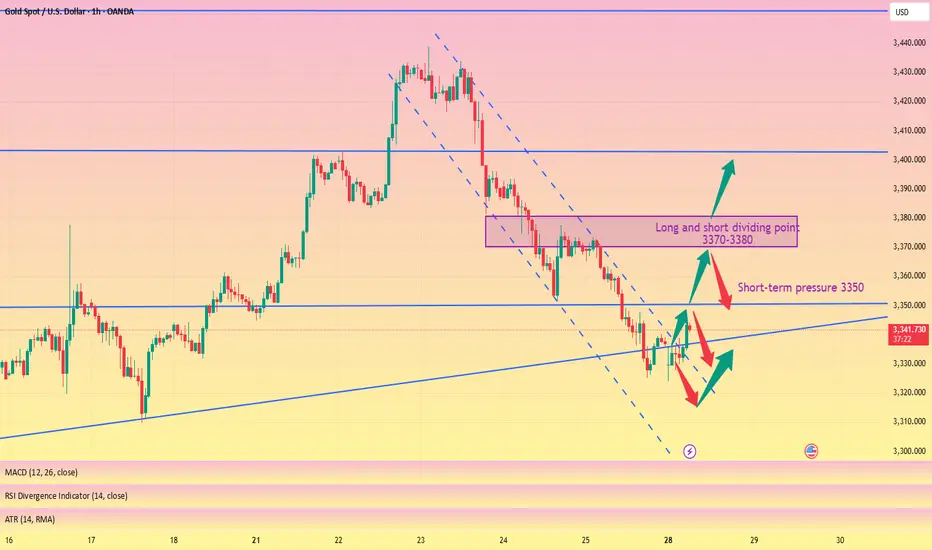
Monday market forecast and analysis ideas#XAUUSD
There will be a lot of data next week, such as the 8.1 tariff deadline that I have repeatedly emphasized, the Federal Reserve decision, NFP data, etc. It can be said that it is relatively difficult to analyze purely from a technical perspective, because there is uncertainty in many data, the data results are often non-linearly correlated with market reactions (good news does not necessarily lead to a rise, and bad news does not necessarily lead to a fall), and large fluctuations can easily form oscillating K-lines with long upper and lower shadows. Therefore, the first arrangement for next week is to participate in trading with a light position and avoid letting emotions control your thinking.
The closing price on Friday was near 3337, proving that the short-term judgment on the rebound momentum of gold is correct, so there are two possible situations on Monday.
1. The first thing we need to pay attention to is 3345-3350 to determine whether it constitutes a short-term pressure level. The weekly line closed with a negative cross star. Combined with the monthly line trend, in terms of support, focus on the trend line support near this week's low of 3325. If this position is not broken, the market is expected to usher in a wave of rebound; if it falls below 3325, the bottom may look to 3310 or even 3295 for support.
2. The rebound momentum of Friday continued on Monday, breaking through 3350 first, and then it is possible to reach the previous high resistance area of 3370-3380. If it encounters resistance here, gold will continue to fall and fluctuate, and the target may even be 3310. If the price remains strong and issues such as interest rate cuts and tariffs are imminent, it means that the short-term downward trend has ended and may even set a new high.
The above content is only a forecast for Monday’s market. It will be greatly affected by data and news, and may be adjusted in real time next week based on intraday trends. You can refer to this, but remember not to be swayed by emotions. We will participate with a light position, and the specific trading strategy can wait for my trading signal.
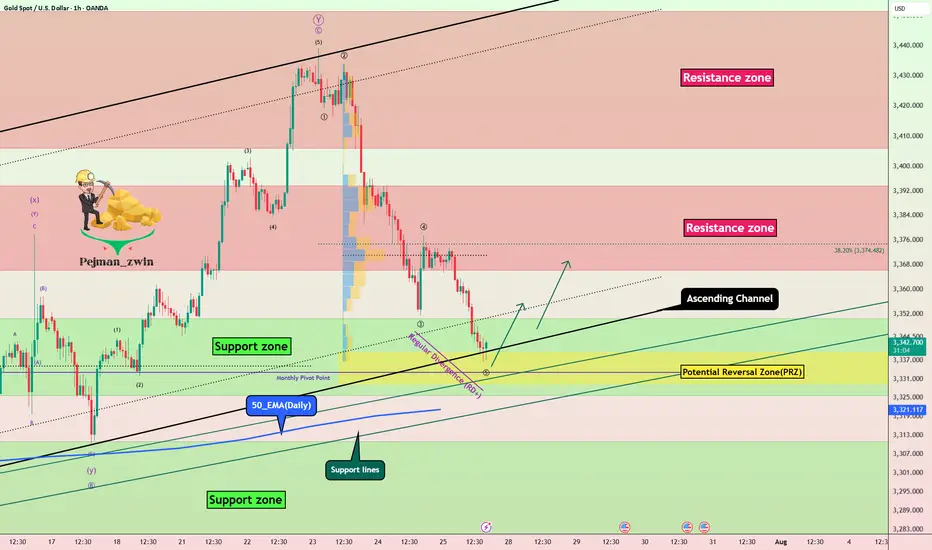
Gold Recovery Setup = Divergence + Support ClusterGold ( OANDA:XAUUSD ) fell to the lower line of the ascending channel and the Support zone($3,350-$3,326) , as I expected in my previous idea .
Gold is currently near a set of Supports .
Supports:
Support zone: $3,350-$3,326
Monthly Pivot Point: $3,333
Potential Reversal Zone(PRZ): $3,339-$3,329
Lower line of the ascending Channel
50_EMA(Daily)
Support lines
In terms of Elliott Wave theory , Gold appears to be completing a bearish wave 5 .
Also, we can see the Regular Divergence(RD+) between Consecutive Valleys .
I expect Gold to rise to at least $3,359 .
Second target: $3,367
Note: Stop Loss (SL) = $3,319
Do you think Gold can break the Support cluster by the end of trading hours?
Gold Analyze (XAUUSD), 1-hour time frame.
Be sure to follow the updated ideas.
Do not forget to put a Stop loss for your positions (For every position you want to open).
Please follow your strategy; this is just my idea, and I will gladly see your ideas in this post.
Please do not forget the ✅ ' like ' ✅ button 🙏😊 & Share it with your friends; thanks, and Trade safe.
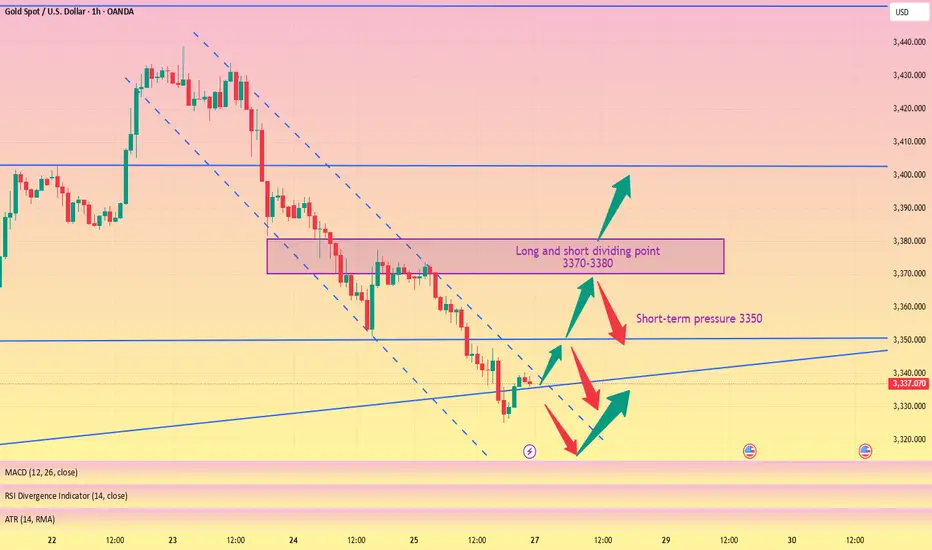
Pay attention to 3350 gains and lossesGood morning, bros. This morning gold again tested last week's low near 3325. From the chart, gold may continue to rise this week, with tariffs approaching, the Fed's interest rate cut, and NFP data imminent. The current strength and weakness are at 3350-3355. If it can effectively break through and stand above, it is expected to continue to test the previous high point, which is also the long-short dividing point of 3370-3380.
From the daily chart, there is not much change in the operational range of gold in the short term, and the change in the 4H chart is more obvious. After the decline in the early trading, it is now rebounding. There is a possibility of closing positive at the low. If it is directly positive on Monday, then it will bottom out directly at the beginning of the week. If it refreshes the low on Monday, the low point of 3285 will be seen below. Therefore, today's market focuses on the continuity of long and short. Of course, according to the current changes, the biggest possibility is to continue to rebound at the low point, pay attention to the support of 3310-3300 below, and pay attention to the gains and losses of the high point of 3355 above.

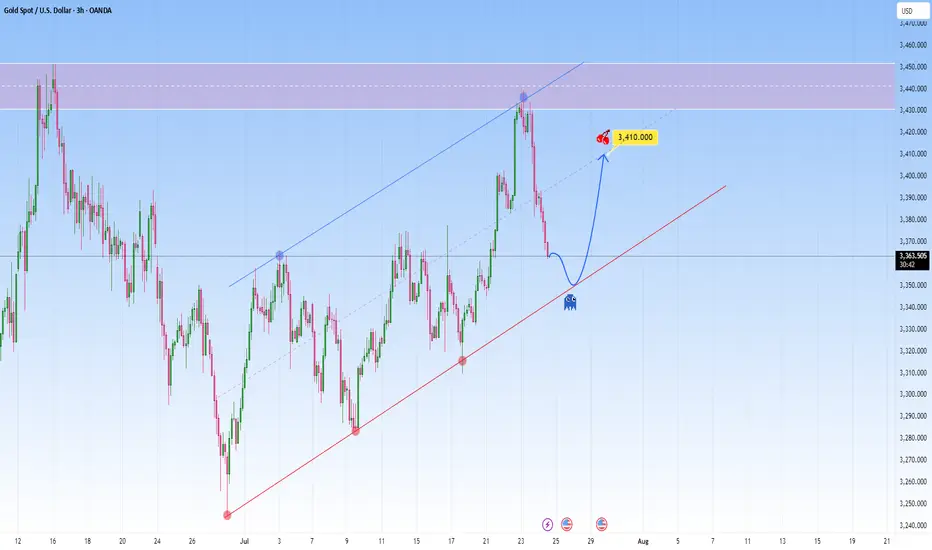
GOLD Reawakened: Corrects firmly but conditions remain bullishFrom a technical perspective Gold is climbing in a parallel channel, clearly bullish with a rhythm that’s hard to ignore. Price just bounced off the resistance with force, a classic overextension flush.
And the market is now approaching the lower boundary of this projected channel. This confluence of technical support is likely to attract renewed buying interest.
I expect it to bounce back toward 3,410, somewhere around the middle of the channel. The move up may not be determined right away. It could be consolitaing, fake dips first, or sudden acceleration.
The correction is quite surprise. What direction for GOLD price?✏️Quite surprised with the adjustment of gold at the end of the previous trading week. The rising price channel is still holding around the lower border of the price channel around 3316. A liquidity sweep and candle wick removal in this area is considered a good buying opportunity.
If h1 closes below this border, limit trading BUY signals until the bottom support of 3286. When the price can close the candle below 3316, gold will trade in a wide range and there is no main trend dominating the market.
📉 Key Levels
Support: 3316-3286
Resistance: 3372-3400-3418
Buy trigger: Reject and Trading above 3316
BUY DCA Break 3372
Target: 3400
SELL Trigger: Break bellow and Retest 3416
Leave your comments on the idea. I am happy to read your views.

Market forecasts are completely accurate, trading signals#XAUUSD
After opening today, gold tested the lowest point near 3324 and then rebounded, which is in line with my prediction of gold trend last night. Next, we need to pay attention to whether the upper 3345-3350 constitutes a short-term pressure level. If you are aggressive, you can consider shorting at 3345-3350, with the target at 3330-3325. Continue to hold if it falls below 3325, and stop loss if it breaks above 3350. After it breaks above, you can consider following up with a long order to close the position at 3360-3370. Short once at 3370-3380 for the first time, and stop loss if it breaks above 3380.
🚀 SELL 3345-3350
🚀 TP 3330-3325
🚀 BUY 3352-3355
🚀 TP 3360-3370
🚀 SELL 3370-3380
🚀 TP 3345-3325-3310
Be sure to study my trading strategy carefully. If you only look at the price points, you will definitely suffer certain losses. Participate in the transaction at the right time based on your own account funds and set stop losses.
gold on buy reverse#XAUUSD price have multiple reject between the third range, now we expect for breakout to buy.
Above 3339 holds bullish reverse, target 3345-3358. 3345 can reverse back on sell.
Below 3330 on 2 times breakout will drop the price till 3320-3300

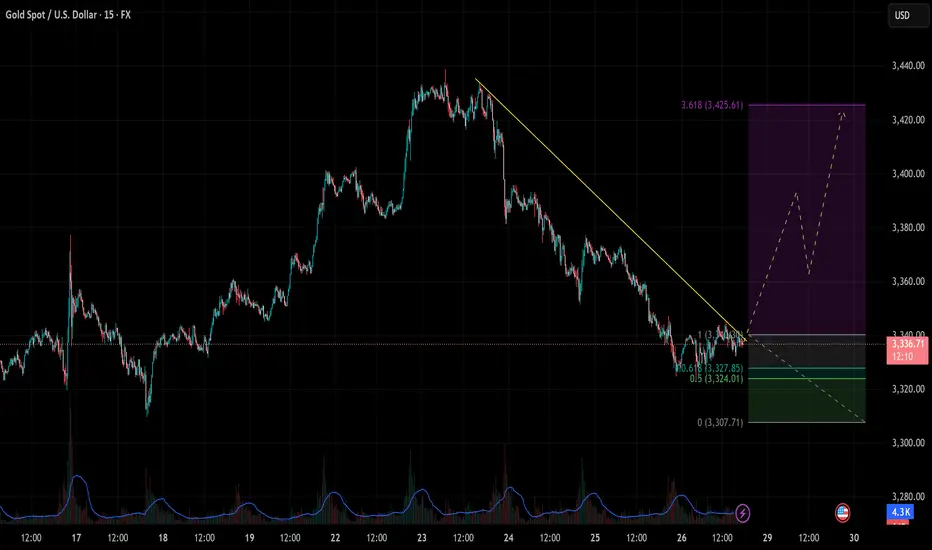
[XAUUSD] Reversal Signals from Key Support As of the July 28–29 trading sessions, the XAUUSD 15-minute chart is showing early signs of a bullish reversal, with price reacting strongly at a key Fibonacci support zone and breaking through a descending trendline.
1. Price Action and Technical Structure
After a prolonged downtrend from the 3,430 zone, gold found support at the 0.618 Fibonacci retracement (3,327.85), aligning closely with the horizontal support at 3,324 – 3,327.
A descending trendline has been breached, signaling a potential breakout setup.
A potential ZigZag corrective wave structure is forming, hinting at the beginning of a new bullish swing.
2. Fibonacci Extension & Upside Targets
The Fibonacci extension tool suggests a possible rally toward the 3.618 extension at 3,425.
This level marks the next major upside target if the breakout holds.
3. Key Price Levels
Price Zone
Technical Significance: 3,327 – 3,324 Major support zone (Fib 0.618 + horizontal support)
3,350 – 3,355 First reaction zone / interim resistance
3,380 – 3,400 Strong resistance zone
3,425 Final target – 3.618 Fib extension
4. Suggested Trading Strategy
Long Setup – Breakout & Reversal Confirmation
Entry: 3,328 – 3,332 (after bullish confirmation above trendline and support)
Stop Loss: Below 3,320 (beneath local swing low)
Take Profit: 3,355 → 3,380 → 3,425 (scaling out by zone)
Bearish Continuation Scenario
If price drops below 3,320 and breaks 3,307 support, the bullish outlook is invalidated, and a retest of deeper levels is likely.
5. Volume and Confirmation Cues
Volume has started to pick up as price tests the breakout zone – indicating that buying pressure may be returning.
Wait for a strong bullish candle with volume above average before committing to the trade.
Gold is approaching a critical inflection point, and bulls may regain control from this confluence support zone. Stay alert for a breakout confirmation. Save this idea if you find it helpful and follow for more high-probability strategies!
XAUUSD and AUDUSD Analysis todayHello traders, this is a complete multiple timeframe analysis of this pair. We see could find significant trading opportunities as per analysis upon price action confirmation we may take this trade. Smash the like button if you find value in this analysis and drop a comment if you have any questions or let me know which pair to cover in my next analysis.

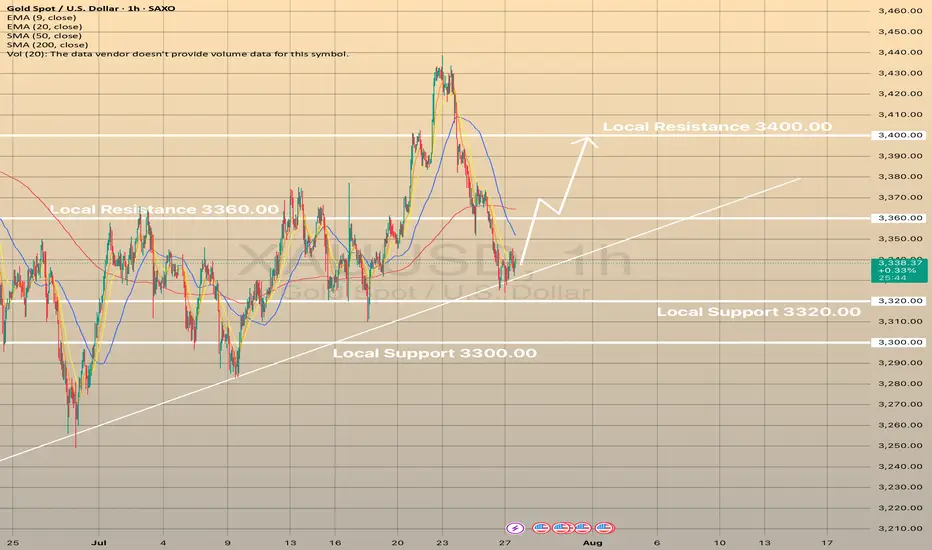
XAUUSD REBOUNDED FROM CURRENT TRENDLINE. WHAT'S NEXT?XAUUSD REBOUNDED FROM CURRENT TRENDLINE. WHAT'S NEXT?
Gold had successfully rebounded from the trendline, still showing mid-term bullish trend despite recent news on U.S. - E.U. and U.S. - Japan trade deals. Currently price is attempting to hold above the EMA20 on 1-h chart timeframe.
If this occurs and the asset develops another short-term bullish impulse, we may expect the price to reach 3,360.00 resistance level with further possible impulse towards 3,400.00 level.
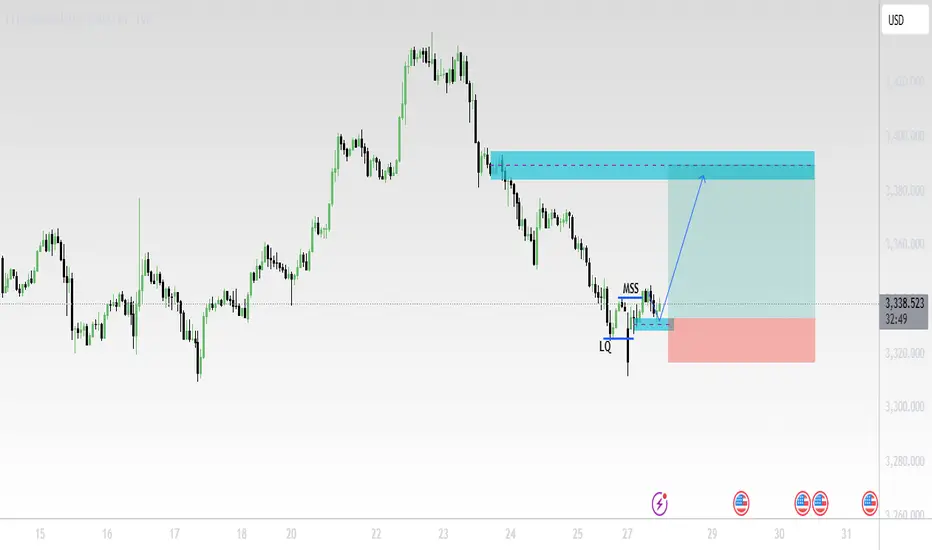
XAUUSD (Gold/USD) – 1H Chart Analysis (July 28, 2025)🔍 Technical Summary:
Market Structure Shift (MSS) detected after liquidity (LQ) grab.
Price formed a bullish break of structure confirming a possible trend reversal.
Entry taken near support (after LQ), targeting a supply zone above.
📊 Key Chart Elements:
LQ (Liquidity Grab):
Price swept previous lows, triggering stop-losses before reversing.
MSS (Market Structure Shift):
Break of internal structure confirms potential upside movement.
Blue Zone (Target Area):
A clear supply zone, likely to act as resistance.
TP (Take Profit) placed just below this zone.
SL (Stop Loss):
Positioned below the recent low (LQ) – tight risk management.
📈 Outlook:
Expecting bullish continuation towards 3,380+ zone.
If price respects support and structure holds, long entries remain valid.
Watch for reaction at the supply zone – potential rejection or consolidation.
⚠️ Disclaimer:
This is not financial advice. Always do your own research before trading.

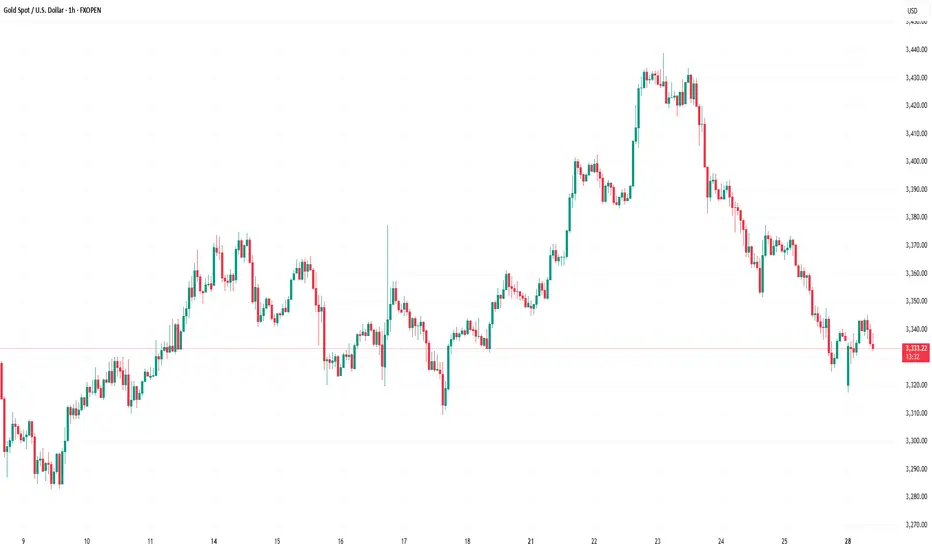
Market Analysis: Gold Prices Ease – Market Awaits Fresh CatalystMarket Analysis: Gold Prices Ease – Market Awaits Fresh Catalyst
Gold price started a fresh decline below $3,380.
Important Takeaways for Gold Price Analysis Today
- Gold price climbed higher toward the $3,430 zone before there was a sharp decline against the US Dollar.
- A key bearish trend line is forming with resistance near $3,350 on the hourly chart of gold at FXOpen.
Gold Price Technical Analysis
On the hourly chart of gold at FXOpen, the price climbed above the $3,380 resistance. The price even spiked above $3,400 before the bears appeared.
A high was formed near $3,432 before there was a fresh decline. There was a move below the $3,380 support level. The bears even pushed the price below the $3,350 support and the 50-hour simple moving average.
It tested the $3,325 zone. A low was formed near $3,325 and the price is now showing bearish signs. There was a minor recovery wave towards the 23.6% Fib retracement level of the downward move from the $3,433 swing high to the $3,325 low.
However, the bears are active below $3,342. Immediate resistance is near $3,350. There is also a key bearish trend line forming with resistance near $3,350.
The next major resistance is near the $3,380 zone. It is close to the 50% Fib retracement level of the downward move from the $3,433 swing high to the $3,325 low. The main resistance could be $3,410, above which the price could test $3,432. The next major resistance is $3,450.
An upside break above $3,450 could send the gold price towards $3,465. Any more gains may perhaps set the pace for an increase toward the $3,480 level.
Initial support on the downside is near the $3,325 level. The first major support is near the $3,310 level. If there is a downside break below it, the price might decline further. In the stated case, the price might drop towards the $3,265 support.
This article represents the opinion of the Companies operating under the FXOpen brand only. It is not to be construed as an offer, solicitation, or recommendation with respect to products and services provided by the Companies operating under the FXOpen brand, nor is it to be considered financial advice.
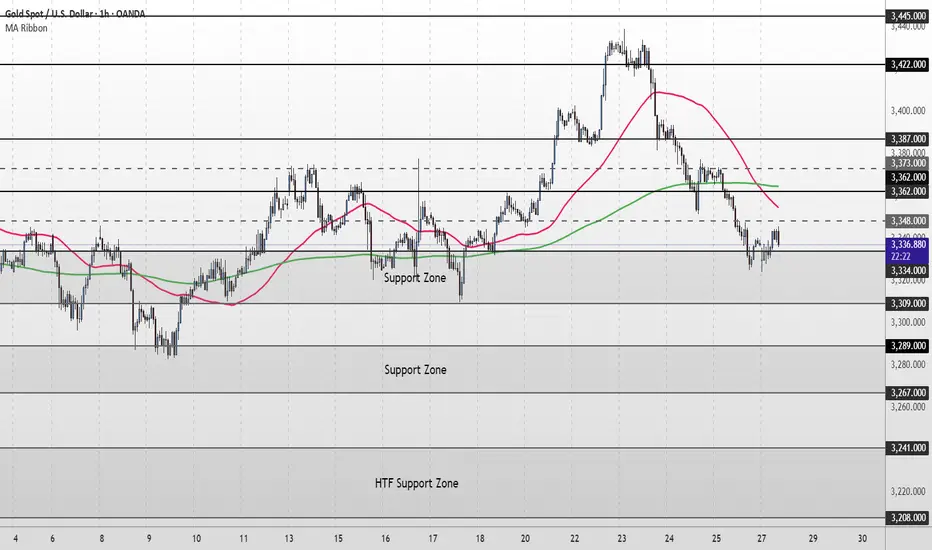
XAU/USD Intraday Plan | Support & Resistance to WatchGold starts the new week attempting to recover after last week’s drop, now trading around 3,339, just above the 3,334 intraday support.
Price remains below both the 50MA and 200MA, which are now turning downward—signalling a shift to short-term bearish structure. To regain upside momentum, bulls need to reclaim the 3,362 resistance zone. A confirmed break above this area would re-open the path toward 3,373, 3,380, and 3,387.
Until then, structure favors the bears, and any rejection below 3,362 keeps risk tilted to the downside. A break back below 3,334 would expose price to the lower Support 3,309.
If that gives out, watch for deeper downside toward 3,289-3,267 and the HTF Support Zone (3,241–3,208).
📌 Key Levels to Watch
Resistance: 3,348 ‣ 3,362 ‣ 3,373 ‣ 3,380 ‣ 3,387
Support: 3,334 ‣ 3,309 ‣ 3,289 ‣ 3,267 ‣ 3,241
🔍Fundamental Focus:
This is a high-impact week for gold traders.
Expect spikes in volatility, especially around FOMC and NFP. Use wider stops, reduce position sizes, and trade only confirmed setups.