Wait for 3330 to buy the bottom and reduce unnecessary operation#XAUUSD
We have made good profits from short selling yesterday. Currently, gold has fallen to 3350📎. The 4HMACD death cross has increased in volume and is expected to continue to decline. Consider going long near 3330📈. I don’t think it is prudent to bottom out at 3340. Move forward steadily on Friday and reduce unnecessary operations⚖️.
🚀 BUY 3335-3330
🚀 TP 3345-3362
Xauusdanalysis
Be alert to new lows, pay attention to 3350 and go long at 3330📰 News information:
1. Tariff issues
2. Next week's NFP data
📈 Technical Analysis:
Last night, gold rebounded to only around 3377 before starting to fall back. Our judgment that the current rebound is weak is completely correct. 3350 is the support point of the bottoming out and rebounding to nearly $20 last night. Whether the European session can go down to 3350 will determine the trend of gold.
From the daily chart, the daily line has fallen for two consecutive days, suggesting that the price may continue to fall today. At present, we need to pay attention to this week's starting point of 3344-3345, and then the 3330 line below. The extreme decline is 3320-3310. At the same time, the narrowing of the daily Bollinger Bands is also paving the way for next week's NFP data.
From the 4H chart, the current MACD indicator crosses and increases in volume, and the middle track of the Bollinger Bands and SMA30 basically overlap near 3388. As for the hourly chart, the upper pressure is mainly concentrated near 3375-3377, which is also the high point of the rebound last night. If gold rebounds directly upward and encounters pressure and resistance at 3375-3385 for the first time, you can consider shorting and strictly implement stop loss.
Overall, if the current market falls to 3350-3345 for the first time and gets effective support, you can consider going long with a light position, defend 3340, and look to 3356-3362; if the decline is strong and continues to fall below 3350, the best stable long point for the day is 3330-3320, defend 3310, and earn $10-20 to leave the market.
🎯 Trading Points:
BUY 3350-3345
TP 3356-3362
BUY 3330-3320
TP 3345-3360
In addition to investment, life also includes poetry, distant places, and Allen. Facing the market is actually facing yourself, correcting your shortcomings, facing your mistakes, and exercising strict self-discipline. I share free trading strategies and analysis ideas every day for reference by brothers. I hope my analysis can help you.
TVC:GOLD PEPPERSTONE:XAUUSD FOREXCOM:XAUUSD FX:XAUUSD OANDA:XAUUSD FXOPEN:XAUUSD
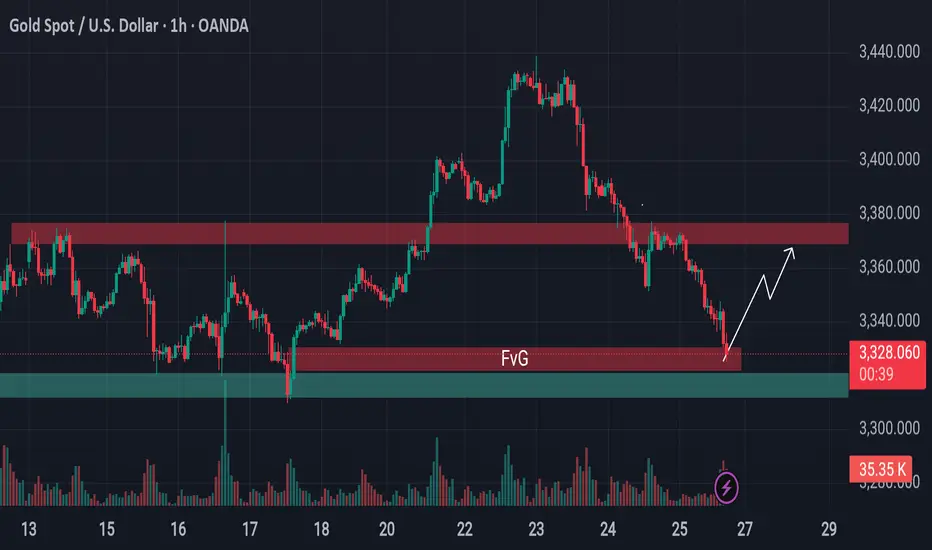
From Breakdown to Breakout? Gold Eyes Support Based Reversal!Gold is approaching a critical support area.
Previously, the price was holding above a key support level, but that zone has now been breached and is likely to act as resistance going forward. However, just beneath the current price, there's a well-established support level still intact—reinforced further by the presence of a bullish Fair Value Gap (FVG).
This setup hints at a possible reversal or a short-term surge from this zone. If market conditions align, gold may stage a pump from here. Keep this level on your radar—it could turn into a decisive point for price direction.
🛡 Always conduct your own analysis before taking any trades. DYOR.
GOLD SELLGold price bears retain control amid fading safe-haven demand, rebounding USD
US President Donald Trump announced late Tuesday that his administration had reached a trade deal with Japan. Furthermore, reports that the US and the European Union are heading towards a 15% trade deal boost investors' confidence and weigh on the safe-haven Gold price for the second straight day on Thursday.
The markets do not expect an interest rate cut from the US Federal Reserve in July despite Trump's continuous push for lower borrowing costs. In fact, Trump has been attacking Fed Chair Jerome Powell personally over his stance on holding rates and repeatedly calling for the central bank chief's resignation.
Moreover, Fed Governor Chris Waller and Trump appointee Vice Chair for Supervision Michelle Bowman have advocated a rate reduction as soon as the next policy meeting on July 30. This keeps the US Dollar depressed near a two-and-a-half-week low and could offer some support to the non-yielding yellow metal.
Traders now look forward to the release of flash PMIs, which would provide a fresh insight into the global economic health and influence the safe-haven commodity. Apart from this, the crucial European Central Bank policy decision might infuse some volatility in the markets and drive the XAU/USD pair.
Meanwhile, the US economic docket features Weekly Initial Jobless Claims and New Home Sales data, which, in turn, would drive the USD and contribute to producing short-term trading opportunities around the commodity. Nevertheless, the fundamental backdrop warrants caution for aggressive traders.
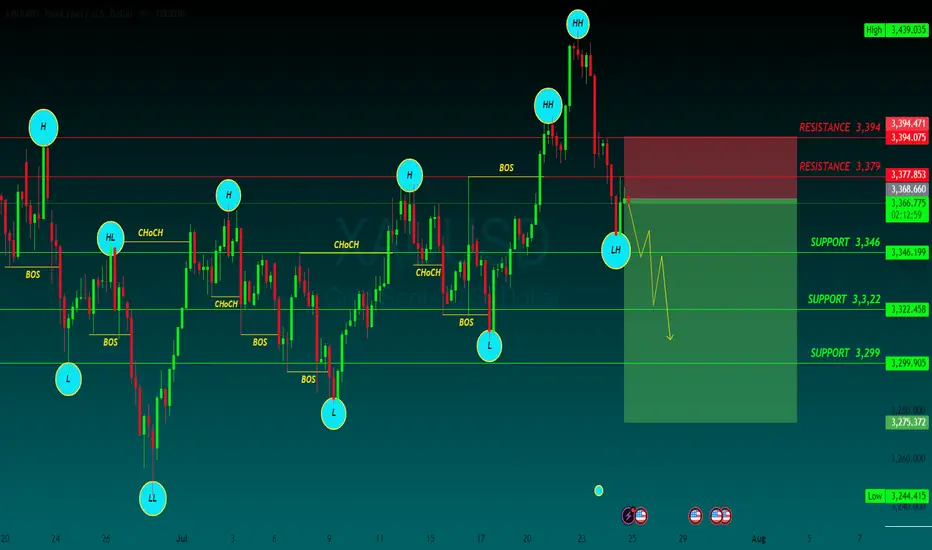
SUPPORT 3,346
SUPPORT 3,322
SUPPORT 3,399
RESISTANCE 3,394
RESISTANCE 3,379
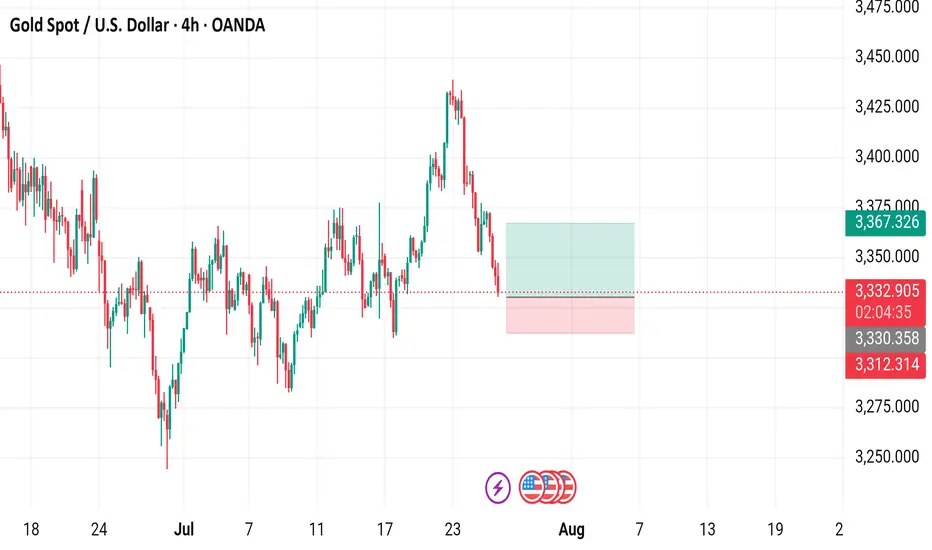
Gold Spot / U.S. Dollar (XAUUSD) - 4 Hour Chart (OANDA)4-hour chart from OANDA displays the price movement of Gold Spot (XAUUSD) from late July to early August 2025. The current price is $3,332.775, reflecting a decrease of $35.935 (-1.07%) as of 07:54 PM PKT on July 25, 2025. Key levels include a sell price of $3,332.480 and a buy price of $3,333.050. The chart shows recent volatility with a shaded support zone around $3,312.314 to $3,367.326, indicating potential price stabilization or reversal areas.
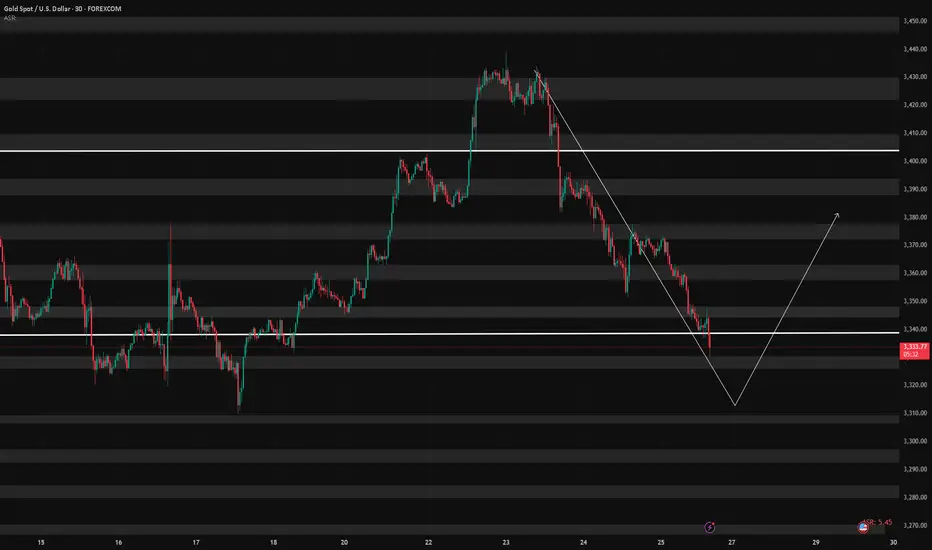
7/25: Key Levels to Watch Closely for Next Week's TradingGood evening, everyone!
Due to health reasons, I had to take a short break from updates — thank you all for your understanding and support.
This week, gold rallied to the 3440 level, forming a double-top pattern, and has since entered a phase of consolidation with a downward bias, currently retracing back to the key 3337-332 support area.
While a short-term rebound is possible from the 30-minute chart perspective, the weekly structure is not favorable to the bulls. On the daily chart, price has once again reached the MA60 support, and is currently forming three consecutive bearish candles, which suggests that bearish momentum may continue.
Unless there is significant bullish news next week, the market may remain under pressure. Key levels to monitor:
Upside resistance zones: 3343, 3352, 3358, 3366, 3372, 3378, and 3386–3392
Downside support zones: 3337, 3332, 3323, 3312
If the weekly chart breaks down, watch for: 3300 psychological level and 3260 (weekly MA20)
Additionally, during this week's decline, a price gap has been left between 3395–3398. If the market starts to rebound on the 2-hour chart, there is a chance this gap will be filled. However, this area also serves as strong resistance, and any approach toward it could result in heavy selling pressure. Caution is advised in the event of a sharp rally.
I'm still recovering and unable to monitor the markets for extended periods. Once my health improves, I’ll resume regular updates. In the meantime, feel free to leave any questions, and I’ll do my best to respond. Thanks again for your continued support, and I wish everyone success and strong profits in the market!
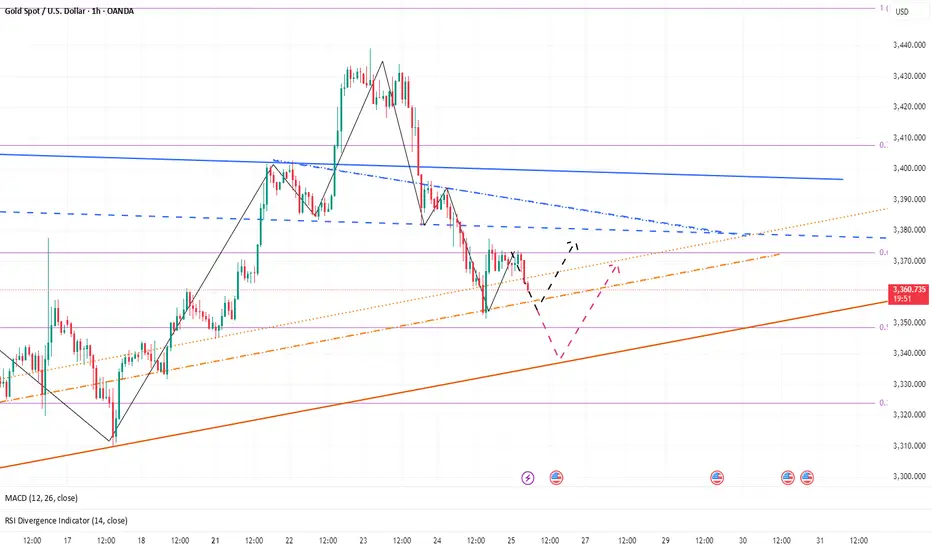
GOLD - at Cut n Reverse Region, whats next ??#GOLD - market just reached at his ultimate area and keep in mind that if market break his current region than it will go further and nose dive..
NOTE: cut n reverse below our mentioned region..
Gold Softens — Watching for a Tactical Long OpportunityYesterday, gold hit a low of around 3351 and then began to rebound. During the rebound, it hit a high of around 3377 and then retreated again. We can clearly see that below 3400, gold is still weak overall, and even failed to reach 3380 during the rebound. In the short term, the 3380-3390 area has become an obvious resistance area.
Yesterday, gold rebounded after dropping to around 3351. Whether the support near 3350 is effective has not been verified again, so from a technical perspective, gold still has the need to retreat again and test the support near 3350. Once gold falls below the area when testing the support near 3350, gold may continue to fall to the 3335-3325 area.
Therefore, in today's trading, the focus is still on shorting gold, supplemented by trying to go long on gold with the support.
1. Consider shorting gold in the 3380-3390 area, TP: 3365-3355;
2. Consider going long gold in the 3355-3345 area, TP: 3365-3375; strictly set SL
3. If the 3355-3345 area is broken, try to go long gold again in 3335-3325, TP: 3360-3370
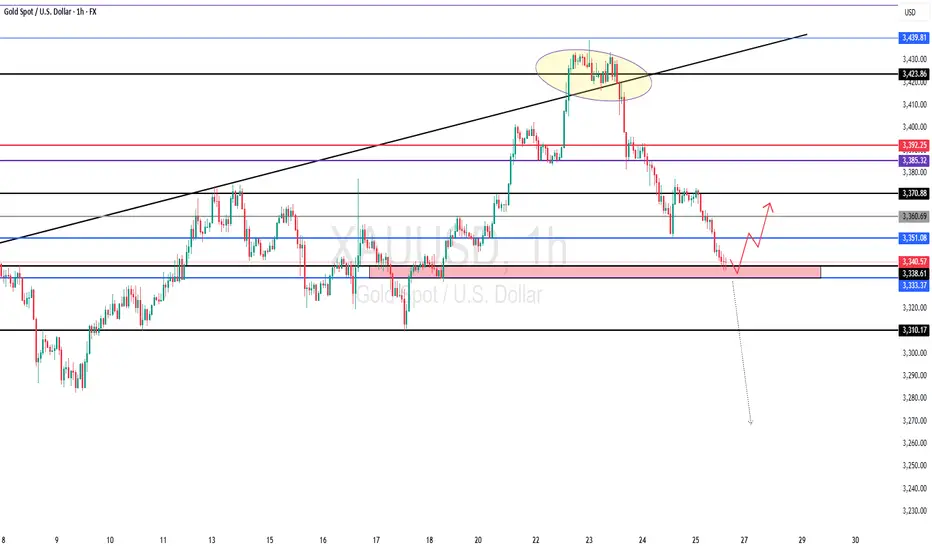
XAUUSD – The Structure Is Still Bullish... But Barely Holding 📌 In yesterday’s analysis, I mentioned that although Gold corrected deeper than expected, dropping below 3400, the bullish structure remained intact — and I stayed true to that view by buying dips.
🎯 The trade didn’t go as planned. Fortunately, the New York rebound from 3350 helped me exit at breakeven.
🧭 So now the big question is:
Is Gold reversing to the downside?
The answer: Not confirmed yet.
The structure is technically still bullish, but the chart is far from pretty.
🧨 What’s going wrong?
❌ Bearish engulfing candle on Wednesday – I chose to ignore it yesterday, but it’s still there.
❌ The breakout above 3375 (ascending triangle resistance) is failing – and could now turn into a false breakout trap.
❌ The ascending trendline from January 2025 is under pressure.
❌ And if today we close near 3350, the weekly chart will show a bearish Pin Bar – not exactly a sign of strength.
📉 My current plan:
- If price rallies back above 3380 → I’m looking to sell into strength, not buy.
- If we break below 3350 → I’ll also look to sell the breakdown.
Right now, for Gold to regain bullish momentum, it needs to reclaim 3400. No compromise.
⚠️ Summary:
Yes, the bigger structure is still bullish.
But momentum is fading, and price action is starting to turn against the bulls.
We need confirmation, not hope.
If 3350 breaks cleanly – things could accelerate to the downside.
Disclosure: I am part of TradeNation's Influencer program and receive a monthly fee for using their TradingView charts in my analyses and educational articles.

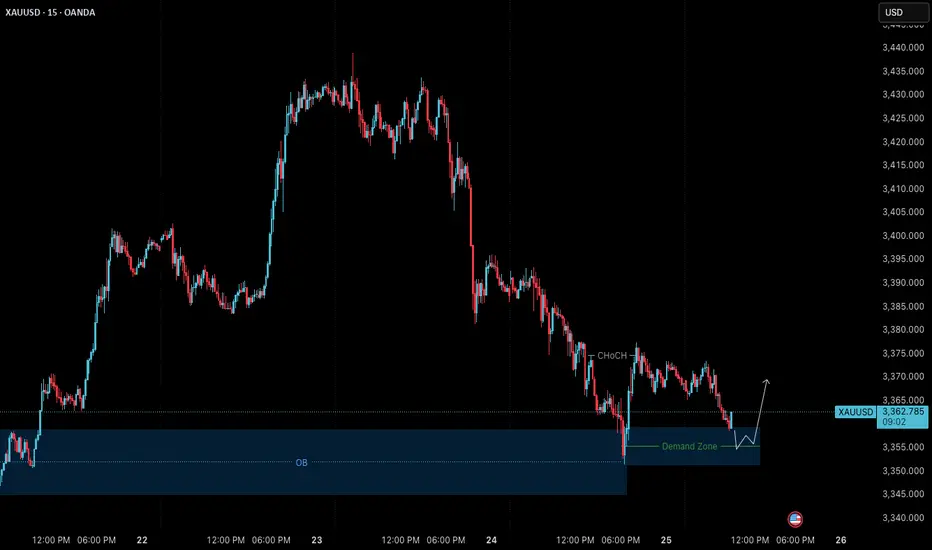
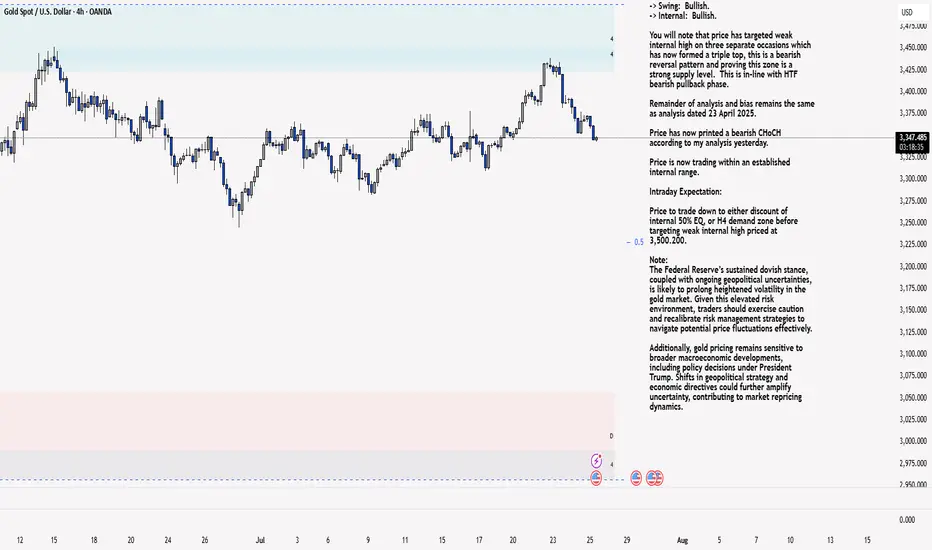
XAU/USD 25 July 2025 Intraday AnalysisH4 Analysis:
-> Swing: Bullish.
-> Internal: Bullish.
You will note that price has targeted weak internal high on three separate occasions which has now formed a triple top, this is a bearish reversal pattern and proving this zone is a strong supply level. This is in-line with HTF bearish pullback phase.
Remainder of analysis and bias remains the same as analysis dated 23 April 2025.
Price has now printed a bearish CHoCH according to my analysis yesterday.
Price is now trading within an established internal range.
Intraday Expectation:
Price to trade down to either discount of internal 50% EQ, or H4 demand zone before targeting weak internal high priced at 3,500.200.
Note:
The Federal Reserve’s sustained dovish stance, coupled with ongoing geopolitical uncertainties, is likely to prolong heightened volatility in the gold market. Given this elevated risk environment, traders should exercise caution and recalibrate risk management strategies to navigate potential price fluctuations effectively.
Additionally, gold pricing remains sensitive to broader macroeconomic developments, including policy decisions under President Trump. Shifts in geopolitical strategy and economic directives could further amplify uncertainty, contributing to market repricing dynamics.
H4 Chart:
M15 Analysis:
-> Swing: Bullish.
-> Internal: Bullish.
H4 Timeframe - Price has failed to target weak internal high, therefore, it would not be unrealistic if price printed a bearish iBOS.
The remainder of my analysis shall remain the same as analysis dated 13 June 2025, apart from target price.
As per my analysis dated 22 May 2025 whereby I mentioned price can be seen to be reacting at discount of 50% EQ on H4 timeframe, therefore, it is a viable alternative that price could potentially print a bullish iBOS on M15 timeframe despite internal structure being bearish.
Price has printed a bullish iBOS followed by a bearish CHoCH, which indicates, but does not confirm, bearish pullback phase initiation. I will however continue to monitor, with respect to depth of pullback.
Intraday Expectation:
Price to continue bearish, react at either M15 supply zone, or discount of 50% internal EQ before targeting weak internal high priced at 3,451.375.
Note:
Gold remains highly volatile amid the Federal Reserve's continued dovish stance, persistent and escalating geopolitical uncertainties. Traders should implement robust risk management strategies and remain vigilant, as price swings may become more pronounced in this elevated volatility environment.
Additionally, President Trump’s recent tariff announcements are expected to further amplify market turbulence, potentially triggering sharp price fluctuations and whipsaws.
M15 Chart:
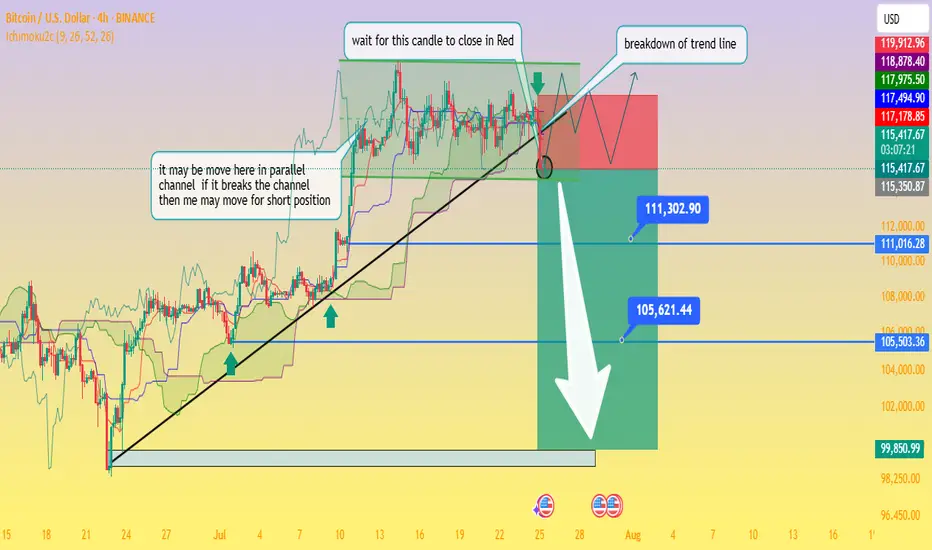
Critical Breakdown: BTC/USD Poised to Fall — Waiting on H4 CloseAnalysis of the BTC/USD 4‑Hour Chart
From the chart you provided, here's how the technical situation looks:
Ascending trendline support has been tested multiple times and was recently breached this afternoon, signaling a possible shift from the bullish setup to a bearish continuation.
The price is now trapped within a descending triangle formation beneath a well‑defined swing high resistance zone. This reflects indecision in the market, with neither buyers nor sellers in clear control
Business Insider
+15
Fxglory Ltd
+15
Bitcoin News
+15
.
Key levels to monitor:
Support zone: ~$115,500, extending down to ~$111,300 and ~$105,600 as deeper targets if bearish momentum strengthens.
Resistance zone: ~$119,000–120,000 area, forming strong overhead supply
Economies.com
DailyForex
Bitcoin News
.
The chart’s annotations align with a classic breakout strategy—with the caveat: wait for a confirmed close below the trendline before considering short positions (as noted in your “wait for this candle to close in red” comment).
Breakout confirmation would likely pave the way toward your indicated profit zones near ~$111k and ~$105k, with a larger potential down to ~$99.8k if further downside pressure builds.
🔍 What the Broader Market Signals
Technical sentiment from sources covering today’s analysis shows BTC/USD hovering just under $120,000, stuck within the defined range of $115.5k support to $120k resistance
Economies.com
.
While there’s still neutral momentum in indicators like RSI and MACD, the short-term direction leans bearish if the breakdown is confirmed on the H4 timeframe
Fxglory Ltd
.
Analysts emphasize that sustained movement above $116.5k could retarget resistance near $119–120k. A failure there and a move below $115.5k may thrust price deeper toward your downside zones
DailyForex
.
✅ Trading Strategy Overview
Scenario Trigger Target Levels
Bearish Breakdown H4 candle closes below trendline ~$115.5k $111.3k → $105.6k → possible $99.8k zone
Bullish Rejection Bounce back above ~$116.5k and trending above resistance $119k–120k retest, potential breakout if sustained
Neutral / Wait-and-see No decisive candle close yet Hold for confirmation
⛳ Final Thoughts
chart highlights a critical point: don’t act prematurely. Wait for a decisive H4 candle close below the trendline before committing to shorts. Confirmed bearish action around the breakout could open the path to the lower targets you identified. However, if price rebounds above support and climbs above $116.5k, a short-term retest of $119k–120k is still in range.
Traders should maintain prudent risk management—watching the unfolding price action around these pivot points without overreaching. Let me know if you'd like help crafting entry/exit zones or risk profiles for this setup!
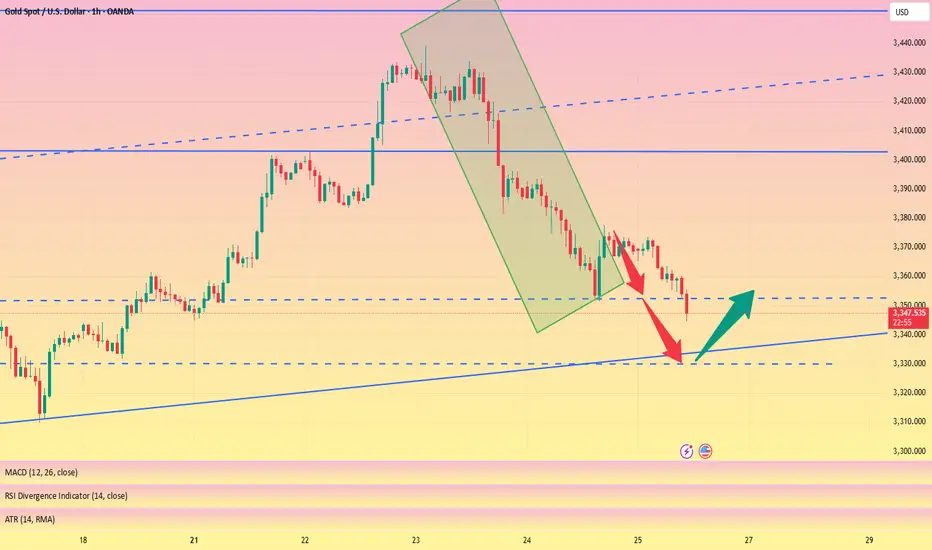
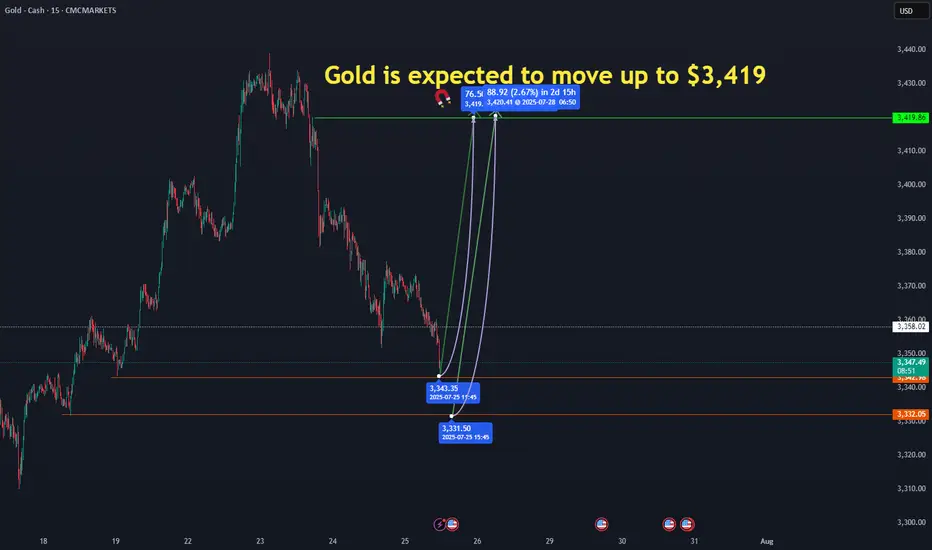
GOLD move up to 3419$Gold has the potential to start an upward move from the 3,343 and 3,331 levels. Reaching 3,419.86 is certain." CMCMARKETS:GOLD
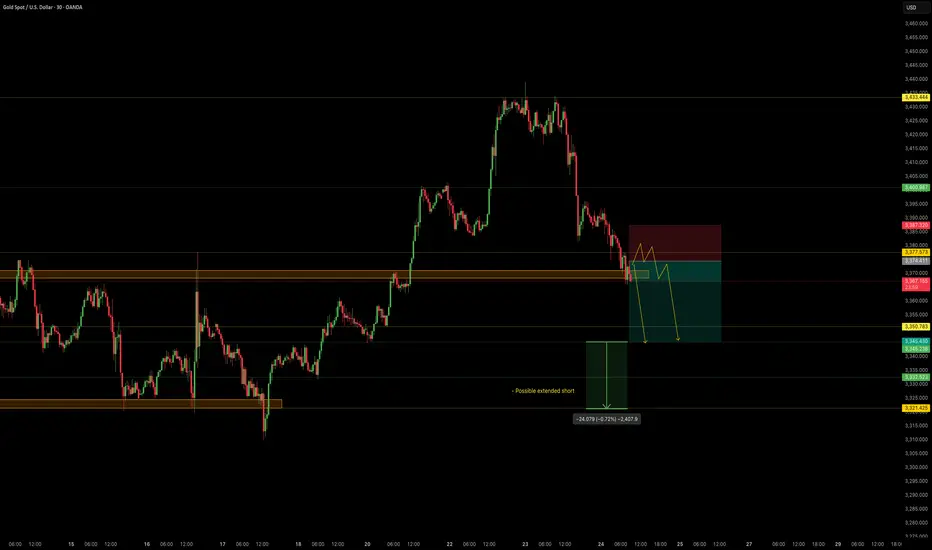
NordKern - XAUUSD InsightNordKern | Simplified Insight OANDA:XAUUSD – Short Opportunity Ahead
Gold is now near our important level at 3370, offering a shorting opportunity considering recent events and technical action.
Gold Price Decline – What's Behind It?
In the last two sessions (July 23–24), gold has retreated strongly owing to a set of global as well as market-specific circumstances:
1. Trade Deal Optimism
Advances in U.S.–Japan and U.S.–EU trade discussions lessened worldwide uncertainty, decreasing demand for gold as a safe-haven.
2. Higher U.S. Yields
Higher Treasury yields are rendering non-yielding assets such as gold less appealing, adding to downward pressure.
3. Technical & Profit-Taking
Following a recent rally, gold was exposed to selling. Stop-loss and profit-taking triggers hastened the fall.
Summary of Key Drivers
U.S. Trade Deals: Reduced geopolitical risk
Higher Treasury Yields: Decreased gold's relative attractiveness
Technical Selling: Enhanced the downward trend
Trade Setup – Bearish Bias
Entry : 3374.4
Stop Loss : 3387.3
Take Profit : 3345.4
Extended Target : 3322
Key Notes:
- Trade Deal Optimism: U.S.–Japan and U.S.–EU agreements eased global tensions, reducing demand for gold as a safe-haven asset.
- Yield Pressure: Rising U.S. Treasury yields made gold less attractive compared to interest-bearing alternatives.
- Technical Selling: Profit-taking and stop-loss triggers accelerated the decline after gold’s recent rally.
This setup remains tactically driven. Manage risk carefully and monitor for any renewed political shifts.
XAUUSD REACHED THE LOCAL TRENDLINEXAUUSD REACHED THE LOCAL TRENDLINE
On July 24 the U.S. Manufacturing PMI report came out way below forecasted (49.5 actual vs 52.6 forecasted). A number below 50 causes concerns among investors and could be a sign of an overall economic slowdown or recession. So, as a result, it could lead to an increase in demand for safe assets like gold.
However, today the price, despite the recent rebound from the trendline after report, came to the trendline once again. There is a high possibility that the price will rebound in nearest future: besides the local trendline we may observe the sma200 on 4-h chart. Additionally, we entered the price zone of 3,350.00-3,375.00, which used to be a resistance zone, now may play out as a support. In case of rebound, the price may go to local highs of 3,440.00 at least.

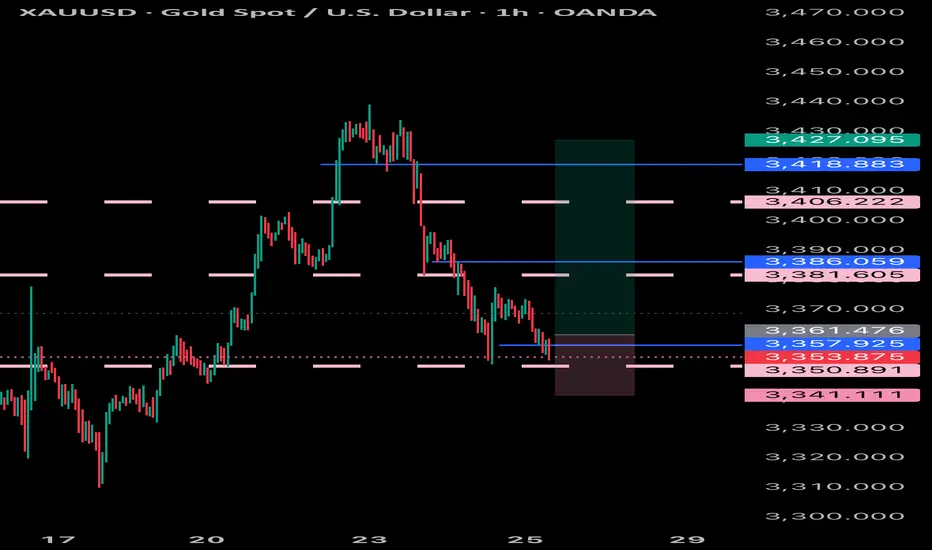
Gold at Key Support – Will Bulls Step In or Drop Continue?🌐 Market Overview
Gold has struggled to recover after yesterday's sharp drop, driven by macro-political concerns and profit-taking at recent highs.
🔻 On July 24, former President Trump made an unexpected visit to the US Federal Reserve, sparking speculation that he's pressuring the Fed to cut interest rates soon.
While the Fed has yet to make any dovish moves, short-term bond yields dipped slightly, showing growing market expectations for policy easing.
The US dollar remains strong, reflecting some skepticism around the Fed’s possible shift despite recent economic strength.
📉 Technical Outlook
On the H2 chart, gold still maintains an overall bullish structure. However, it's approaching a critical support level near 3338, which aligns with the VPOC and the ascending trendline.
📌 If this zone breaks, price may rapidly fall toward deeper liquidity zones in the 332x – 329x range.
🎯 Trade Setups
🔽 BUY SCALP (Quick Reaction Play)
Entry: 3338 – 3336
Stop Loss: 3332
Take Profit: 3342 – 3346 – 3350 – 3354 – 3360 – 3365 – 3370 – 3380
🟢 BUY ZONE (Deep Buy Area – Long-Term Potential)
Entry: 3312 – 3310
Stop Loss: 3305
Take Profit: 3316 – 3320 – 3325 – 3330 – 3340 – 3350 – 3360 – 3370 – 3380
🔻 SELL ZONE (if market retests)
Entry: 3374 – 3376
Stop Loss: 3380
Take Profit: 3370 – 3366 – 3360 – 3355 – 3350 – 3340 – 3330
🔍 Key Levels to Watch
Support: 3350 – 3338 – 3325 – 3310 – 3294
Resistance: 3374 – 3390 – 3400 – 3421
⚠️ Risk Note
As we head into the weekend, liquidity sweeps are common – especially on Fridays. Be cautious of sharp moves.
Focus mainly on scalp setups today. Avoid early long entries unless strong confirmation appears at lower liquidity zones.
Always follow your TP/SL strategy to protect your capital.

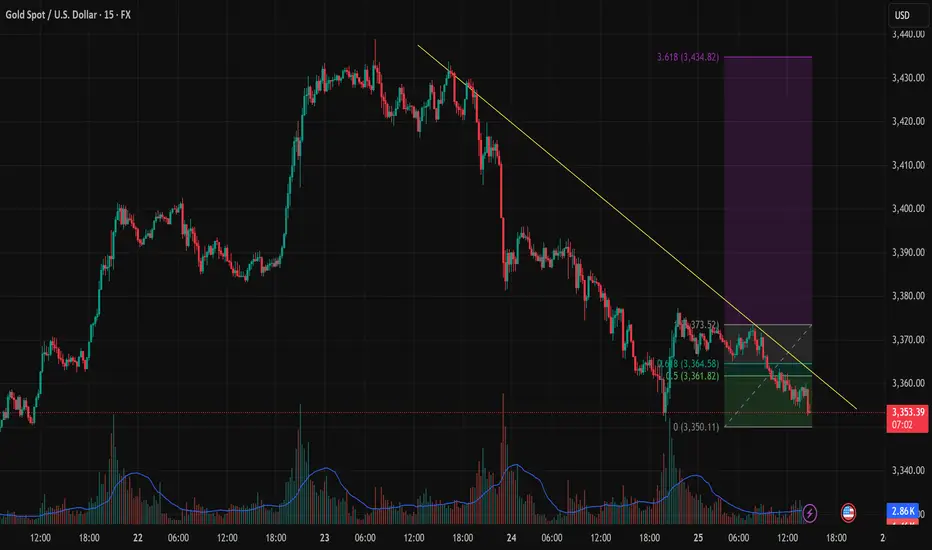
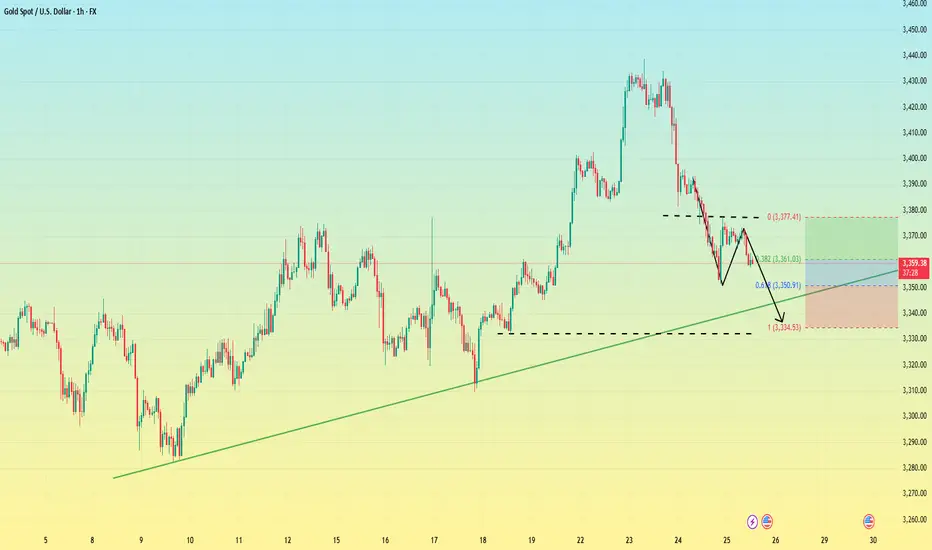
BULLISH REVERSAL SIGNAL FROM 3,350 SUPPORTOn the 15-minute chart (M15), XAUUSD is showing early signs of recovery after a sharp decline that found support around the key 3,350 USD level. This area has been tested multiple times with increasing volume, suggesting potential buyer accumulation.
Technical Analysis: Downtrend Line: A descending trendline (yellow) from the July 23 high has acted as dynamic resistance. Price is now approaching this line again.
Fibonacci Retracement: The recent rebound from 3,350.11 to 3,373.52 shows key resistance zones at the 0.5 (3,361.82) and 0.618 (3,364.58) Fibonacci levels.
Volume Spike: Notable volume surges at the bottom suggest increased buyer interest near support.
Key Price Levels for Today: Technical Zone Role 3,350 – 3,353
Strong short-term support 3,361 – 3,365
Fibonacci 0.5–0.618 resistance 3,373.5
Previous swing high 3,400 – 3,434
Fibonacci 3.618 extension target
Trading Strategies: Scenario 1: Bullish Breakout Above Trendline Entry: Buy stop above 3,366 with increasing volume.
TP1: 3,373.5
TP2: 3,400
TP3: 3,434 (Fibonacci 3.618 extension)
SL: 3,348 (below recent low)
Scenario 2: Trendline Rejection – Bearish Continuation Entry: Sell limit at 3,364–3,366 if bearish pin bar / engulfing pattern appears
TP1: 3,350
TP2: 3,338
SL: 3,375
Additional Confirmation Signals: Closely watch price action near the trendline and Fibonacci zone (3,361–3,364).
RSI is not yet oversold, so a short-term technical rebound remains possible.
Conclusion: Gold is currently testing a significant support zone around 3,350 USD. If price successfully breaks above the descending trendline and holds, we may see a bullish impulse targeting as high as 3,434 USD. However, failure at this resistance may trigger another leg down.
GOLD XAUUSD BUY We shall be looking to scalp a bit on the gold as it has been selling for a while now and can expect a reversal as nothing sells forever in the market, so can buy a dip and expect it to push a fair amount
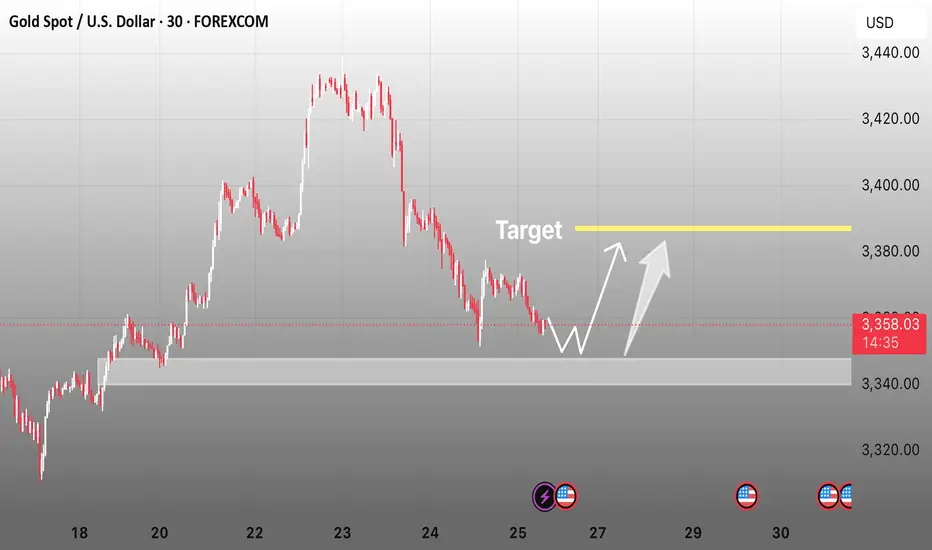
Gold in Demand Zone | Target $3,380🚨 GOLD/USD – BIG MOVE LOADING! 🚨
🔍 Price is currently reacting from a major demand zone ($3,340–$3,345) with signs of accumulation and a possible double bottom pattern forming.
📉 After a strong downtrend, this looks like a liquidity sweep and smart money trap — prepping for a reversal back to the $3,380 resistance zone where liquidity resides.
📈 Scenarios to Watch:
1️⃣ Price sweeps support again and reverses hard
2️⃣ Clean structure break above $3,365, followed by a retest
🎯 Target: $3,380–$3,385
🛡️ Invalidation: Strong close below $3,335
⚠️ Confirmation Required! Best entry would be after structural break + retest. Keep your risk tight, and let the market show its hand.
⸻
📌 Key Levels:
• Support Zone: $3,340–$3,345
• Target Zone: $3,380–$3,385
• Invalidation: Below $3,335
⸻
📣 If this setup helps you, like 👍, comment 💬, and follow 🔔 for more high-probability ideas every week!
#Gold #XAUUSD #SmartMoney #LiquidityGrab #ForexSetup #PriceAction #BreakoutTrade #DoubleBottom #TradingView #GoldAnalysis #ForYou #FXStrategy #SupplyAndDemand
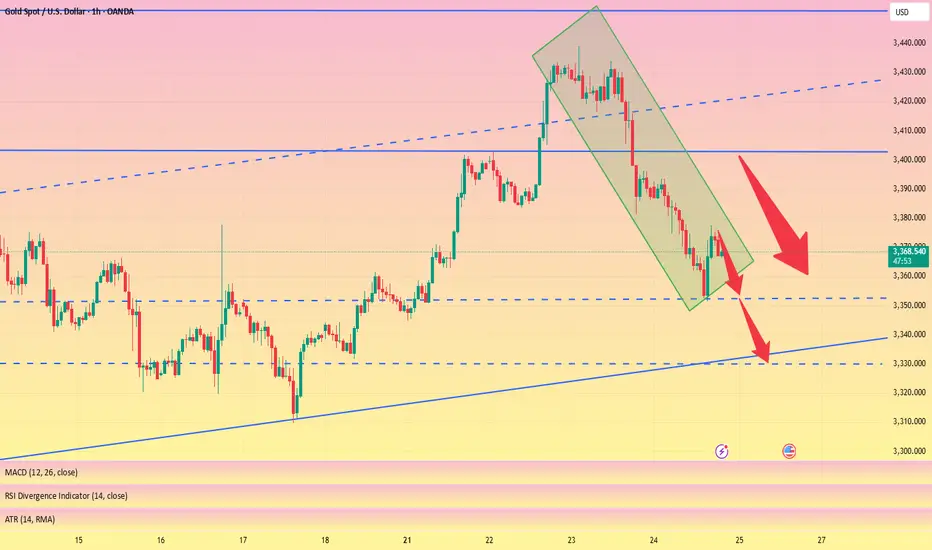
Trend corrected, long funds reduced, sellers returned#XAUUSD
The current moving average is still spreading downward, and the 4-hour chart closed with a large negative line. The market has not yet given a clear feedback on the current trend. However, after a large amount of buying funds intervened, the gold price hit a high of around 3377 and then stagnated. The short-term bullish momentum has weakened, and there is a certain risk of a correction and decline. Sellers are beginning to return📉.
Currently, you can consider participating in short selling at 3370-3377💡. If it rebounds directly to 3400-3405, you can still short if it does not break🔍. The target is 3360 below, and 3350 or even 3330 if it breaks🎯.
🚀 SELL 3370-3377
🚀 TP 3360-3350
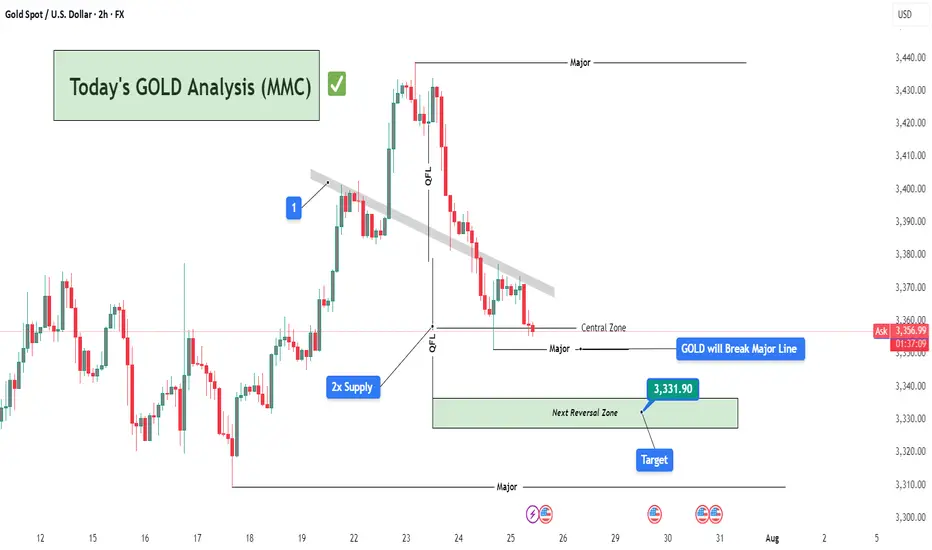
Today's GOLD Analysis (MMC) – Sell Bias Continues To Next TargetChart Overview:
This 2-hour GOLD (XAU/USD) chart showcases a clear bearish structure in line with the Mirror Market Concepts (MMC) methodology. Price action is respecting key supply zones and continues to reject significant levels, confirming the dominance of sellers in the short-term structure.
🔍 Key Technical Elements:
1️⃣ Break of Trendline (MMC QFL Entry Model)
The descending grey trendline marks consistent lower highs, showing clear bearish pressure. The breakout and rejections around this trendline zone (annotated “1”) confirm it as a strong supply area. This breakdown set the stage for a QFL (Quick Flip Liquidity) drop.
🧊 2x Supply Zone (High Confidence Rejection)
The 2x supply label highlights an area where price rapidly reversed with aggressive bearish momentum. This zone was tested and respected again, leading to further downside pressure, reinforcing the idea of institutional selling interest from that level.
📉 QFL Levels & Central Zone
Two major QFL drops are evident, where price broke previous demand structures and created new supply imbalance. The Central Zone currently acts as short-term support, but price is hovering just above it with weak bullish reaction, indicating potential for further breakdown.
🎯 Target & Reversal Zone – 3,331.90
The green zone below marks the Next Reversal Zone, with a highlighted price target at 3,331.90. This is where:
Previous liquidity was absorbed.
Demand imbalance may attract buyers again.
MMC reversal structures might be anticipated.
This zone aligns perfectly with the broader MMC concept of flipping between major zones and reversal blocks.
🧠 Trade Idea & Strategy (MMC Traders’ Minds)
Current Bias: Bearish
Entry Trigger: After rejection from trendline & 2x supply area.
Stop-Loss Suggestion: Above the trendline or recent supply wick (~3,375-3,380).
Take-Profit Zone: Primary TP at 3,331.90, with eyes on lower reversal targets if momentum persists.
Market Behavior: Controlled by sellers, liquidity sweeps seen, weak demand below Central Zone.
📌 Key Events to Watch
As marked at the bottom, major US news events are scheduled between July 30th and 31st, which could act as catalysts for price acceleration toward the reversal zone or cause sharp volatility. Plan accordingly.
🧭 Conclusion:
Gold is respecting bearish market structure under the MMC model. With clear QFL breakouts, rejection from 2x Supply, and weak bullish attempts near the Central Zone, this chart favors short setups targeting the 3,331.90 zone. MMC traders should monitor price action closely within the Reversal Zone for potential buy signals or trend continuation if sellers remain aggressive.
Gold is weak. Beware of lows.On Thursday, the dollar index ended a four-day losing streak thanks to the progress of the fund between the United States and its trading partners.
As signs of easing global trade tensions curbed demand for safe-haven assets, gold fell for the second consecutive trading day, and yesterday it hit the 3350 bottom support level.
From the 4-hour chart
although it rebounded to the 3370-3380 range after hitting 3350. But it can be found that the current rebound is actually weak, and it is still maintained at 3360-70 for rectification. At present, the bottom of the 4-hour bottom is absolutely supported at 3340-3335. The rebound high is around 3375. As of now, gold has not rebounded above 3375, and gold is actually in a weak position.
Secondly, from the hourly chart, the weakness is even more obvious. The high point on Thursday was around 3395. Today's current high point is around 3375. It can be seen that if the bottom falls below the 618 position 3350 again, it will directly touch around 3335. It coincides with the target position of 3340-3335 in the previous 4-hour chart.
Therefore, it is not possible to buy the bottom and go long today. Be alert to the possibility of further touching 3340-3335.
Gold (XAU/USD) 4-Hour Technical Analysis Report - 25 July 2025 📌 Market Context & Sentiment Overview
The gold market is currently trading in a state of technical compression, with the price hovering just beneath the mid-3360s. After a significant rally earlier in the month, the recent sessions have seen price action coiling within a tight ascending triangle—a classic pattern known to precede breakouts.
According to recent publications by FXEmpire, FXStreet, and Investing.com, sentiment remains moderately bullish. Analysts point to strong institutional demand near the 3320–3330 zone, while also warning of resistance pressures near the 3380–3390 zone. These insights align with our technical findings, which suggest a developing structure with increasing breakout potential.
📊 Technical Structure Analysis (4-Hour Timeframe)
🔹 Price Action & Structural Patterns
The prevailing structure is a rising triangle anchored between support at 3320 and resistance near 3380–3390. Price has been forming higher lows, indicative of underlying buying pressure, while simultaneously facing resistance at increasingly frequent tests of the upper band. The contraction of candlestick bodies and volume confirms the presence of a coiling market—hinting at an imminent directional move.
The presence of upper-wick rejections near 3380 signals seller interest, while long-tailed candles at 3330 underscore buyer defense of the rising trendline. This dynamic equilibrium is the hallmark of a triangle formation nearing completion.
🔹 Support & Resistance Levels
Our analysis identifies the following zones as technically significant:
Key Support (Buy Zones):
3320–3330: This zone hosts a major bullish order block, 8/21 EMAs, and the lower trendline of the rising triangle. It is further supported by the 61.8% Fibonacci retracement drawn from the 3300 low to the 3390 swing high.
3300–3310: A psychological level and previous 4-hour swing low. Acts as a secondary defense level.
Key Resistance (Sell Zones):
3380–3390: Triangle resistance, aligned with the 50 EMA and a bearish order block.
3440–3450: An upper extension zone if breakout materializes, noted in external institutional outlooks.
🔹 Volume, VWAP & Institutional Concepts
Volume has notably contracted, a classical feature of triangle formations, with most trading volume aggregating at the mid-point (~3345–3355). VWAP sits just below the current price, reflecting mean reversion tendencies. Furthermore, liquidity pockets are observed just beneath 3320, suggesting potential for liquidity grabs before a bullish reversal.
From a Smart Money lens:
A bullish order block has formed near 3320–3330.
A bearish OB and resistance cap prices around 3380.
A small Fair Value Gap (FVG) lies around 3340–3350, acting as a potential price magnet.
🔹 Indicators & Oscillators
Moving Averages: The 8/21 EMA cluster lies just below current price, offering dynamic support.
MACD: Negative but converging—suggesting bearish momentum may be waning.
ADX: Reading ~40, indicating a trending market, though momentum has slightly slowed.
RSI: Hovering near 35–40, close to oversold; signals potential bounce.
Stochastics & CCI: Both deeply negative—supporting the case for a mean-reverting move.
🎯 Strategic Buying & Selling Zones
✅ High-Probability Buy Zones
3320–3330:
Rationale: Confluence of bullish OB, rising trendline, EMAs, and Fib 61.8%.
Confidence: High (★ ★ ★)
3300–3310 (buffer zone):
Rationale: Psychological and historical swing low support.
Confidence: Moderate
❌ High-Probability Sell Zones
3380–3390:
Rationale: Triangle resistance, prior highs, and bearish OB presence.
Confidence: High
3440–3450:
Rationale: Post-breakout measured move target and potential take-profit zone.
Confidence: Moderate
🏆 The Golden Setup: High-Conviction Trade Idea
Direction: Long
Entry: 3325
Stop Loss: 3300
Take Profit: 3390
Confidence Level: ★ ★ ★ (High)
🔍 Justification
This setup takes advantage of the strongest structural support within the triangle—centered around 3325. This level is reinforced by the 61.8% Fibonacci retracement, bullish order block activity, and EMA compression, all coalescing with the triangle’s rising support line.
Indicators are turning from oversold, and the volume profile suggests that institutional players may look to engineer a liquidity sweep under 3330 before a continuation push to test the 3380 resistance. The reward-to-risk ratio is favorable, and the setup offers clear invalidation with a tight stop at 3300.
Should momentum continue post-breakout, a secondary TP could be explored at 3440. However, for the purpose of tactical execution, 3390 is a strategically sound exit point.
🧠 Sentiment Cross-Check & Market Alignment
External sentiment and professional forecasts support the underlying thesis of a bullish breakout, pending confirmation. TradingView’s top technical authors emphasize the breakout of this ascending triangle toward 3440+, while Investing.com’s shorter-term signals reflect bearish pressure that aligns with our buy-the-dip strategy.
This synthesis of internal and external analysis increases our conviction in a long-biased tactical approach from the current support zone.
✅ Summary Table
Buy Zones Sell Zones Golden Setup
3320–3330 (primary) 3380–3390 (primary) Direction: Long
3300–3310 (buffer) 3440–3450 (extension) Entry: 3325
Stop Loss: 3300
Take Profit: 3390
Confidence Level: ★ ★ ★ (High)
🔚 Final Thoughts
Gold’s current price structure presents a rare opportunity—one defined by tight consolidation, structural clarity, and institutional footprints. As the market coils within a classic triangle, the 3320–3330 zone emerges as a high-probability springboard for long positions. With precise risk management and a disciplined approach, this setup offers traders a compelling entry with defined technical boundaries.
The golden rule now: Respect structure. React to confluence. Trade with conviction.

Gold – 25 July: Watching M15 Demand for Bullish Reversal📍 Gold – 25 July Outlook
Early Signs of Reversal from H4 OB Zone – Wait for Clear Continuation
🔍 Market Recap & Context:
Yesterday, the H4 Order Block zone (3359–3345) was retested and showed signs of holding. A visible M15 structure shift (ChoCH) suggests the market may be preparing to resume the uptrend.
However, the M15 Break of Structure (BoS) has not yet occurred — so this is not a confirmed reversal .
📍 Current Zone to Watch:
M15 Demand Zone: 3359.5 – 3351.5
Price is retracing into this zone. If respected, it could be the base for the next bullish leg.
📌 Trade Setup Possibility:
If price holds the M15 demand zone and M1 gives confirmation (e.g., micro-ChoCH + micro-BoS , a long trade could be considered.
But keep in mind — this would be an aggressive entry , because the M15 BoS is still pending.
This setup would rely on:
• Candlestick behavior
• Volume spikes or reaction
• Price action psychology
✅ Strategy Note:
Wait for signals like:
– Bullish engulfing on M1 or M5
– Micro ChoCH + demand hold
– Volume absorption or imbalance reaction
Only act if the market shows strength — not just a zone tap.
📝 Summary:
• Bias: Early bullish reversal watch
• Zone in Play: 3359.5–3351.5 (M15 demand)
• Confirmation: M1 LTF shift + strong candlesticks
• Caution: No M15 BoS yet — be precise and patient
• Risk Management: 1:3 RR — 40 pip SL / 120 pip TP
Let the chart speak first — observe with stillness, execute with precision.
📘 Shared by @ChartIsMirror