Strong support at 3365/3350In recent years, following the easing of high inflation pressures in the U.S., the Federal Reserve has maintained a high-interest-rate policy, a decision that has significantly impacted gold and U.S. dollar markets: high rates have boosted the U.S. dollar while suppressing gold demand 📉.
This week, gold prices defied market expectations: fueled by geopolitical conflicts, gold surged last Friday and opened higher on Monday, only to trend lower thereafter ⬇️. The hourly chart shows a series of lower lows, with 3,400 emerging as short-term resistance, while gold currently oscillates around 3,380 🔄. With key economic data pending release, gold may still rebound (the initial jobless claims data was advanced to Wednesday) ⏰.
Technically, gold remains in a unilateral uptrend on the daily chart, with strong support at 3,365/3,350 from the 5-day and 10-day moving averages—though not yet in an extremely strong trend 📈. Key resistances lie at 3,430/3,450: a break above 3,450 could pave the way for a challenge to the previous high of 3,500 🏔️!
⚡️⚡️⚡️ XAUUSD ⚡️⚡️⚡️
🚀 Buy@ 3365 - 3375
🚀 TP 3395 - 3405
Accurate signals are updated every day 📈 If you encounter any problems during trading, these signals can serve as your reliable guide 🧭 Feel free to refer to them! I sincerely hope they'll be of great help to you 🌟 👇
Xauusdbuy
XAUUSD:A long trading strategy
Yesterday was affected by the easing signal gold high continued to correction, fell back to 3400 again, the trend exceeded personal expectations. Gold received another boost after the president's news, and rebounded slightly in the Asian session. In this eventful autumn, the market is subject to frequent news factors, the trend is slightly turbulent, to be ready to sweep back and forward.
Today's overall volatility is expected to have a contraction, individual expectations of the final close of the small negative line is more likely
Trading Strategy:
BUY@3380-85
TP:3404-3410
↓↓↓ More detailed strategies and trading will be notified here ↗↗↗
↓↓↓ Keep updated, come to "get" ↗↗↗
Middle East Tensions Intertwined with Fed Rate Cut SpeculationThe Middle East situation remains tense ⚠️, and with rumors of a Fed rate cut emerging 👂, gold is likely to see significant volatility in the near term 📈📉. Due to the war, we still favor going long at lower levels 💹. During the current U.S. trading session, another pullback may occur—we need to wait for the correction before continuing to go long ⏳
⚡️⚡️⚡️ XAUUSD ⚡️⚡️⚡️
🚀 Buy@ 3365 - 3375
🚀 TP 3400 - 3410
Accurate signals are updated every day 📈 If you encounter any problems during trading, these signals can serve as your reliable guide 🧭 Feel free to refer to them! I sincerely hope they'll be of great help to you 🌟 👇

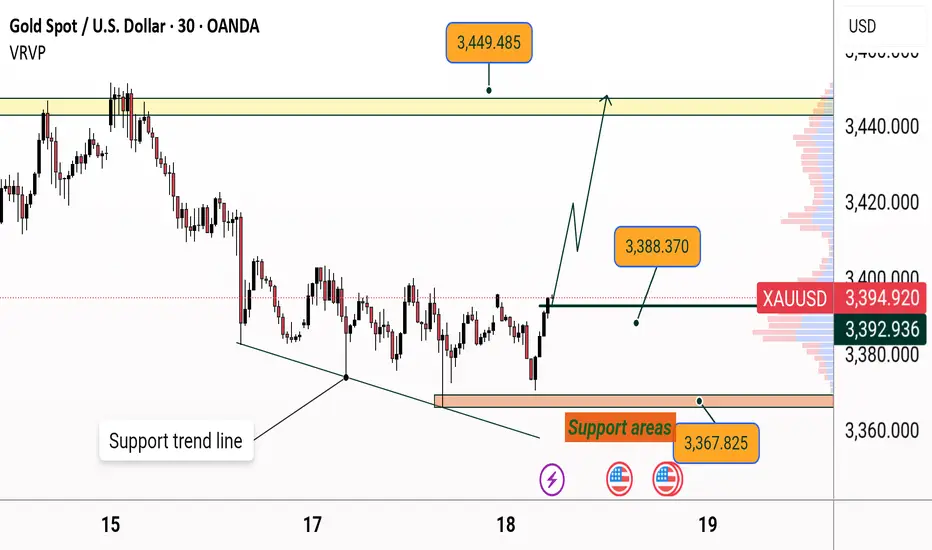
XAU/USD Bullish Reversal Toward 3,449XAU/USD Technical Analysis (30-Minute Chart)
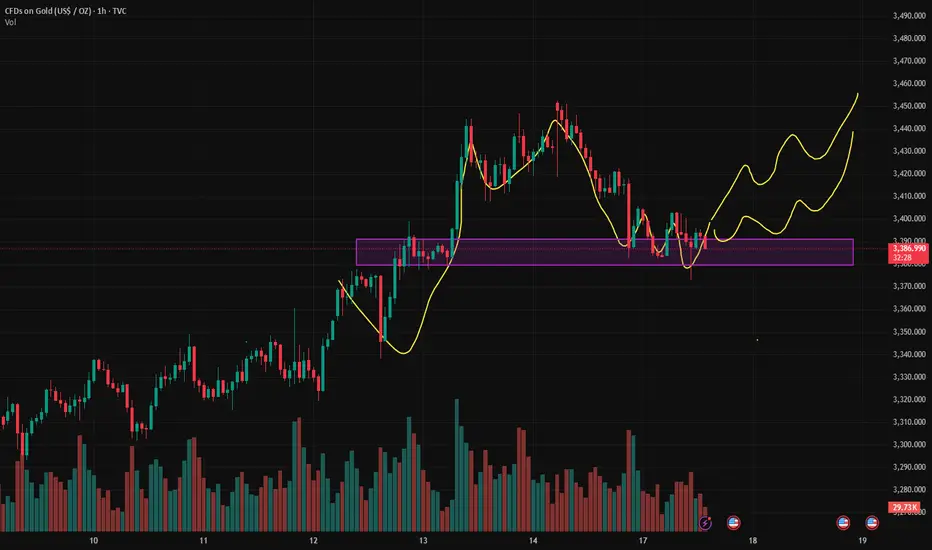
This chart shows a bullish breakout setup for Gold (XAU/USD) based on recent price action and technical indicators:
---
🔻 Support Zone & Trend Line:
A descending support trend line has been drawn from earlier lows, showing a falling wedge structure.
The key support zone between 3,367.825 and 3,388.370 has held firmly, confirming demand in this range.
📈 Bullish Reversal Formation:
Price bounced off the support zone, suggesting a potential reversal.
A breakout above the horizontal resistance near 3,388.370 is projected, with bullish momentum forming.
🎯 Target Levels:
Immediate resistance: Around 3,388.370, which price is currently testing.
Primary target: The yellow resistance zone near 3,449.485—if broken, it may confirm a strong upward trend.
📊 Volume Profile:
Volume bars on the right show higher trading activity above 3,400, indicating potential resistance in that region.
📝 Summary: Gold is showing signs of a bullish reversal from the support trend line and key demand zone. A sustained move above 3,388.370 may lead to a rally toward the 3,449.485 resistance area.
XAUUSD!UP!As I expected, the market remains volatile. It needs an opportunity to continue to rise.
I will update this kind of information in the swing trading center. If you don't want to miss such precise trading opportunities, remember to stay tuned.
Key Event Today – FOMC Interest Rate DecisionAs risk-off sentiment cools, gold bulls failed to take control yesterday, resulting in a stalemate with the bears.
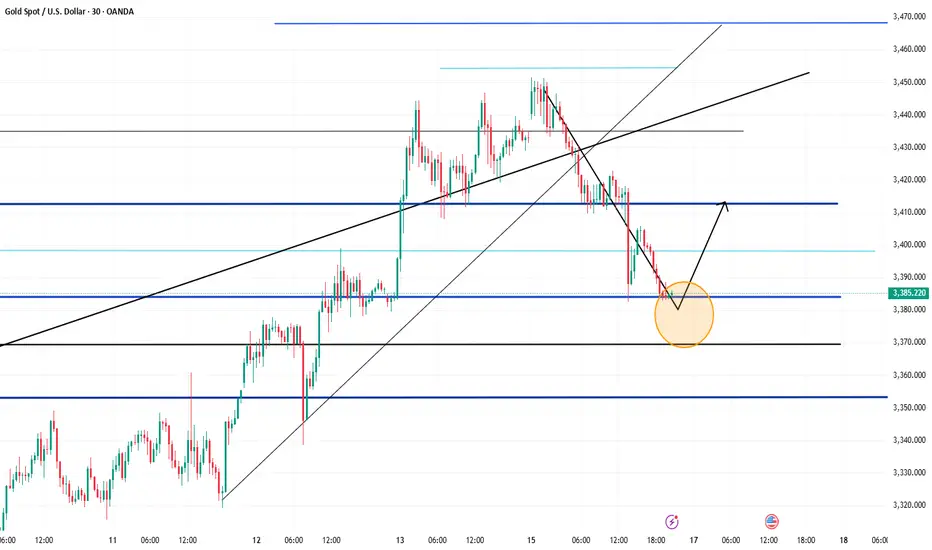
From the 4H chart perspective, bearish momentum currently appears stronger,
though bulls are not giving up easily.
Currently, price is rebounding off the 4H MA60 support,
with immediate resistance from the MA20 around 3405.
As time progresses, this resistance is likely to shift lower,
so for now, we’ll treat $3400 as the primary reference point.
For bulls to regain dominance,
they must hold steady above 3405,
and more importantly, protect the support at 3386–3378 during any pullback.
🔔 Key Event Today – FOMC Interest Rate Decision
Today’s trading will also be influenced by the Federal Reserve’s rate decision,
which, based on current expectations, is likely to weigh heavily on bullish sentiment.
📌 Strategy for Today:
Main Bias: Sell the rebound
Secondary Approach: Buy on pullbacks if strong support levels hold
Key support levels to monitor:
⚠️ 3382 zone (minor support)
🔻 Most critical: 4H MA60 around 3366
Stay cautious during the FOMC announcement window, and remember — in volatile markets, reacting with discipline is more important than predicting perfectly.
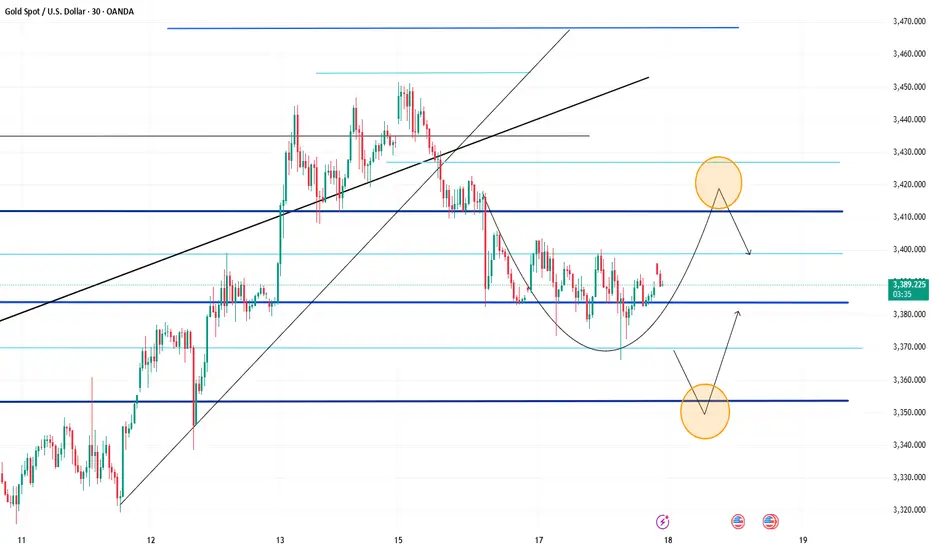
6/17 Gold Analysis and Trading SignalsGood morning!
Yesterday, gold opened with a gap-up and surged to around 3451, but failed to sustain above key resistance. After another failed attempt to break higher, prices gradually turned lower and finally broke below 3400, finding short-term support near 3382.
The primary driver of this decline was a waning of geopolitical risk sentiment, which had previously fueled the rally. Additionally, the market is now pricing in expectations that the Fed will keep rates unchanged, a factor that was likely preemptively reflected in price.
🔍 Fundamental Focus:
Today’s U.S. session will feature a key news release, which may prove decisive for gold’s next directional move. With yesterday’s advance pullback, market dynamics are likely to be more volatile today. We recommend caution, especially ahead of the announcement.
📉 Technical View:
Gold is currently in a post-decline consolidation phase.
The main resistance lies between 3430–3450, while 3415 on the 30-minute chart also presents a short-term cap.
For those entering long positions, target zones should remain conservative, ideally around 3412–3418, and then be adjusted depending on volume momentum and breakout structure.
📊 Weekly Structure Outlook:
The weekly chart shows that gold is at a key trend inflection point.
If no additional bullish catalysts emerge, the market is likely to develop into a bearish consolidation, with the next major downside target around 3200.
📌 Trading Plan (For VIP):
✅ Sell Zone: 3436–3466
✅ Buy Zone: 3347–3323
✅ Flexible Trade Zones: 3428 / 3415 / 3403 / 3392 / 3378 / 3362 / 3354
6/18 Gold Analysis and Trading SignalsGood morning, everyone!
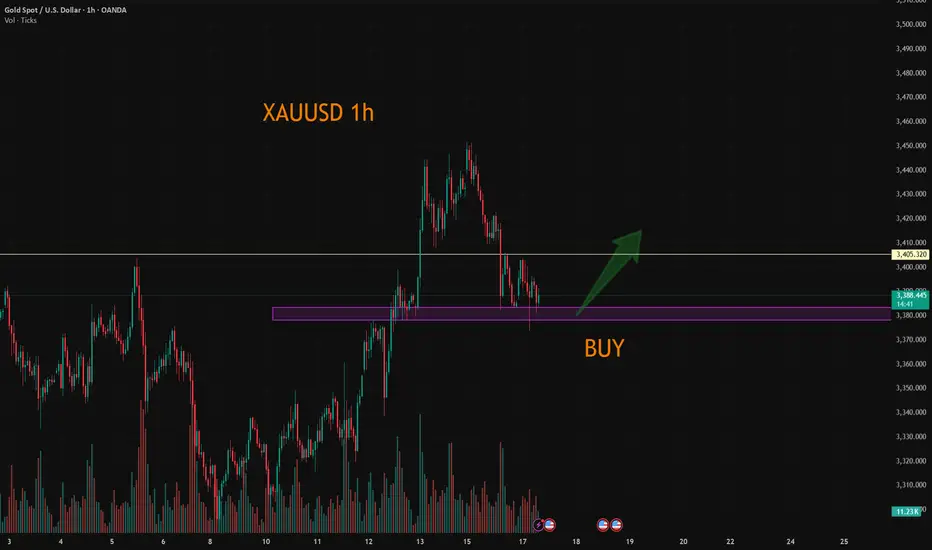
Gold traded within a narrow range yesterday, and the buy signal shared during the session yielded profits. From a technical perspective, the market remains in a rebound phase, with key resistance around 3403. If the price breaks and holds above this level, there’s a good chance we’ll see a move toward the 3418–3428 zone today.
During the Asian and European sessions, the trading bias should remain on the buy side, while in the U.S. session, it may be more favorable to shift toward short setups, mainly due to expectations surrounding the upcoming Fed interest rate decision—an outlook we discussed yesterday.
Key intraday ranges to watch:
Asian–European session: 3362–3413
If price reaches the 3425–3435 zone before the U.S. session, short opportunities may emerge
As always, manage your positions carefully and adapt to key levels as price unfolds.
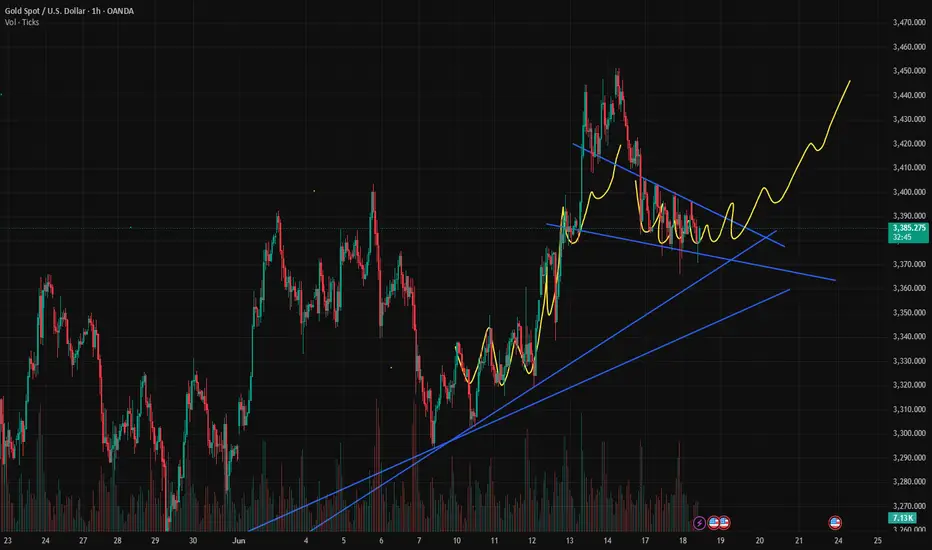
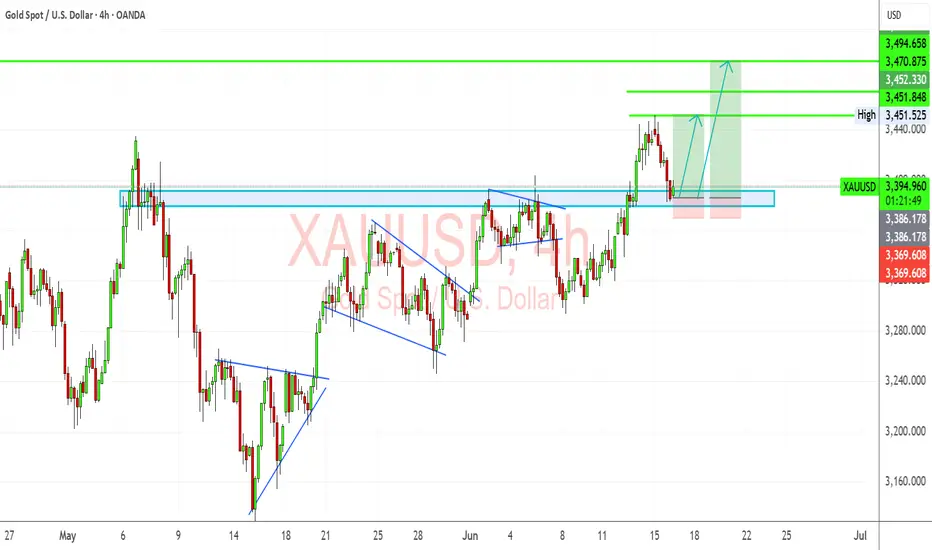
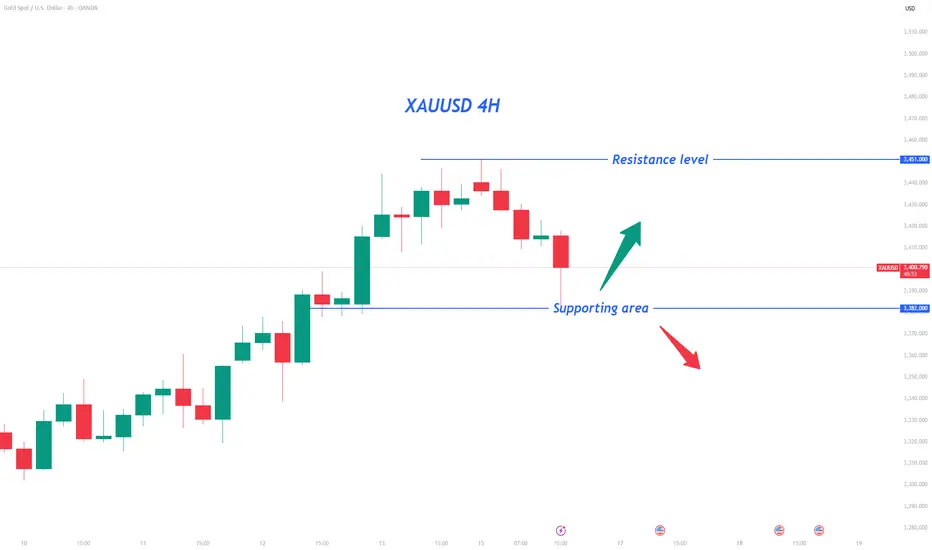
XAUUSD Long Setup – Retest of Broken Structure & Safe-Haven FlowGold has pulled back to retest a strong former resistance (now support) zone around $3,385–$3,390. This level aligns with a previous breakout and marks the neckline of an inverted head-and-shoulders pattern. The pair is now showing bullish structure with back-to-back continuation patterns (bull flags), suggesting further upside potential.
Given escalating geopolitical risk (Iran-Israel strikes, Trump-led evacuation urgency), slowing Fed cut expectations, and softening inflation-adjusted yields, gold remains in demand.
🔍 Technical Analysis:
Structure: Higher highs and higher lows maintained.
Support Zone: $3,385–$3,390 (retest zone) – bulls stepping back in.
Targets:
TP1: $3,451
TP2: $3,470
TP3: $3,495 (new local high)
Stop Loss: Below $3,369 (recent low)
Pattern Context: Bull flags continue to form and break bullish – reinforcing trend.
🧠 Fundamental Context (June 17):
Bullish Drivers:
Middle East escalation → safe haven bid surging (Iran missile launches, Israeli retaliation, US political chaos).
Fed on pause → real yields are subdued, favoring non-yielding assets like gold.
Convexity & bond volatility rising → investors hedging with hard assets (confirmed via CME sentiment reports).
Risks:
Sudden peace deal or ceasefire.
Unexpected US CPI spike → reawakens rate hike fears.
📅 Key Events to Watch:
Fed speeches (confirmation of dovish tone)
Any ceasefire or major diplomatic development
Oil movement (energy risk spillovers)
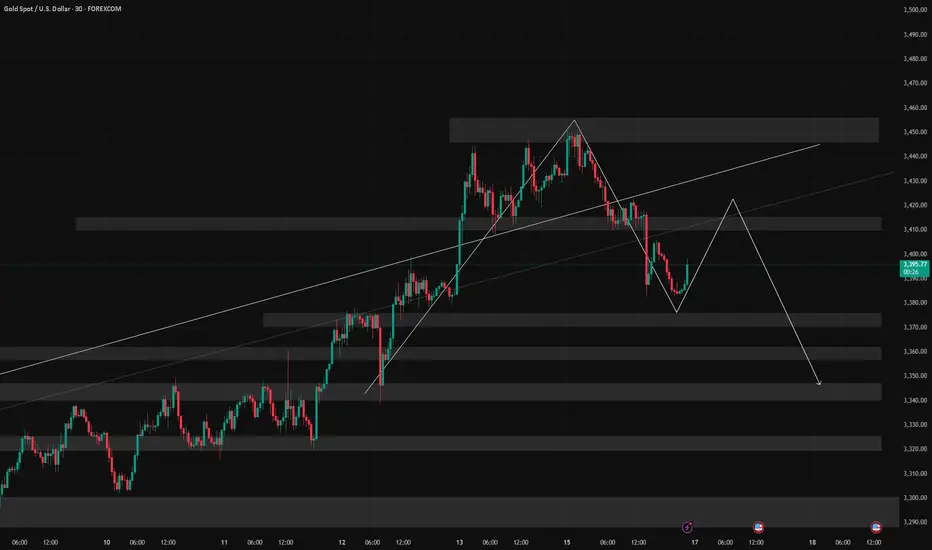
Current Gold Trend Analysis and Trading RecommendationsGold showed a pullback after hitting a high yesterday, with a daily decline of nearly 70 USD. The daily candlestick pattern completely engulfed the previous day's gains and closed bearish. Combined with the current signals of geopolitical tensions, today's market is expected to be dominated by broad-range consolidation. From the 4-hour cycle perspective, the price broke below the middle Bollinger Band with consecutive bearish candles last night and continued to decline after being suppressed in the early morning, with technicals pointing to a consolidative and bearish pattern.
The key pivot level today is at 3,405: if the market effectively stabilizes above this level, the upper resistance will test 3,420 and 3,430 in sequence; conversely, if the suppression at 3,405 holds, the price is likely to repeatedly test the support at 3,380 and further dip to the 3,370-3,360 zone. It is recommended to wait for the decline momentum to clarify before initiating long positions, maintaining an overall range-trading strategy.
XAUUSD
buy@3375-3380
tp:3390-3400-3420
Investment itself is not the source of risk; it is only when investment behavior escapes rational control that risks lie in wait. In the trading process, always bear in mind that restraining impulsiveness is the primary criterion for success. I share trading signals daily, and all signals have been accurate without error for a full month. Regardless of your past profits or losses, with my assistance, you have the hope to achieve a breakthrough in your investment.
3365-3400: The Battle Zone for Bulls and BearsCurrently, gold trades at 3386 📊. Key levels: resistance 3400, support 3365 🛑. Watch real-time news (Fed speeches 🎙️, Middle East geopolitics 🌍), which can shift bull-bear balance 🐂🐻.
Long setup: If price drops to 3365-3370 with bullish news (Fed dovish 🕊️, geopolitical tension 🔥) and bullish K-lines (long lower shadows 🕯️), go long 💰. Stop below 3360 🛑. Target 3390-3400 🎯. Take partial profits if news cools 📦.
Short setup: If price rebounds to 3400-3405 with bearish news (strong US data 📈, geopolitical ease 🧘) and bearish K-lines (long upper shadows 🕯️), go short 💰. Stop above 3410 🛑. Initial target 3380-3375 🎯. Extend to support if bearish news persists 🔍.
Gold Trading Strategies
sell@ 3400-3405
tp:3380-3370
buy@3365-3370
tp:3390-3400
Professional trading strategies are pushed daily 📊
Lock in precise signals amid market fluctuations 🚀
Confused about market trends? Stuck in strategy bottlenecks?
Real-time strategies serve as your "trading compass" 🌐
From trend analysis to entry/exit points, dissect market logic comprehensively
Refer now 📲
Help you move steadily forward in investments ✨
👇👇👇
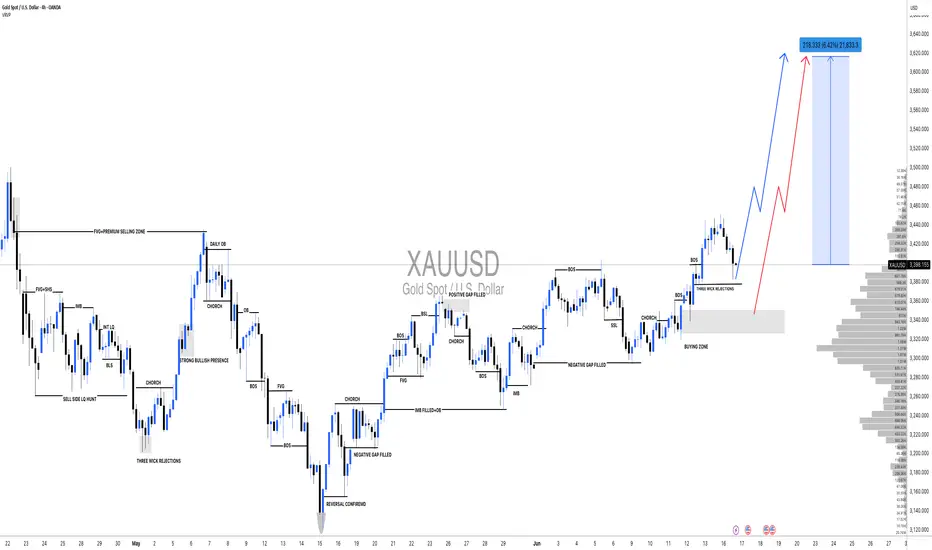
XAUUSD: Accumulation in process,Waiting for Bullish DistributionHello,
Today, we will analyse the key points of each significant move.
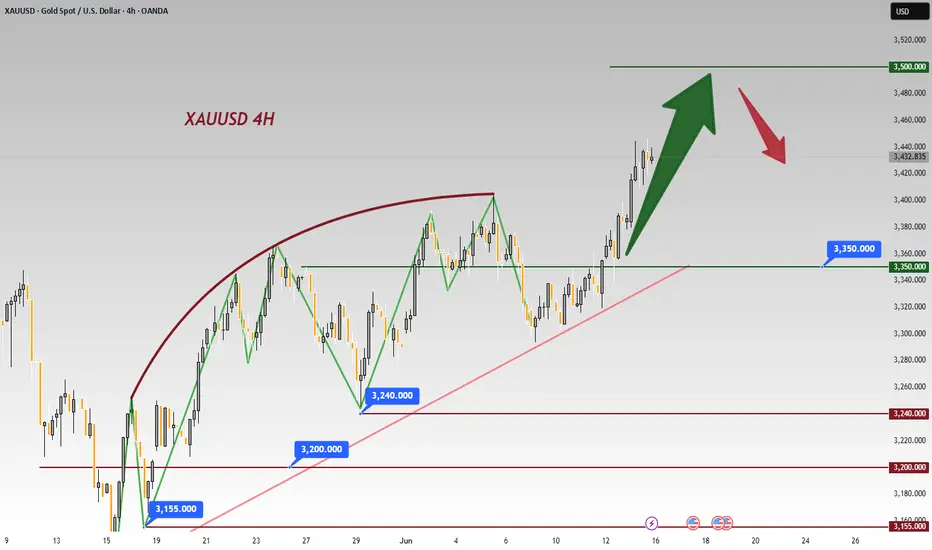
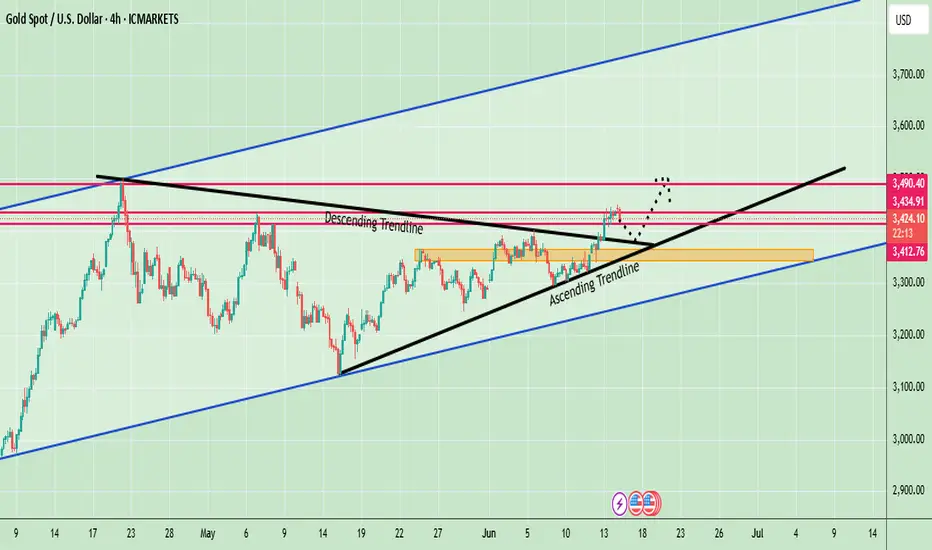
Following the price’s all-time high at $3500, it experienced a sharp decline and failed to maintain that level. A substantial 2400 pips would have resulted in significant losses for many accounts. Initially, it was perceived as a minor correction, with the expectation of further price appreciation. However, this assumption proved incorrect. After reaching an even higher peak, the price invariably undergoes a more substantial correction.
At 3260, substantial bullish volume surged into the market, necessitated by the presence of a fair value gap. Subsequently, the price experienced a decline, reflecting the prevailing bearish trend, which favoured the bears. However, at 3200, a pivotal level representing a discounted price point, bull volume surged. This powerful bullish impulse propelled the price to 3432, ultimately confirming the bullish trend. AB=CD there recurring pattern emerged weekly. When the price reached the 3432 level as a fair value gap, the CD pattern commenced.
AB=CDTheHeyIndeed, we have identified a recurring pattern. It appears to be an equal move in any direction, and it has manifested precisely as anticipated. We were aware that the price would reject at 3120, and it did so accordingly. Currently, the market is in our favour. Upon market opening, it exhibited a positive gap, propelling the price to 3450. However, it subsequently declined, reaching 3384.
Presently, we find ourselves in the accumulation phase, poised for distribution. This distribution is anticipated to be substantial, potentially leading to another record high, potentially reaching 3650.
Moving forward, the price could continue towards our target from its current position. Alternatively, there exists a possibility that it may drain the sell-side liquidity and reverse from 3360-3370.
Our take-profit levels are set at 3450, 3490, 3520, and finally, 3600. When entering the market, it is advisable to employ a short time frame. It is important to note that this analysis is merely our opinion, and market conditions may deviate from expectations.
We extend our best wishes for success and safe trading. If you wish to demonstrate your support, you may consider liking, commenting, or sharing this analysis with others.
Sincerely,
Team Setupsfx_
XAUUSD: The beginning of range trading.Last week, I perfectly predicted the sharp rise in the market. At the beginning of this week, XAUUSD reached a high of 3451, which is the front pressure position. Due to the cooling of risk aversion in the international market, the New York market fell back to 3373 on Monday.
XAUUSD did experience a typical "news-driven callback", and the analysis of technical and fundamental aspects is very critical. The following is a professional analysis and operation suggestions for the current market:
Key points and technical structure
1. Pressure level: 3450 area
- The previous high pressure is effective. This is the resonance resistance area of the upper track of the daily level channel + Fibonacci 61.8% retracement level, and the demand for long profit-taking is concentrated.
2. Support level: 3370-3380 area
- Currently falling back to 3373, here is:
- 50-day moving average dynamic support
- 4-hour chart previous low level support platform
- Fibonacci 38.2% retracement level
- If the daily closing is above 3380, the technical structure is still a healthy correction.
News-driven logic
- Negative factors:
Geopolitical situation and peace talks ➜ Risk aversion cools down ➜ Gold's attractiveness as a safe-haven asset decreases.
- Potential risks:
The progress of peace talks may be repeated (such as the situation between Israel and Hamas and Russia and Ukraine). If the negotiations fail, safe-haven buying will return quickly. Need to keep an eye on news sources.
Key signals for long-short game
Long signal: long lower shadow candlestick appears in 3370 area, US dollar index (DXY) falls below 105.0
Short signal: rebound fails to break through 3400 integer mark, US bond yield rises above 4.3%
Trading strategy suggestion
- *Long order opportunity*: 3370-3380 light position to try long, stop loss 3355 (below the previous low), target 3400/3420.
- *Short order opportunity*: 3415-3425 to arrange short orders in batches, stop loss 3440, target 3390.
2: Break down
- Trigger condition: daily closing price <3365
The callback is upgraded to a deep correction
- Target: 3340→ 3300 (psychological barrier + trend line support)
- Operation: Chasing short needs to wait for a rebound to around 3400, stop loss 3420.
3: Restart the rise (probability 10%)
- Trigger condition: Break through 3440 and stand firm for 1 hour
- Possible driving force: Geopolitical conflict escalates/Fed rate cut expectations rise
- Target: 3480 (historical high psychological resistance) → 3500
- Operation: After breaking through 3440, step back to 3425 to chase longs, stop loss 3405.
Key event risks this week
1. Wednesday: US May CPI data (core CPI expected to be 3.5%)
- If data > expectations: expectations of rate hikes rise → bearish for gold
- If data < expectations: expectations of rate cuts come earlier → bullish for gold
2. Thursday: Fed interest rate decision + Powell press conference
- Pay attention to the dot plot's hints on the number of rate cuts in 2024 (current market pricing is about 2 times)
3. Geopolitical headlines: progress in the Iran nuclear agreement, black swan risks in the French election
Position management principles
1. Total risk exposure ≤ 5% of account net value
2. Reduce positions by 50% 3 hours before key events (avoid instantaneous fluctuations in CPI/FOMC)
3. Breakout strategy stop loss setting: 15 points outside the previous high/low to prevent burrs
Conclusion: The effectiveness of the current 3373 support needs to be verified by Wednesday's CPI data. It is recommended that the London market operate in the 3370-3420 range and reduce positions before the US market to wait for data guidance. If you hold long positions, 3380 is the last line of defense; if you hold short positions, consider taking profits in batches above 3400. The medium-term bullish trend of gold has not been broken, but the risk aversion premium needs to be digested in the short term.
If you need a more detailed entry point analysis or position management to solve your long-term loss problem, please feel free to tell me your trading cycle and risk preference, and I will provide you with a customized strategy.
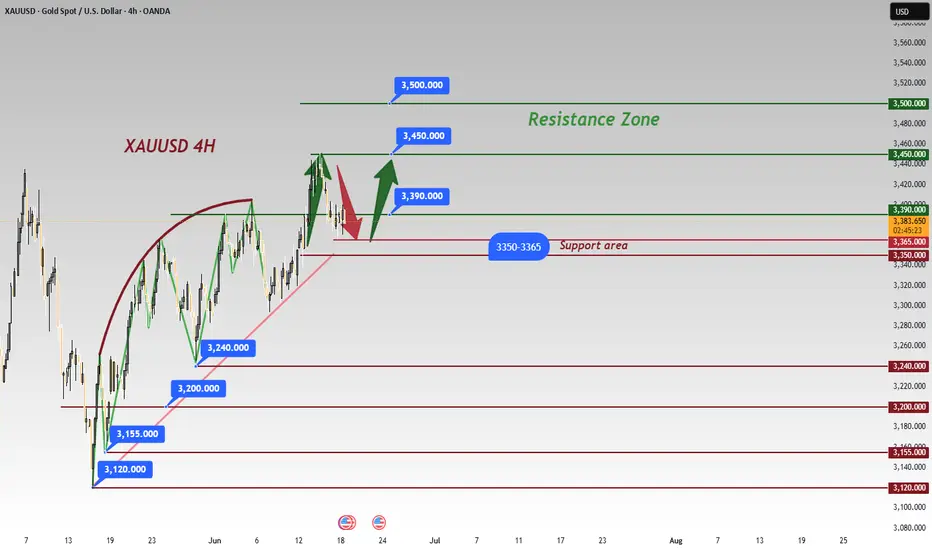
Fed Rate Decision May Trigger a Decline in Gold PricesDespite heightened tensions in the Middle East providing safe-haven support, gold failed to break through the 3450–3455 resistance zone today and instead pulled back to the 3400–3386 support area.
This decline was mainly driven by two factors:
Iran expressed willingness to resume nuclear talks, easing geopolitical tensions and weakening safe-haven demand.
Growing expectations that the Fed will keep rates unchanged this week strengthened the DXY, reducing gold's appeal.
That said, inflation concerns persist, offering medium-term support to gold. On the technical front, the 3378–3340 consolidation zone may serve as secondary support, while stronger trend support lies in the 3310–3289 range—a level that may only be tested under extreme bearish conditions.
For now, the primary support to watch is 3386–3373, with short-term rebound resistance around 3400–3420.
Trading Suggestion:
Ahead of the Fed’s rate decision tomorrow, consider buying on dips, as today’s decline may lead to a technical rebound. Then reassess the market’s response to key support and resistance levels to determine further action.
Gold: Key Levels Amidst Bull-Bear ClashDaily Technical Analysis
Daily Chart
Gold trended sideways-up last week, repeatedly testing upper resistance without a decisive breakout, though bullish momentum remains robust 🚀💪. The Bollinger Bands are expanding upward with price near the upper band, moving averages in bullish alignment, and MACD forming a golden cross above the zero axis with an expanding red histogram—signaling a dominant long-term uptrend 🔥📈!
4-Hour Chart
After reaching an intraday high of 3451, price corrected lower, forming small bearish candles that indicate short-term bearish momentum 📉🔻. However, moving averages still maintain a bullish order, with initial support at the psychological level of 3400. If price stabilizes here, further upside may resume 📈🚀. MACD has formed a bearish cross at high levels with a nascent green histogram, suggesting near-term correction is needed ⚠️🔄!
1-Hour Chart
Price is in a correction channel after retreating from highs, suppressed by short-term moving averages 📉🔽. Note that 3382 acts as a key prior support—if price pulls back to this zone, it may trigger bullish rebounds 💪🔥! RSI hovers around 50, indicating balanced long-short forces with an unclear near-term direction 🤷♂️🔀.
Gold Trading Strategies
sell@ 3430-3450
tp:3410-3400
buy@3400-3403
tp:3420-3430 (3450 if 3430 breaks)🚀
Professional trading strategies are pushed daily 📊
Lock in precise signals amid market fluctuations 🚀
Confused about market trends? Stuck in strategy bottlenecks?
Real-time strategies serve as your "trading compass" 🌐
From trend analysis to entry/exit points, dissect market logic comprehensively
Refer now 📲
Help you move steadily forward in investments ✨
👇👇👇
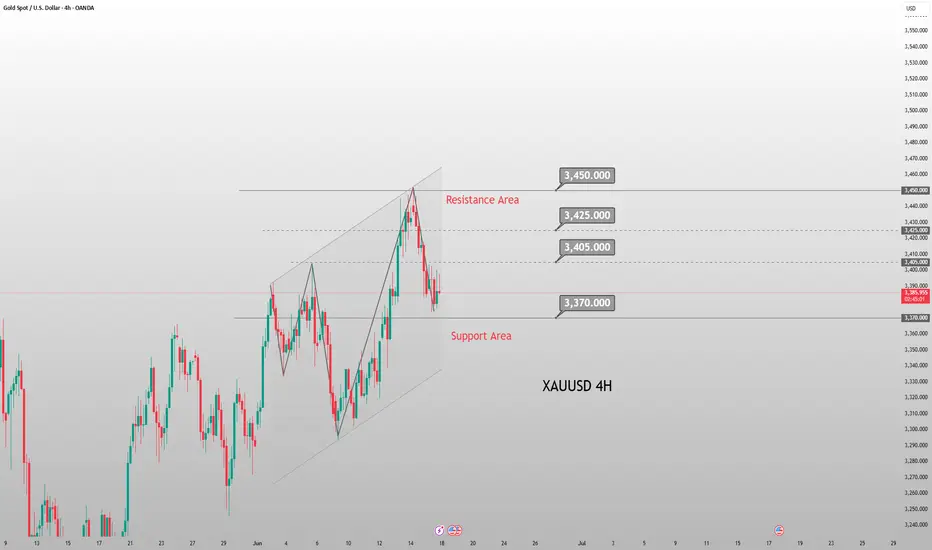
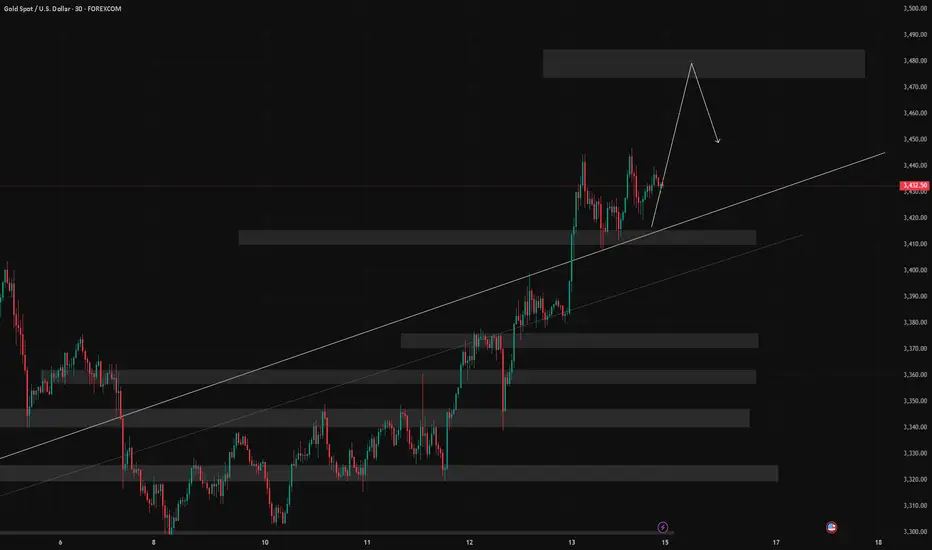
Gold Outlook: Bulls Defend Support Amid Rising Geopolitical RiskGold (XAU/USD) remains within a strong bullish structure on the 4-hour chart, trading inside an ascending channel. Recently, price attempted to break above the key resistance near $3,450 but failed, leading to a minor pullback toward the mid-channel area around $3,428–$3,430, where buyers are currently defending support. The key support remains at $3,394–$3,400, which also coincides with the ascending channel’s lower boundary.
As long as price holds above this level, the bullish trend remains intact, and there is potential for a breakout above the $3,450 resistance zone. If a breakout occurs and price closes above $3,450 on the 4-hour chart, the next bullish targets would be around $3,475 and then $3,500–$3,510. On the downside, if price fails to hold $3,394, it may trigger a short-term bearish correction toward the next support zone around $3,380–$3,370.
Overall, gold is currently in a consolidation phase inside the $3,394–$3,450 range, with a bullish bias above $3,394. A breakout above $3,450 may trigger strong upward momentum, while a break below $3,394 could open the door for a deeper correction.
🔑 Key Levels
Support: ~$3,394–$3,400 (channel floor) and intermediate support at $3,430–$3,440 .
Resistance: Immediate resistance zone is $3,445–$3,450, with broader upside potential toward $3,500+ if that break occurs.
Note
Please risk management in trading is a Key so use your money accordingly. If you like the idea then please like and boost. Thank you and Good Luck!
Iran seeks peace, Israel strikes – Gold dip, buy opportunity🌍 Iran's peace overtures sent gold prices plummeting to 3382, but Israel is unlikely to accept the olive branch lightly. With no clear signs of de-escalation in the Middle East situation, it's advisable to continue going long at lower levels 📉→📈
Israeli PM Benjamin Netanyahu vows military strikes will continue until Iran's nuclear program and ballistic missile capabilities are fully dismantled—showing no signs of halting ⚡. While he claims regime change is not the objective, he notes that given the weakness of Iran's leadership, political upheaval could emerge as a collateral outcome of the operations 🌪️
🌍 Currently, only Iran is seeking peace, but Israel won't simply end the war🌍 Currently, only Iran is seeking peace, but Israel won't simply end the war
⚡️⚡️⚡️ XAUUSD ⚡️⚡️⚡️
🚀 Buy@ 3385 - 3390
🚀 TP 3410 - 3420
Accurate signals are updated every day 📈 If you encounter any problems during trading, these signals can serve as your reliable guide 🧭 Feel free to refer to them! I sincerely hope they'll be of great help to you 🌟 👇
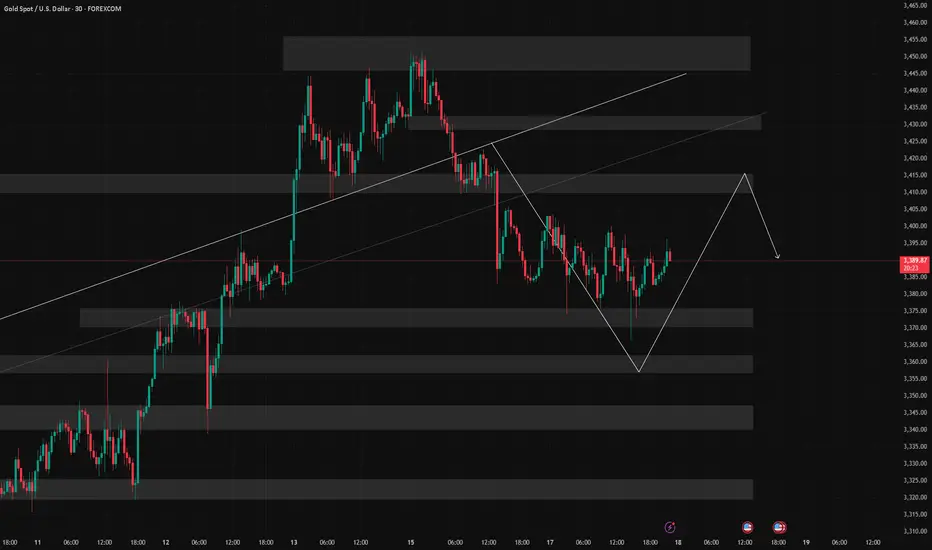
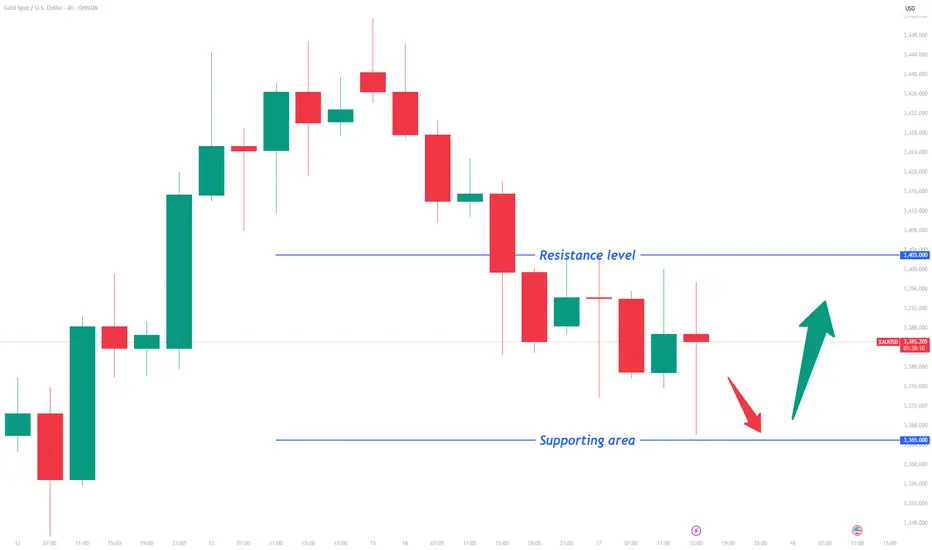
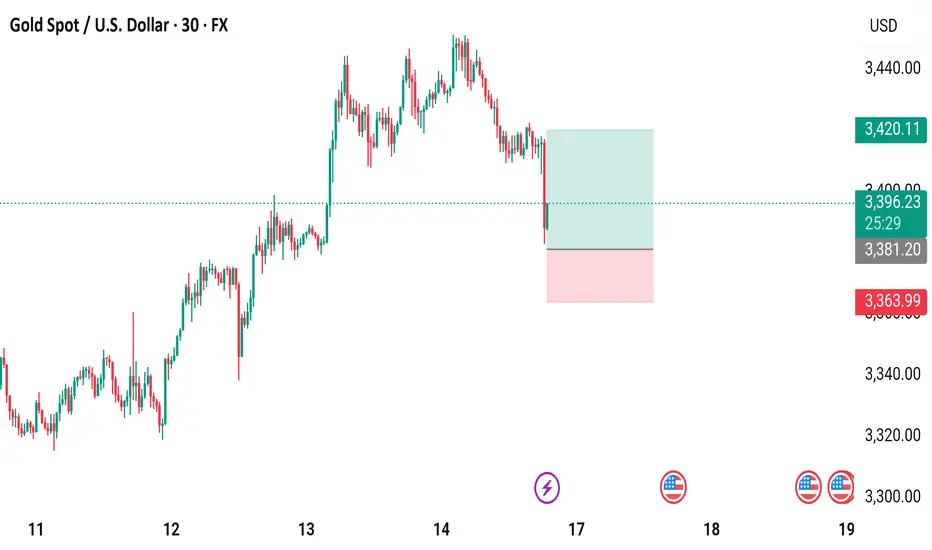
Gold Spot / U.S. Dollar - 30m FX ChartA 30-minute candlestick chart showing the price movement of Gold Spot against the U.S. Dollar, with a current price of $3,390.81, down 1.25% ($43.07). The chart highlights recent price levels ranging from $3,363.99 to $3,440.11.
Safe-Haven Demand Drives Gold Higher – 3500 Within ReachWishing everyone a peaceful weekend—despite turbulent times.
This weekend has been anything but calm. The escalating conflict in the Middle East continues to widen, with rising casualties. As always, war is often a pursuit of power by those at the top, while the real cost is borne by innocent civilians. Though we are mere observers from afar, it’s hard not to feel the weight of the situation.
From a geopolitical perspective, this conflict coincides with U.S.–Iran nuclear negotiations. Could this be a calculated move by certain powers to shift the balance in their favor? While it remains speculative, what’s certain is that the intensifying conflict is already shaking global financial markets.
In such a climate, safe-haven assets are clearly benefiting. Gold’s upward momentum appears firmly established, and oil’s direction hinges on the situation at the Strait of Hormuz. If the strait is closed, a surge in USOIL prices toward $100 would no longer seem unlikely.
Under the influence of such impactful news, traditional technical analysis plays a lesser role. The market direction is largely determined by sentiment, and chart patterns now serve more as entry point references rather than decisive indicators.
My trading outlook for Monday:
If gold opens with a bullish gap and rallies toward the 3480–3500 zone, this area could present a short-term selling opportunity—ideally executed with a quick in-and-out strategy;
If a pullback follows, look to build intraday long positions: aggressive traders may consider entries near 3430, while conservative ones can wait for a potential retest of the 3418 level.
One crucial reminder: News-driven markets are highly uncertain. Eventually, every war comes to an end, and when the demand for safe havens fades, so too will prices. Stay rational in your decisions, and always manage your risk appropriately.
Middle East tensions rise, gold eyes 3500 this week
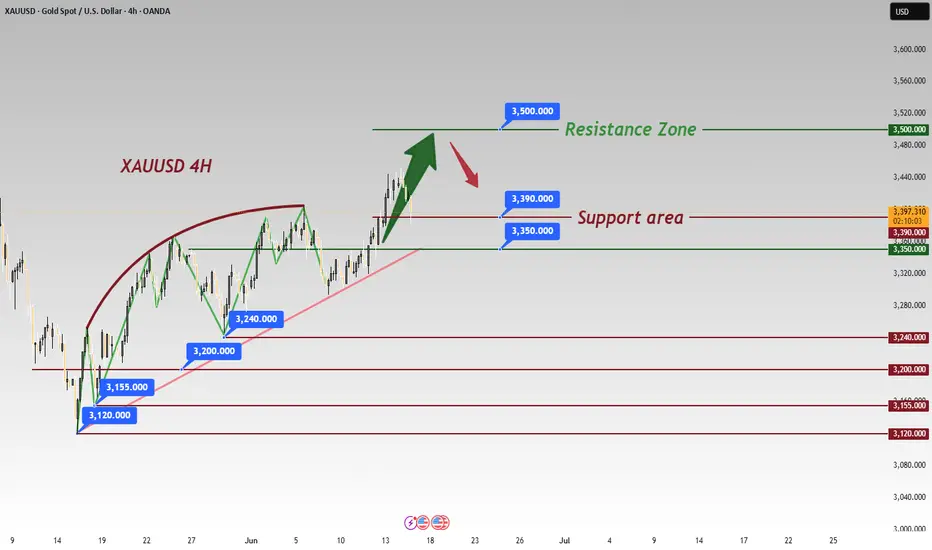
🌍 Over the weekend, tensions in the Middle East escalated sharply, with geopolitical conflicts further intensifying. Multiple forces were drawn into the fray, the scope of conflict expanded continuously, and related military actions triggered widespread international concern, significantly increasing regional uncertainty. This geopolitical instability has had a profound impact on global financial markets, causing a notable decline in investors' risk appetite. Against this backdrop, gold, as a traditional safe-haven asset, has once again become the top choice for investors. The market expects that as the Middle East situation continues to ferment in the coming week, risk-averse sentiment will remain high, and gold is expected to continue benefiting from this trend, with a high likelihood of breaking through the key $3,500 mark 📈.
Additionally, this week's Federal Reserve interest rate decision and Chairman Powell's speech will also be key factors influencing the trend of gold prices. Recent U.S. economic data has been mixed, and fluctuations in inflation figures as well as subtle changes in the job market have left the market full of uncertainty about the Fed's monetary policy direction. If the Fed signals a dovish stance in its interest rate decision, hinting at the possibility of future rate cuts, gold prices will undoubtedly gain further upward momentum. A lower interest rate environment reduces the opportunity cost of holding gold while weakening the appeal of the U.S. dollar, thus prompting more funds to flow into the gold market. Conversely, if the Fed adopts a hawkish stance, emphasizing the maintenance of current interest rates or even hinting at possible future rate hikes, this will exert certain pressure on gold prices ⚖️.
Equally noteworthy is that U.S. President Trump will visit Canada from June 15th to 17th to attend the G7 Leaders' Summit. Trump's words and deeds in international affairs often carry significant influence and uncertainty. At this summit, his speeches and interactions with other world leaders may trigger a reassessment of the global economic and trade situation by the market, thereby causing fluctuations in gold prices 📊. For example, if Trump makes tough statements on trade policies, geopolitics, etc., it may exacerbate market concerns and push gold prices higher; if he conveys more positive signals of cooperation, market risk appetite may recover, and gold prices may face certain correction pressure. Therefore, investors need to closely monitor every move of Trump at the summit to timely grasp investment opportunities and risks in the gold market 👀
⚡️⚡️⚡️ XAUUSD ⚡️⚡️⚡️
🚀 Buy@ 3410 - 3415
🚀 TP 3480 - 3490
Accurate signals are updated every day 📈 If you encounter any problems during trading, these signals can serve as your reliable guide 🧭 Feel free to refer to them! I sincerely hope they'll be of great help to you 🌟 👇
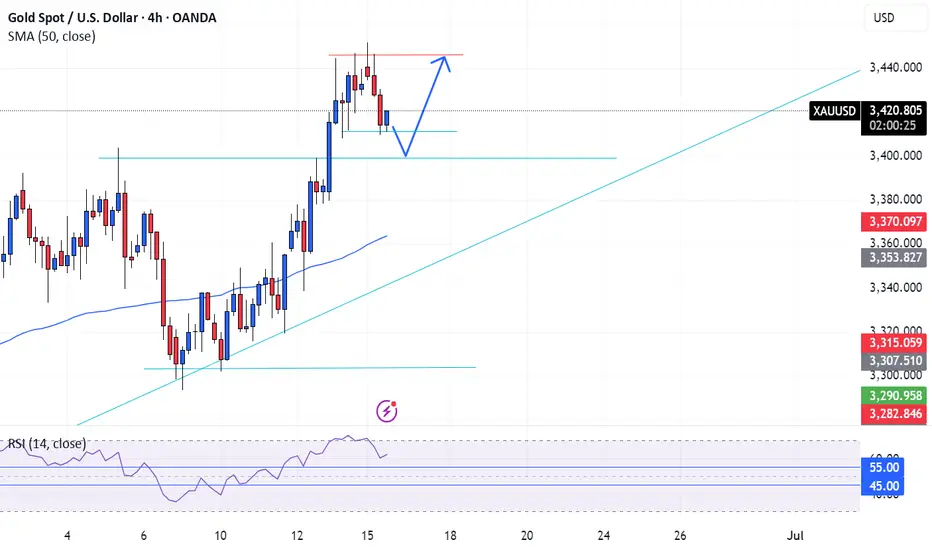
XAUUSD Long Position Gold is currently in a retracement with the potential for a further to the upside from the $3400 break-and-retest level. Last week we saw a massive rally to the upside for Gold after 2 days of indecision, during this rally, Gold broke above the $3400 resistance zone and now has the potential to use this level and platform to bounce further to the upside. On the 4 hour timeframe, Gold is comfortable trading above the 50 SMA and the $3400 potentially lays in the 45-55 zone of the RSI which is the sweet spot region indicating the need of a retracement and continuation of the the primary trend which is bullish. Will be looking to trade from $3400 with Stop loss below structure towards the $3445 resistance level.
Middle East Tensions Soar, Bulls Remain DominantBrief Update on Escalating Israel-Iran Conflict:
On June 14, Israeli forces airstruck Iran's Defense Ministry, nuclear facilities, and oil installations—causing a Tehran residential building to collapse and killing 60 civilians. 💥
Iran fired 50 ballistic missiles into Israel, damaging structures in Tel Aviv. A senior advisor to Iran's Supreme Leader died from injuries; Israel released a hit list of 9 Iranian nuclear scientists. ⚠️
Iran Nuclear Talks Developments:
Iran announced new nuclear safeguards without IAEA notice, warning NPT withdrawal if sanctioned. 🛑
June 15th U.S.-Iran talks canceled. ⏳
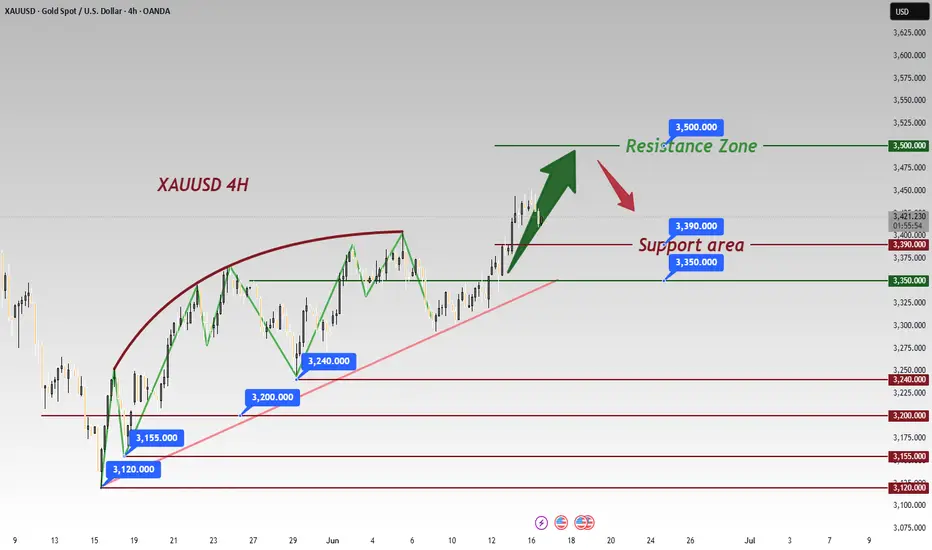
The Middle East situation is currently heating up 🌍💥. With the intensifying of geopolitical tensions in the Middle East over the weekend, gold is likely to continue to benefit from the boost of risk-averse sentiment next week and may break through the $3,500 mark 📈. The price of gold will also be affected by the Federal Reserve's decision and Powell's speech during the week 🏛️. In addition, US President Trump will visit Canada to attend the G7 Leaders' Summit from June 15th to 17th, and his speech at that time may also affect the fluctuation of gold prices, which is worthy of attention 🇺🇸🇨🇦
⚡️⚡️⚡️ XAUUSD ⚡️⚡️⚡️
🚀 Buy@ 3410 - 3415
🚀 TP 3480 - 3490
Accurate signals are updated every day 📈 If you encounter any problems during trading, these signals can serve as your reliable guide 🧭 Feel free to refer to them! I sincerely hope they'll be of great help to you 🌟 👇