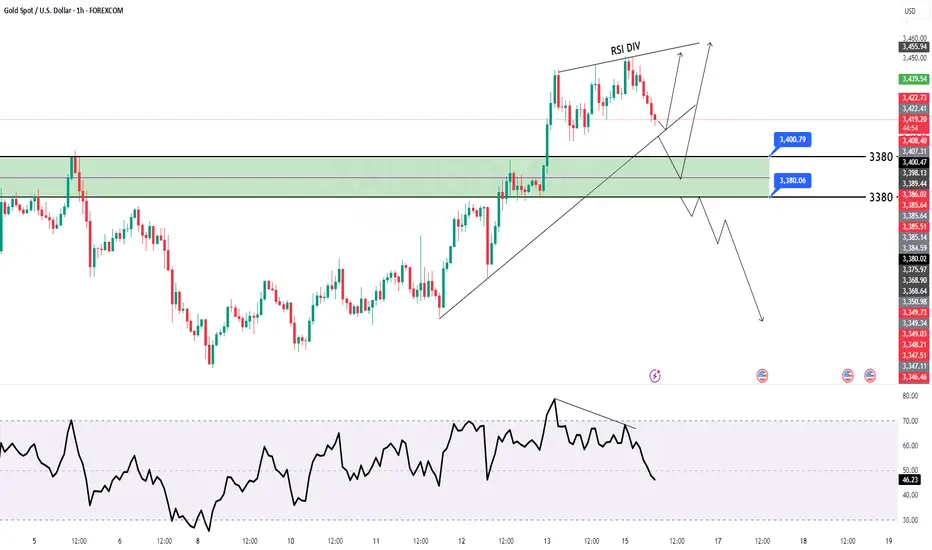
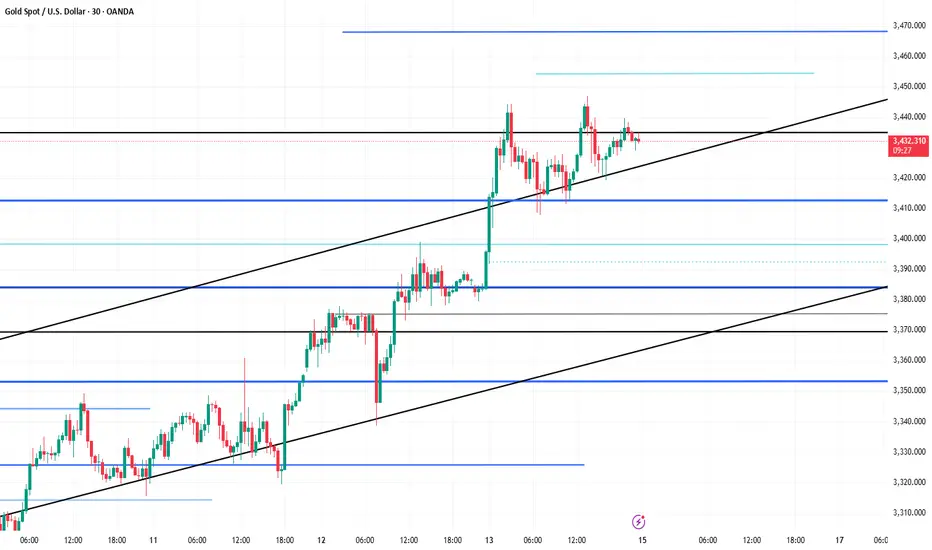
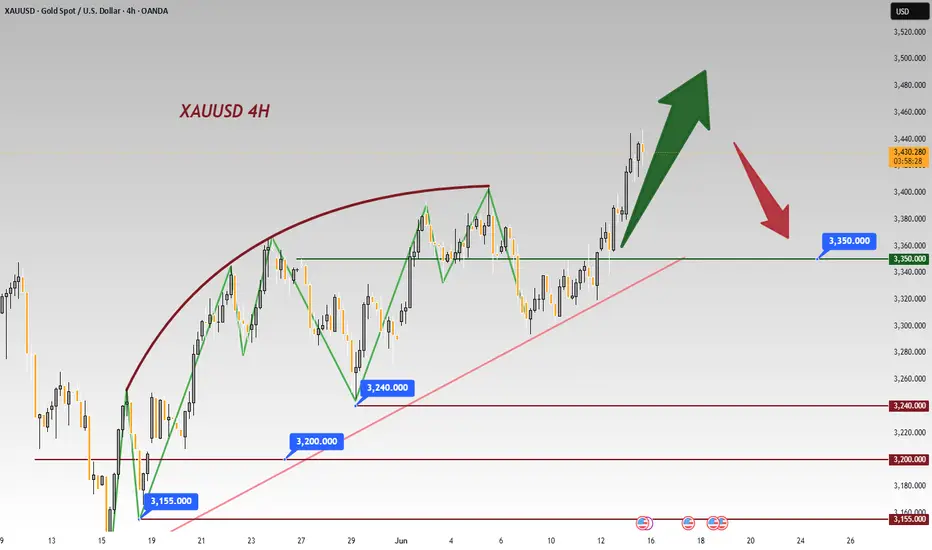
Gold price falls back and continues to go longFrom the 4-hour market analysis, the support below is around 3408-10. The short-term bullish strong dividing line moves up to the 3388-93 level. The daily level stabilizes above this position and continues to maintain the same low-long rhythm. The short position against the trend needs to be cautious. There is a high probability that the short-term will continue to rush up to test the previous high.
Gold falls back to 3408-10 and goes long. Fall back to 3388-95 and add to long position. Stop loss at 3384. Target at 3445-3450. Continue to hold if it breaks.
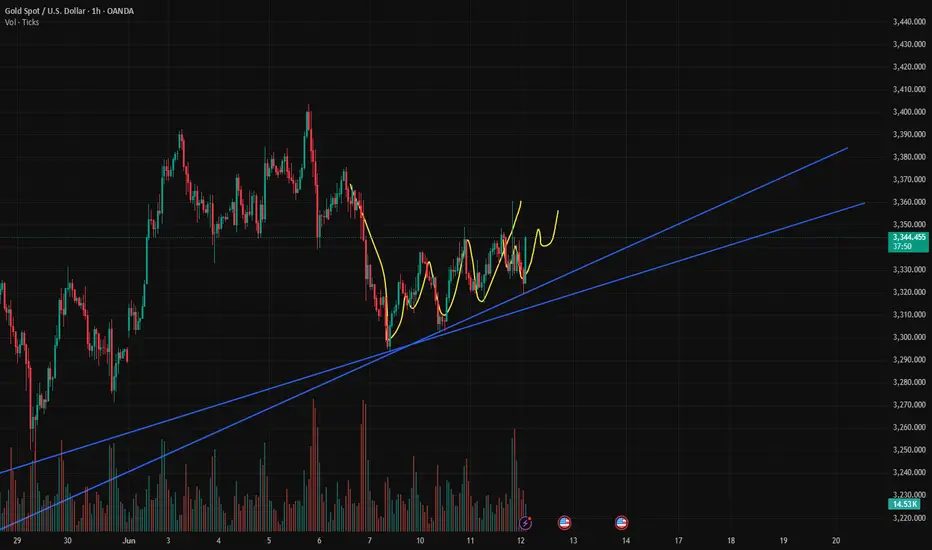
Xauusdbuy

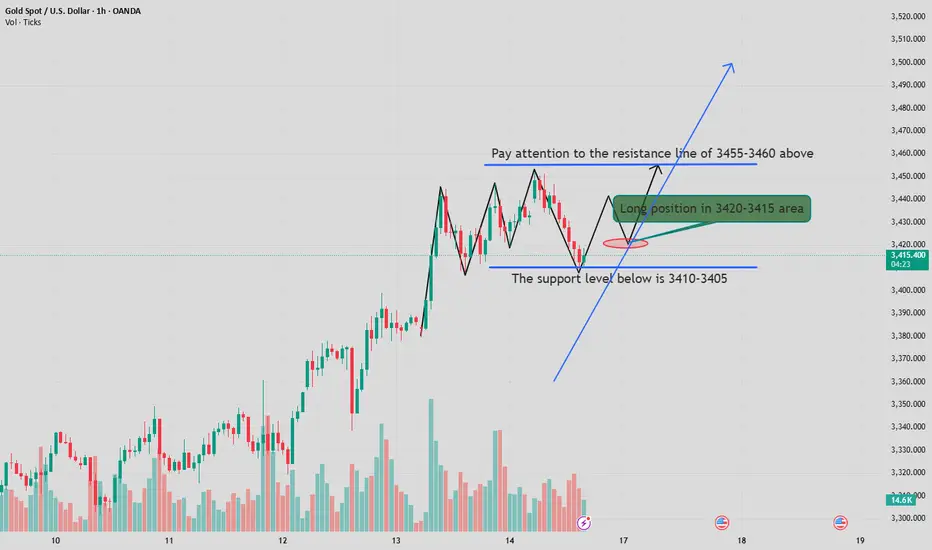
The latest gold operation strategyTechnically, the daily level reminds us to focus on the key resistance range of 3455-3460: if this area fails to break through effectively, the price may face a technical correction; if it breaks through, it may open up further upward space. The 4-hour period chart analysis shows that the gold price maintains a unilateral upward trend, the Bollinger Band channel continues to expand, and the moving average system maintains a complete long arrangement. Two major support levels need to be monitored this week: 3420 constitutes a short-term long-short watershed, and if this position is maintained, the price will maintain its strong characteristics; 3410-3405 is a key trend support level. If it is not effectively broken, the long structure will continue.
Operation strategy:
1. It is recommended to buy gold near 3420-3415, stop loss at 3407, and target 3440-3460
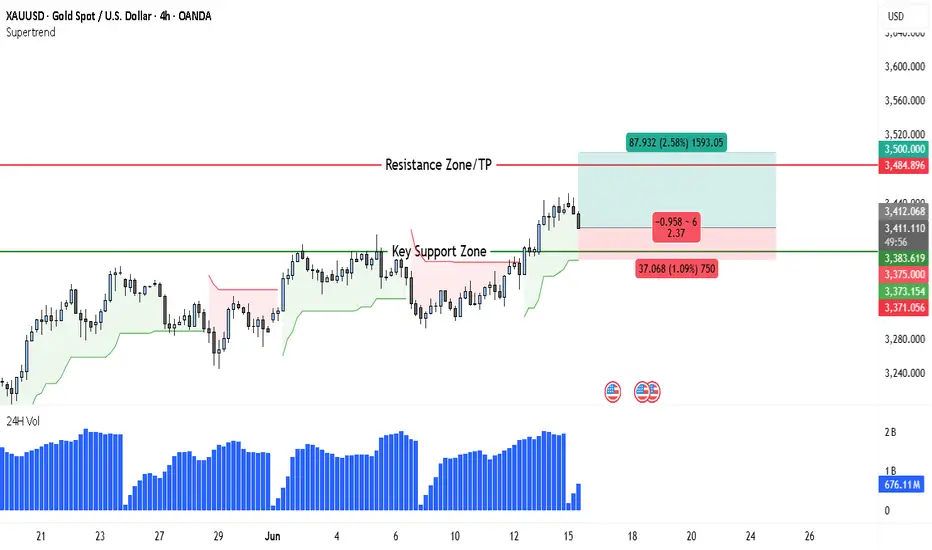
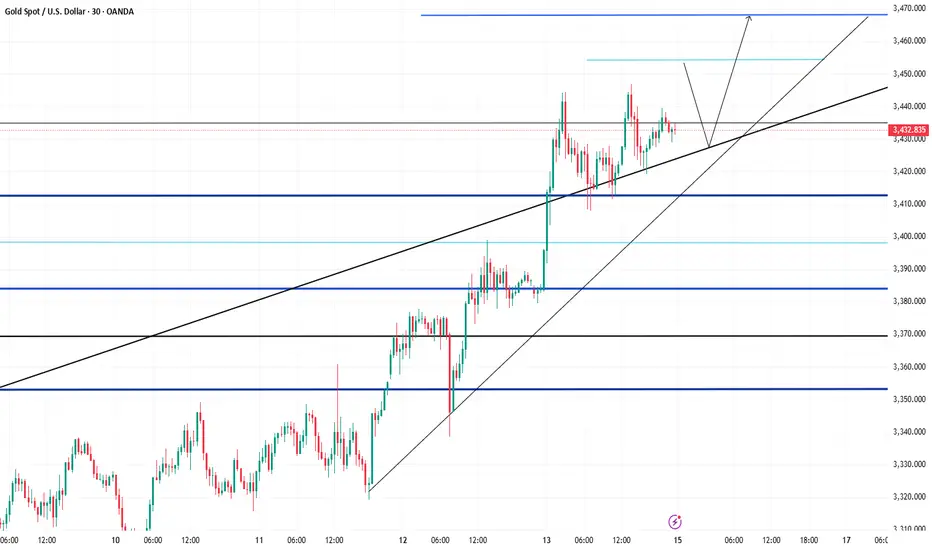
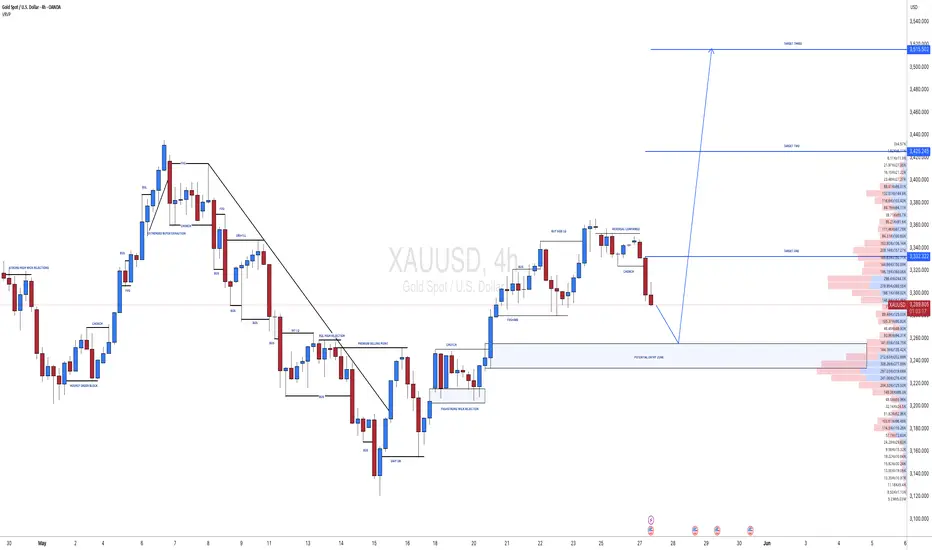
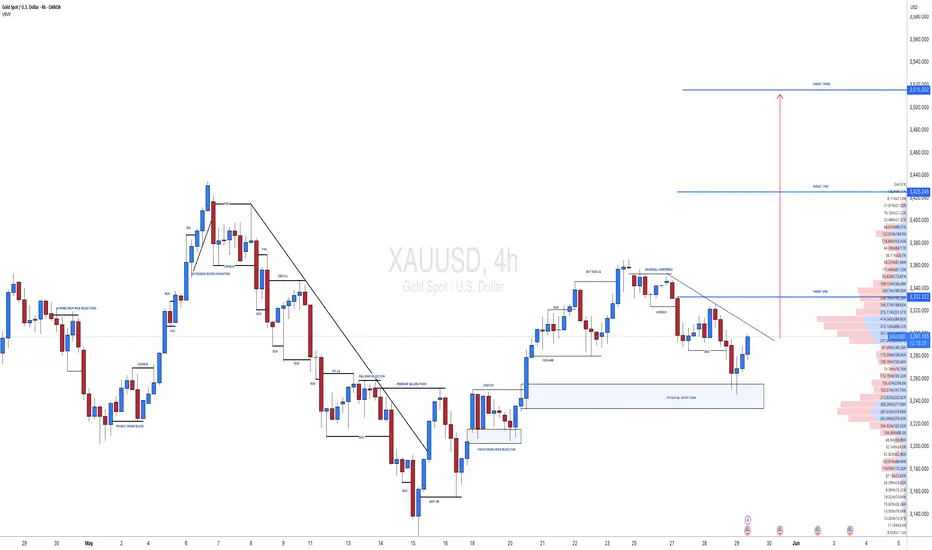
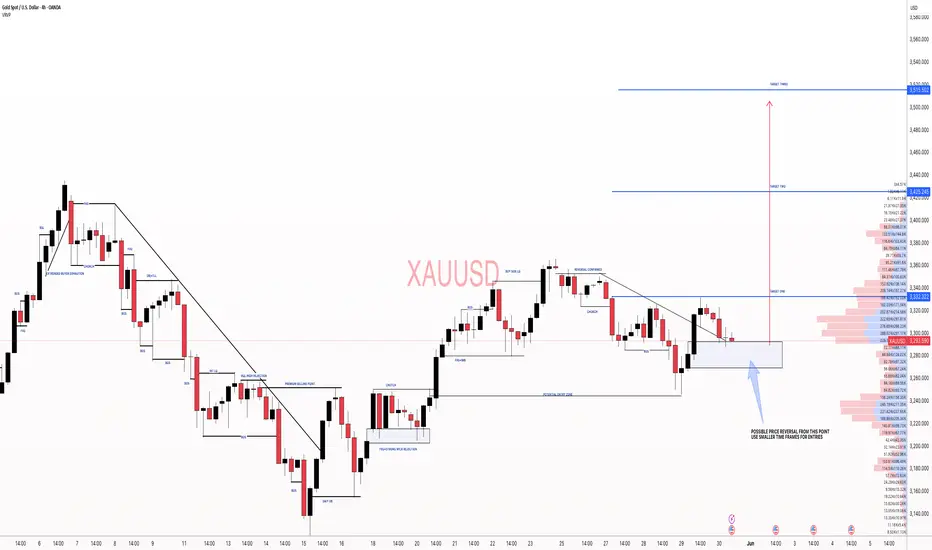
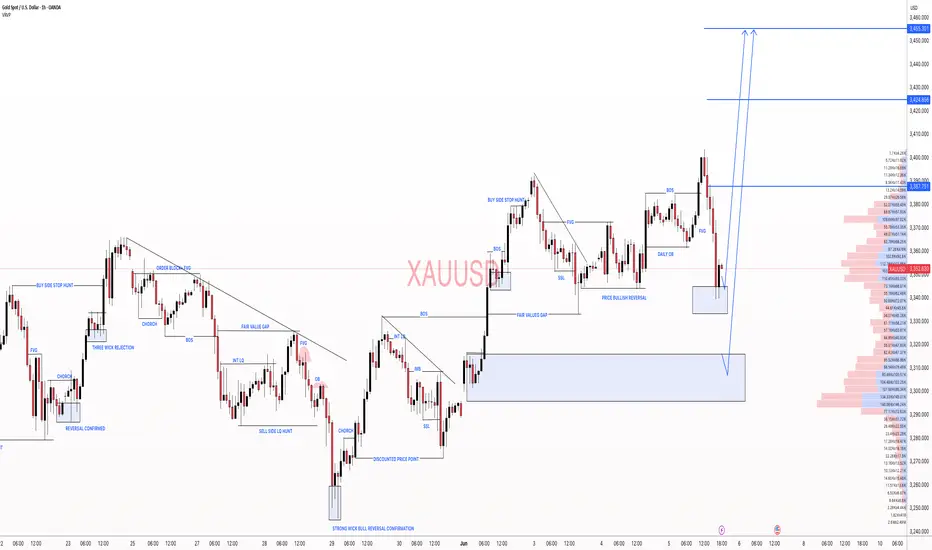
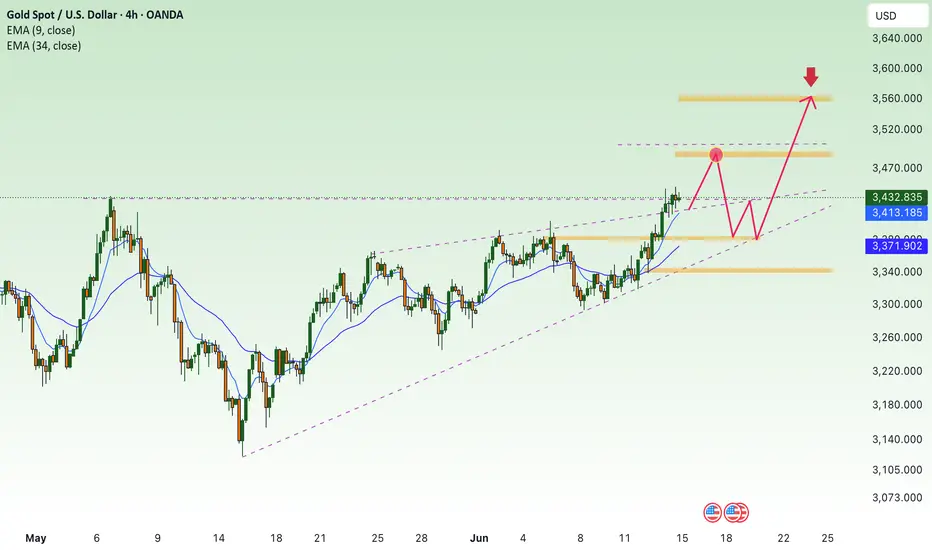
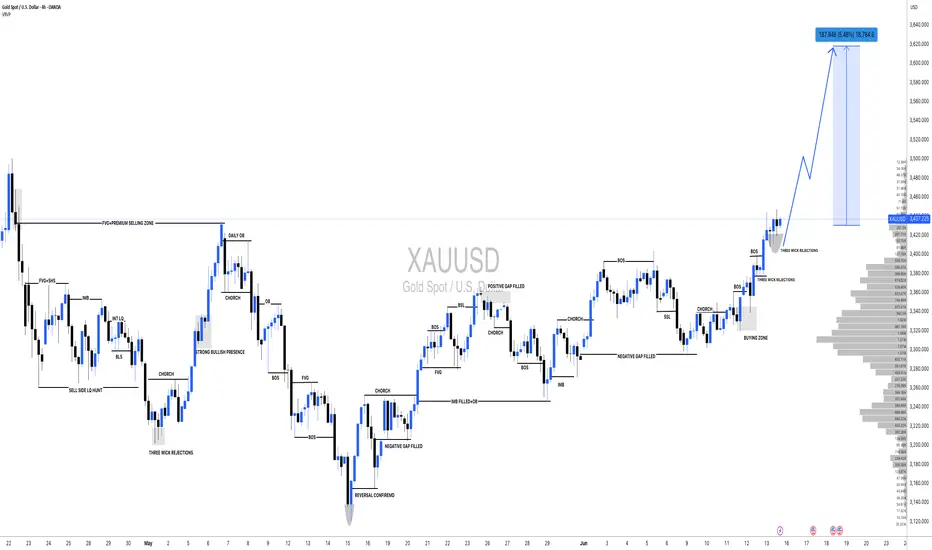
Gold Reclaims Bullish Zone—Perfect Time for a Swing EntryGold has once again reclaimed bullish momentum after breaking through the key support zone around $3,412, previously a stubborn ceiling that had acted as resistance multiple times throughout late May and early June. The break above this level—validated by a decisive green Supertrend flip—indicates a short-term trend reversal in favor of buyers.
After a brief consolidation phase, XAUUSD formed a solid breakout candle, confirming upward momentum. The current price action sits comfortably above the Supertrend line, which is now acting as dynamic support, while volume has picked up notably during the move up—an important confirmation of institutional interest and breakout strength.
Trade Setup Breakdown
• Entry: Above the $3,412 breakout area (now acting as support)
• Stop Loss: Below the key support zone, ideally near $3,373–$3,375 to allow for wick re-tests and avoid premature exits
• Target/TP: Resistance zone marked near $3,484–$3,500, which aligns with a prior consolidation ceiling from late April and early May. This target offers a risk-reward ratio of approx. 2.3:1, which is favorable for a swing position.
• Re-entry Opportunity: If gold retraces back to the $3,373–$3,383 zone (support cluster), it would provide a high-probability re-entry while keeping the same TP of $3,500.
Why the Bias Is Bullish
1. Structure Break & Supertrend Flip
The key breakout above previous resistance was clean and confirmed by the Supertrend flip to green, a historically reliable short-term bullish signal.
2. Volume Confirmation
Volume spikes on the breakout candles confirm real buying pressure—not just a false breakout or low-liquidity movement.
3. Support Retest Potential
The $3,412–$3,383 zone now forms a strong demand area where buyers are likely to defend their positions if price pulls back. This zone also aligns with historical congestion from earlier price action.
4. Macro Context (Not in chart but relevant)
Ongoing economic uncertainty, rising global tensions, and interest rate speculation continue to boost gold's safe-haven appeal. Traders are increasingly rotating into gold during periods of macro volatility.
Outlook
Gold is likely to continue climbing toward the $3,500 mark unless it closes below $3,373 on high volume. Bulls appear to be in control, and even a minor pullback could serve as a buying opportunity. As long as the price remains above the flipped Supertrend and $3,373 support, the bullish case remains intact.
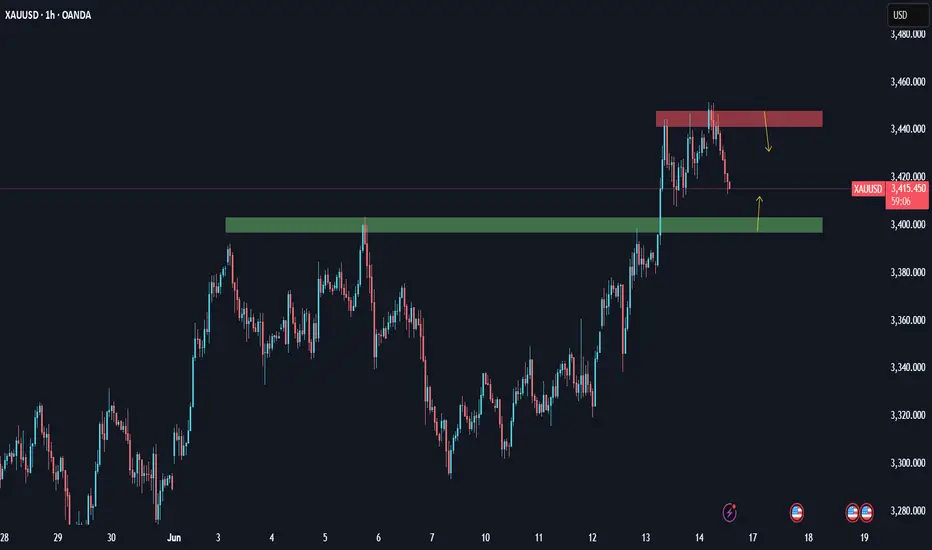
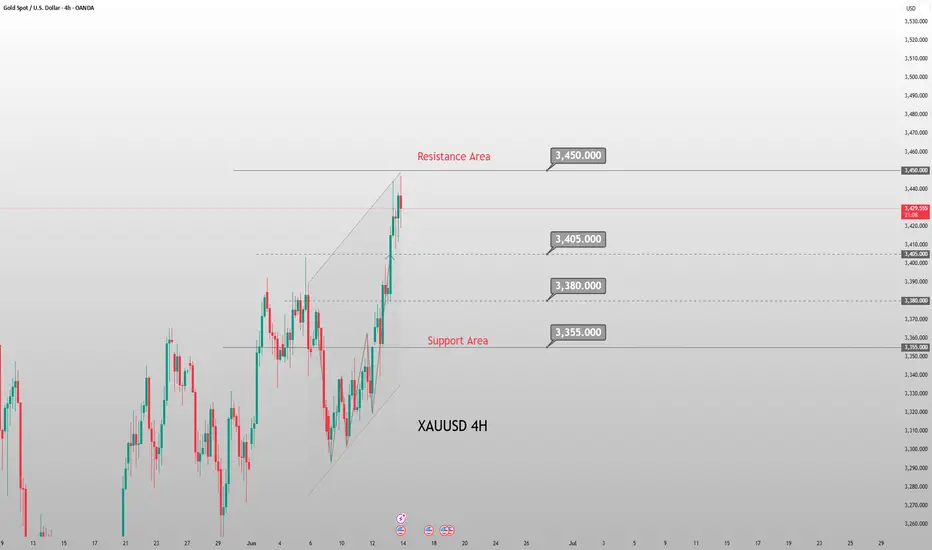
XAUUSD: Analysis June 16Gold has a lot of momentum to increase and could head towards testing the all-time high around 3500 as there are too many risks emerging, from geopolitical developments to interest rate outlook, and tariffs. Major conflicts in the Middle East, Russia - Ukraine, trade war between the US and the rest of the world, ... are all sudden risk support that makes gold likely to surge in the short term.
Gold, after increasing around 3450 this morning, is currently correcting down. But overall, the uptrend with gold is still solid after breaking the downtrend channel. However, we should avoid buying in strong corrections.
The support area around 3400 will be the ideal place for us to BUY today.
And the resistance area 3440 - 3445 will be where we SELL.
GOLD H1 Intraday Chart Update For 16 June 2025Hello Traders,
Read GOLD intraday Chart carefully as WAR scenarios is still active, only if market breaks 3400 Psychological Level Successfully then we will consider or expect longer term selling
otherwise market remains Bullish
Disclaimer; Forex is Risky
Safe-Haven Demand Expected to Push Gold Prices Toward 3500Last week, intensifying conflict between Israel and Iran triggered a strong wave of risk-off sentiment in the markets.
As a result, we saw sharp rallies across major safe-haven assets and crude oil.
Over the weekend, tensions continued to escalate and even showed signs of further expansion.
Under such circumstances, it's clear that heightened geopolitical risk will continue to support gold prices.
However, 📍$3500 remains a major resistance zone at the moment.
If gold spikes to this level intraday, it’s very likely we’ll see a short-term pullback —
Whether due to profit-taking, cautious positioning by sideline capital, or selling pressure from trapped shorts above 3490,
⚠️ this kind of correction is a natural market reaction — driven by human nature.
Even with strong risk-off demand in place, after a $200 rally,
the market is still subject to volatility from profit-taking behaviors.
🔑 Trading Strategy for This Week
As long as tensions in the Middle East persist,
🎯 the primary bias remains bullish.
However, the entry point is crucial.
💡 Important notes:
Avoid chasing price after sudden spikes caused by breaking news.
Those spikes are not ideal buy zones — instead, look for short-term selling opportunities at those highs.
Once the price pulls back, assess the retracement level and key supports before looking to buy the dip.
We are now within a historically high price range,
which means any rally could trigger profit-taking from earlier longs.
While the overall trend may still head higher,
⚠️ you need to carefully evaluate the size of potential pullbacks and whether your account can withstand the associated risks.
📊 Technical Levels to Watch:
Resistance: 3450-3455 (minor), 3468-3474 (previous high), and 3487-3499 (major historical high)
Support: 3420–3410 zone, and the deeper 3400–3386 range
Stay alert, trade wisely, and remember — in volatile geopolitical environments,
timing and discipline are more important than ever.
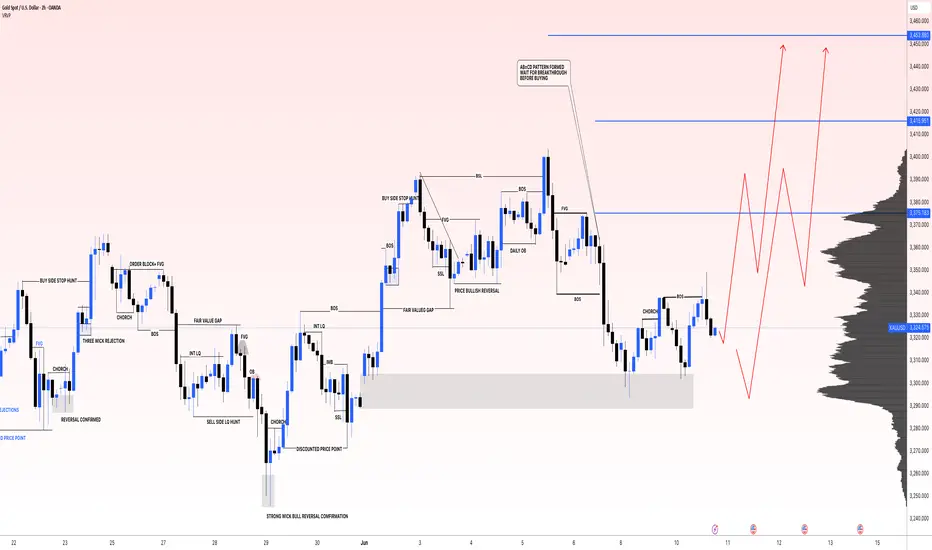
Unlock Gold's Secrets: A Daily Tape Reading Analysis for XAUUSDHey everyone! Today,
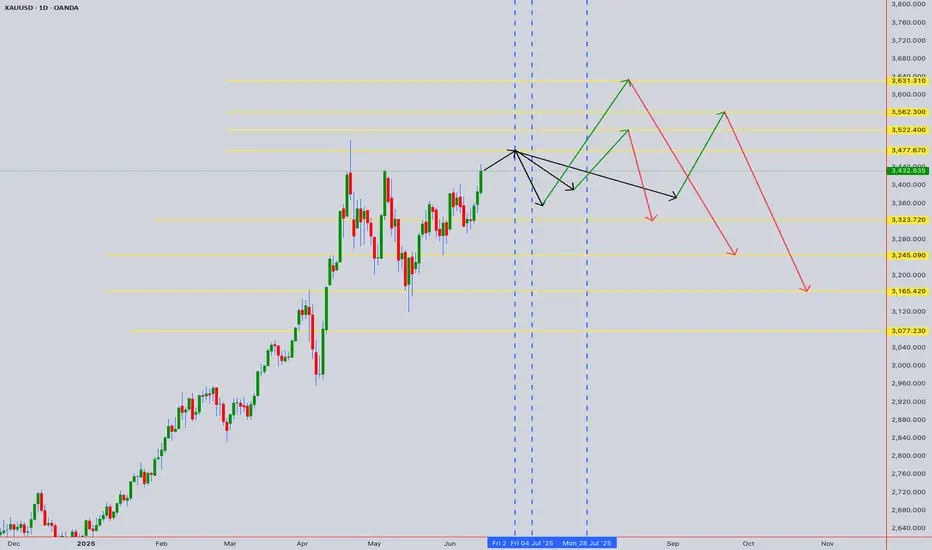
we're diving deep into XAUUSD (Gold) using a daily candle tape reading approach that aims to uncover critical turning points and price levels. If you're looking for an edge in understanding Gold's movements, this analysis could be a game-changer.
On the accompanying chart, you'll see yellow horizontal lines that highlight key bullish and bearish price levels. These aren't just arbitrary lines; they represent significant battlegrounds where buyers and sellers have historically shown their hand.
In addition, the vertical lines on the chart pinpoint specific days where we've observed a change in trade direction or a potential reversal. It's important to note that these shifts can sometimes occur within one or two candles before or after the marked day, so keep an eye on the immediate vicinity.
We're interpreting these price levels with a 3% to 5% tolerance, allowing for the natural ebb and flow of the market around these crucial points.
Key Price Levels to Watch:
Bullish Price Levels:
3477.67: A critical zone where bullish momentum has historically taken hold.
3522.40: Another strong support level that could propel Gold higher.
3562.30: Watch this level for signs of continued upward pressure.
3631.31: A significant resistance-turned-support level that could signal a strong bullish continuation.
Bearish Price Levels:
3323.72: A key level where bearish pressure has often intensified.
3245.09: If this level breaks, it could indicate further downside for Gold.
3165.42: A crucial support level; a breach here could accelerate a downtrend.
3077.23: The ultimate test for the bears; a break below could signal a more substantial correction.
__________________________________________________________________________________
What are your thoughts on these levels? Have you noticed similar patterns in your own XAUUSD analysis? Share your insights in the comments below!
⚠️ Disclaimer: This post is educational content and does not constitute investment advice, financial advice, or trading recommendations. The views expressed here are based on technical analysis and are shared solely for informational purposes. The stock market is subject to risks, including capital loss, and readers should exercise due diligence before investing. We do not take responsibility for decisions made based on this content. Consult a certified financial advisor for personalized guidance
XAUUSD:Touching $3500 One More Time Gold is currently extremely bullish and we expect price to touch 3500$ region one more time before it may reverse. you can set your own target based on your risk. Gold will remain volatile in coming weeks and we want all of you to trade safe.
Good luck and trade safe.
Team Setupsfx_
XAUUSD:[GOLD]: First Drop And Then Reverse! Comment Your Views! Gold touched $3350 but was rejected at that level, dropping around 3288. The price shows some minor support at this region, which we’re currently monitoring. If it breaks through, it could touch our buying zone, reversing the trend. You can set three targets based on your own analysis and bias. Please use accurate risk management while trading.
If you’d like to contribute, here are a few ways you can assist us:
- Like our ideas
- Comment on our ideas
- Share our ideas
Team Setupsfx_🚀❤️
#XAUUSD[GOLD]: Massive Boost For Buyers, Incoming More Volume! Gold has been moving as expected in our previous chart. We anticipate a smooth bull market in the coming days, with a target price region of 3400$. There are three specific targets you can aim for.
If you’d like to contribute, here are a few ways you can help us:
- Like our ideas
- Comment on our ideas
- Share our ideas
Team Setupsfx_🚀❤️
#XAUUSD[GOLD]:At Critical Level, Bullish Swing Is Very LikelyHey There Everyone,
So, gold prices took a bit of a dip, hitting 3250 gold. But guess what? They bounced back like a rubber ball and reached 3332! And here’s the exciting part: they broke through that pesky bearish trend line. This means they’re probably going to retest that line to confirm the trend.
Right now, it looks like they’re at a potential retest point, and that’s where things could get really interesting. If strong bullish volume comes in, the price could skyrocket! There are three possible targets here: 3332, 3362, and 3420.
Now, here’s something important to keep in mind: next week, there are some big news and events coming up that could totally shake things up in the gold market. And let’s not forget about price manipulation. If someone tries to mess with the price, it could drop back to 3250 and then reverse course. So, it’s crucial to have backup plans in case of any unexpected twists.
The US dollar is also going to be all over the place due to upcoming news, which could disrupt the gold market and other currencies. So, it’s best to trade cautiously today and next week. The price can be a bit unpredictable, so take your time to do your own analysis and assess your risk before making any moves.
Good luck and trade safely! We wish you all the best in your trading journey!
Cheers,
Team Setupsfx_
XAUUSD: Another Important Update On Gold Prices! We recently posted an idea analysis on Gold, but our first entry was invalidated due to the heavy sell-off. We expect a smooth move from the current price point. However, please remember that the market conditions will remain volatile and uncertain due to important economic data being published tomorrow.
Good luck, trade safely!
Team Setupsfx_
#XAUUSD[GOLD]:+2200 Pips Big Move! | Setupsfx_|Gold is currently accumulating in smaller timeframes, which suggests it’s in the early stages of a significant move. It’s possible that the price will reverse from either of the entry zones. There are three take-profit areas you can target, but only if they align with your view. This is an educational post, so please don’t blindly follow it – do your own analysis.
Like and comment for more!
Team Setupsfx_
Opportunity for gold price to return to ATH: 3500✍️ NOVA hello everyone, Let's comment on gold price next week from 06/16/2025 - 06/20/2025
⭐️GOLDEN INFORMATION:
Gold prices surged for a third straight session on Friday as geopolitical tensions flared following Israel’s military strikes on Iranian targets, including nuclear facilities and key leadership. The escalation sparked a broad risk-off move across global markets, fueling demand for safe-haven assets. At the time of writing, XAU/USD trades at $3,422, marking a gain of over 1% on the day.
The yellow metal briefly soared to a five-week high of $3,446 before paring gains, as traders took profits ahead of the weekend. The geopolitical unrest, combined with dovish signals from recent US inflation data, has reinforced expectations that the Federal Reserve could begin cutting interest rates later this year—despite improving consumer sentiment. Together, these dynamics continue to support the bullish momentum in gold.
⭐️Personal comments NOVA:
Military tensions continue next week, which is a big boost for gold prices to continue rising above 3500.
🔥 Technically:
Based on the resistance and support areas of the gold price according to the H4 frame, NOVA identifies the important key areas as follows:
Resistance: $3488, $3502, $3562
Support: $3382, $3342
🔥 NOTE:
Note: Nova wishes traders to manage their capital well
- take the number of lots that match your capital
- Takeprofit equal to 4-6% of capital account
- Stoplose equal to 2-3% of capital account
- The winner is the one who sticks with the market the longest
Current Gold Trend Analysis and Trading RecommendationsOn Friday, the strategy of going long on gold at relatively low levels was once again precisely fulfilled. The morning strategy clearly suggested opening long positions within the range of 3400 - 3410. As expected, the price of gold once again surged to around the 3445 level, and profits were successfully secured once more.
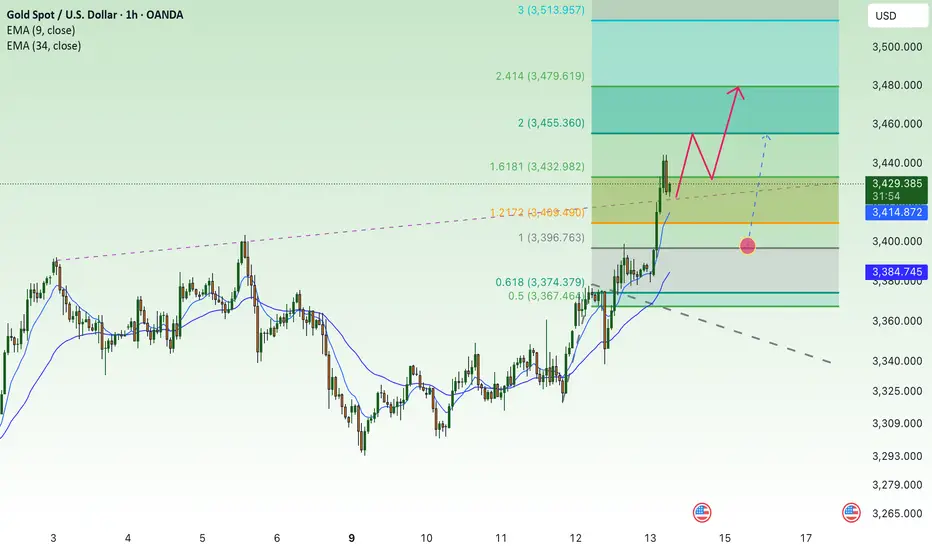
The hourly chart of gold shows a volatile upward trend. Driven by risk aversion in the early morning, it surged rapidly but fell back for correction after hitting resistance at 3444 during the European session. Before the U.S. session, it stabilized at 3412 and rallied again. The previous large bearish candlestick was more of a minor shakeout—after washing out floating chips, it has now regained its upward momentum.
Maintain a strongly bullish approach for now. The 3415-3410 range forms a key support zone, and long positions can be continued above this level. Upper resistance remains at 3445-3450; a valid breakout could lead to further gains toward 3475 and beyond. However, be aware that a sustained rally may trigger a pullback due to overbought indicators or divergences. For operations, consider going long near support and exercise caution when chasing highs near resistance
XAUUSD
buy@3405-3315
tp:3430-3450
Investment itself is not the source of risk; it is only when investment behavior escapes rational control that risks lie in wait. In the trading process, always bear in mind that restraining impulsiveness is the primary criterion for success. I share trading signals daily, and all signals have been accurate without error for a full month. Regardless of your past profits or losses, with my assistance, you have the hope to achieve a breakthrough in your investment.
Gold: Monitor Middle East Developments Over the WeekendAmid escalating tensions in the Middle East, risk-off sentiment surged,
sending gold soaring past the 3414 resistance and peaking near 3450,
before retracing and rebounding off the 3414 support zone.
⚠️ While this was a high-volume breakout, it was news-driven,
so keep in mind:
📌 If tensions ease over the weekend, a pullback on Monday is highly likely
📌 If tensions escalate, another bullish run would be expected
—
🔍 Technical Outlook:
🧭 4H chart: 9-count nearing completion — overbought signals building
🧭 2H chart: MACD showing early signs of a bearish crossover; potential divergence forming
🧭 1D chart: Breakout with volume confirms bullish trend, but risk of short-term correction remains
—
📌 Key Price Zones:
🔺 Resistance: 3468 – 3487 – 3500
🔻 Support: 3414 (critical) – 3400 – 3392
⚠️ If broken, next downside targets: 3378 – 3367
—
📈 Strategy Suggestions:
As we head into Monday:
✅ Consider selling on rallies if geopolitical tensions ease
✅ If tensions worsen, follow the momentum — but watch for reversal signs
XAUUSD(GOLD): +1874 PIPS Target| Touching $3600? Gold experienced a significant price surge, driven by the ongoing conflict between Iran and Israel. This heightened uncertainty among global investors led to a price touch of $3445. The current price is accumulating, and we anticipate a strong bullish distribution in the near future. Please prioritise accurate risk management during trading.
Good luck,
Team Setupsfx_
May peace prevail on earthIf geopolitical conflicts continue to fester, gold prices may keep climbing due to safe-haven demand—yet this is far from our wish. 📈
When risk aversion pushes candlestick charts higher, we'd rather see battlefield fires cease by dawn, letting the rhythm of peace replace market volatility. 🌍✨
Fomo is bullish, gold could hit 3480⭐️GOLDEN INFORMATION:
Gold prices extended their rally for a second consecutive session on the back of weaker-than-expected inflation and labor market data in the United States (US), with XAU/USD climbing to $3,386—just below the key $3,400 threshold—amid mounting geopolitical tensions in the Middle East.
The overall market sentiment remains buoyant, fueled by consecutive soft US inflation prints that have amplified pressure on the Federal Reserve (Fed) to begin easing monetary policy. Meanwhile, signs of fragility in the labor market persist, as jobless claims exceeded 240,000 for the second week in a row, underscoring concerns about the broader economic outlook and lending further support to the safe-haven appeal of gold.
⭐️Personal comments NOVA:
War, a factor that helps gold prices grow, towards 3480
⭐️SET UP GOLD PRICE:
🔥SELL GOLD zone: 3478- 3480 SL 3485
TP1: $3462
TP2: $3450
TP3: $3435
🔥BUY GOLD zone: $3375-$3377 SL $3370
TP1: $3389
TP2: $3400
TP3: $3412
⭐️Technical analysis:
Based on technical indicators EMA 34, EMA89 and support resistance areas to set up a reasonable BUY order.
⭐️NOTE:
Note: Nova wishes traders to manage their capital well
- take the number of lots that match your capital
- Takeprofit equal to 4-6% of capital account
- Stoplose equal to 2-3% of capital account
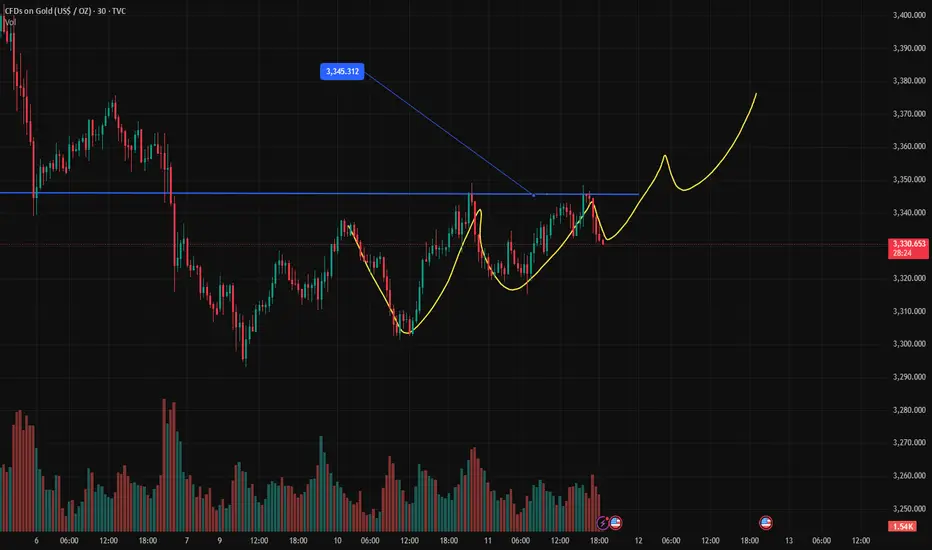
XAUUSD:Buy or SellRegarding the trend of XAUUSD (gold against the US dollar), it is completely in line with my expectations yesterday. The current price has reached the watershed of 3345. If it breaks through, continue to be bullish. If it does not break through. Then wait for the market to fall.
### Key analysis points
1. Confirmation of resistance breakthrough
- The importance of the 3345 level: If this position is a resistance that has been tested many times recently (such as previous highs, Fibonacci retracement levels or trend line suppression), it may trigger short-covering or new buying after the breakthrough, pushing the price further up.
- Verify the effectiveness of the breakthrough: It is necessary to observe the momentum at the time of the breakthrough (such as accompanied by a large positive line, increased trading volume) and whether the closing price can stand above 3345 to avoid false breakthroughs.
2. Upward target
- First target: If the breakthrough is established, the next resistance may look at the 3360-3380 area (previous high or extended Fibonacci level).
- Medium-term potential: If the trend reversal is confirmed, it may even challenge the 3400 psychological level.
3. Pullback risk management
- Support level: If it fails to break through 3345 or falls back after a false breakout, you need to pay attention to the support below (such as 3320-3300), which is the short-term long-short watershed.
- Stop loss reference: The stop loss of long positions can be set below 3300 to protect the safety of funds.
Trading strategy suggestions
- Aggressive strategy (breakthrough trading):
- Entry: Go long when the price breaks through 3345 and then confirms the pullback.
- Stop loss: Below 3320 (adjusted according to volatility).
- Take profit: Close orders in batches (3360, 3380).
- Conservative strategy (retracement trading):
- Wait for the pullback to the 3320-3300 support area to stabilize and then go long, stop loss 3280.
- The target is the same as the breakthrough strategy.
- Short warning:
If the 3345 resistance continues to suppress and a bearish pattern appears, consider shorting with a stop loss above 3360.
Variables to be added
1. Time frame: Is the above analysis based on the daily or 4-hour chart? Short-term trading requires a smaller cycle to confirm the signal.
2. Driving factors: Pay attention to the Fed's policy expectations, the US dollar index, the geopolitical situation, etc., which may suddenly change the technical pattern.
Summary
Whether the current rebound can continue depends on the effectiveness of the breakthrough of 3345. If successful, it can be bullish, but a strict stop loss is required.
If you need a more detailed entry point analysis or position management plan, please feel free to let me know your trading cycle and risk preference, and I will provide you with a customized strategy.

XAUUSD: Buy or sell now?Continuously update good transactions. Let members make rich profits. How to trade XAUUSD today?
Reference suggestions are as follows:
If it retreats to the range of 3318-3328, consider buying. Target 3345-3360
If it falls below 3310, chase the shorts and choose to sell. Target 3280-3265
For reference only. Do not trade independently.
If you need a more detailed entry point analysis or position management solution, please feel free to tell me your trading cycle and risk appetite, and I will provide you with a customized strategy.
XAUUSD: Buy or sell now?The price of XAUUSD has come to the position near 3345 again. The pressure at this position is very controversial. We need to observe. If this position is stable. Then we need to pay attention to the target of 3360-3385. If it is unstable, we will short and wait for the TP of 3320, which still needs to be emphasized. If you are not sure how to trade. Remember to leave us a message. We will lead you to make better and more accurate transactions, expand profits or recover losses. Do not trade independently. Create greater losses.
Remember to continue to pay attention to the core trading strategy updates of swing trading.
XAUUSD:Go long, go long
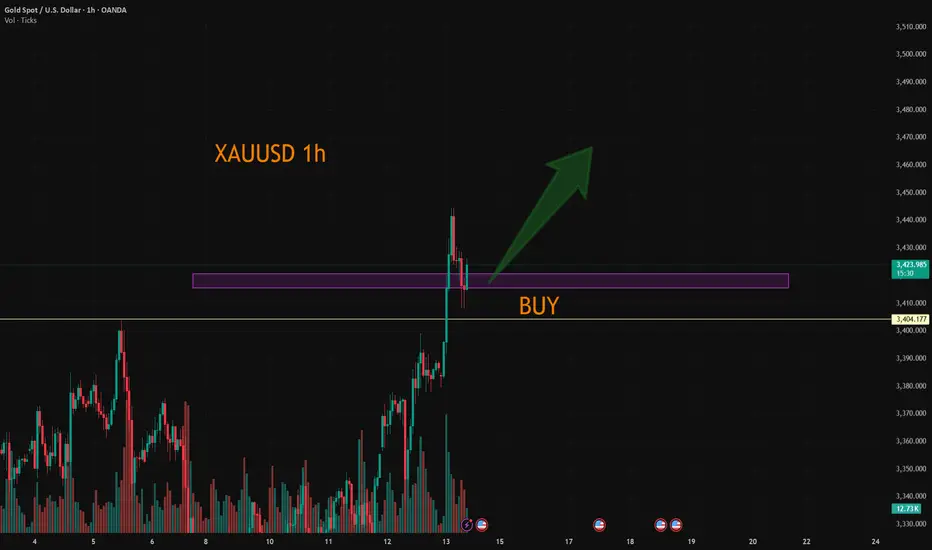
"Israel announced a strike on Iran" broke out the news, gold and crude oil in the Asian session soared. Again help us recently do long ideas, too late to explain so much, the follow-up trading ideas are still long after the pullback.
After 3403 broke through has been converted into strong support, short - term to 3415-20 to do more.
Trading Strategy:
BUY@3415-20
TP:3440-50
↓↓↓ More detailed strategies and trading will be notified here ↗↗↗
↓↓↓ Keep updated, come to "get" ↗↗↗