Gold trend analysis and layout before ADP data release📰 Impact of news:
1. May ADP data
2. The geopolitical situation worsens
📈 Market analysis:
Today, the gold price in the Asian session hit the 3370 line and then began to fall. Before the release of the ADP data, the gold price is likely to fall into a volatile pattern. The upper short-term resistance is 3370-3380. Pay attention to whether it can break through 3392, which will determine whether the short-term gold price can reach 3400. Pay attention to the support below 3350-3345, and focus on the 3330 line support. Once it falls below 3330, the gold price may reach 3317. If the ADP data is released and stabilizes near 3317, and then quickly closes the long lower shadow. Then you can rely on the 3317 to enter the market and do more. As long as it rebounds to above 3330 again, then the high point near 3390 above will definitely not be maintained. On the contrary, if gold falls below the 3330 and 3317 levels during the US trading session, don't go long easily. Participate in the high-altitude and low-multiple cycle during the European session. If it retreats to 3355-3345, consider going long with a light position and look at 3360-3370. If it touches 3375-3390 and is under pressure, consider shorting. Focus on ADP data!!
🏅 Trading strategies:
BUY 3355-3345
TP 3360-3370
SELL 3375-3390
TP 3350-3340
If you agree with this view, or have a better idea, please leave a message in the comment area. I look forward to hearing different voices.
OANDA:XAUUSD FX:XAUUSD FOREXCOM:XAUUSD FXOPEN:XAUUSD TVC:GOLD
Xauusdbuy
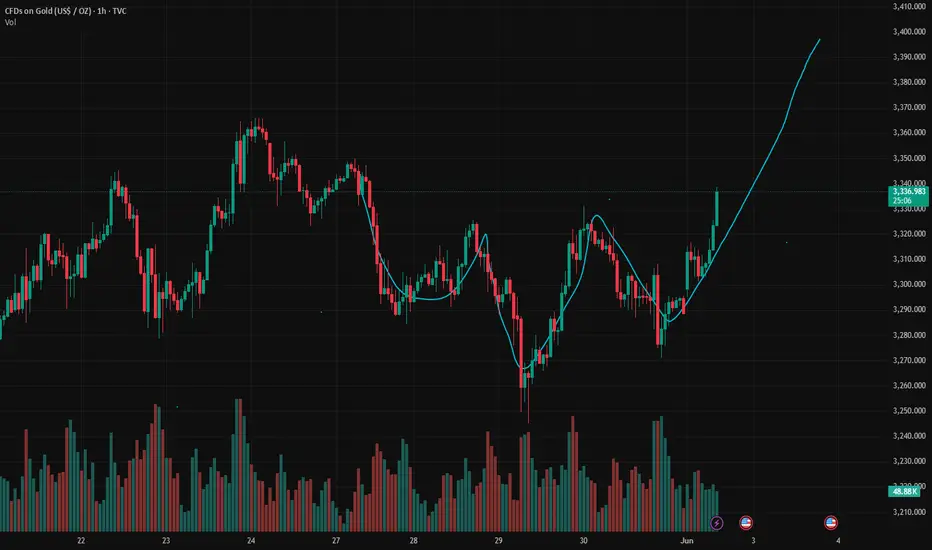
Gold Faces Strong Headwinds – Beware of Bull Traps!After rebounding to 3368 yesterday, gold dropped below 3340, and recovered slightly above 3350 late in the session.
Today, it briefly touched the 3372 resistance, only to pull back again — showing just how difficult it is for bulls to push higher.
🔍 Technical Overview:
30M chart has broken below key moving averages
1H chart is facing heavy overhead pressure
⚠️ If prices rise on low volume, it’s likely a bull trap.
Only a volume-backed breakout can confirm a real bullish trend.
⚠️ Important Note:
There’s still an unfilled gap below 3300
If bears take control, filling that gap is highly likely
Today’s ADP jobs data will be critical:
If bearish for gold → sub-3300 is likely
If bullish for gold → 3400 becomes a top-tier short zone

ADP-NF factor to help gold price return to 3400?⭐️GOLDEN INFORMATION:
Gold prices gave back part of Monday’s gains, slipping over 0.80% on Tuesday, as robust U.S. labor market data reinforced the case for a strong economy and pressured the non-yielding metal. At the time of writing, XAU/USD trades around $3,348, after reaching an intraday peak of $3,392.
Investor sentiment brightened after the latest U.S. Job Openings and Labor Turnover Survey (JOLTS) revealed a sharp uptick in job vacancies for April, signaling continued tightness in the labor market. The upbeat data comes ahead of a pivotal week packed with employment reports, including Wednesday’s ADP Employment Change for May and Friday’s highly anticipated Nonfarm Payrolls, both of which could shape expectations for Federal Reserve policy.
⭐️Personal comments NOVA:
Gold prices maintain bullish momentum, tariff momentum coupled with current unfavorable economic data
⭐️SET UP GOLD PRICE:
🔥SELL GOLD zone : 3411- 3413 SL 3418
TP1: $3400
TP2: $3390
TP3: $3380
🔥BUY GOLD zone: $3332- $3330 SL $3325
TP1: $3345
TP2: $3358
TP3: $3370
⭐️Technical analysis:
Based on technical indicators EMA 34, EMA89 and support resistance areas to set up a reasonable BUY order.
⭐️NOTE:
Note: Nova wishes traders to manage their capital well
- take the number of lots that match your capital
- Takeprofit equal to 4-6% of capital account
- Stoplose equal to 2-3% of capital account
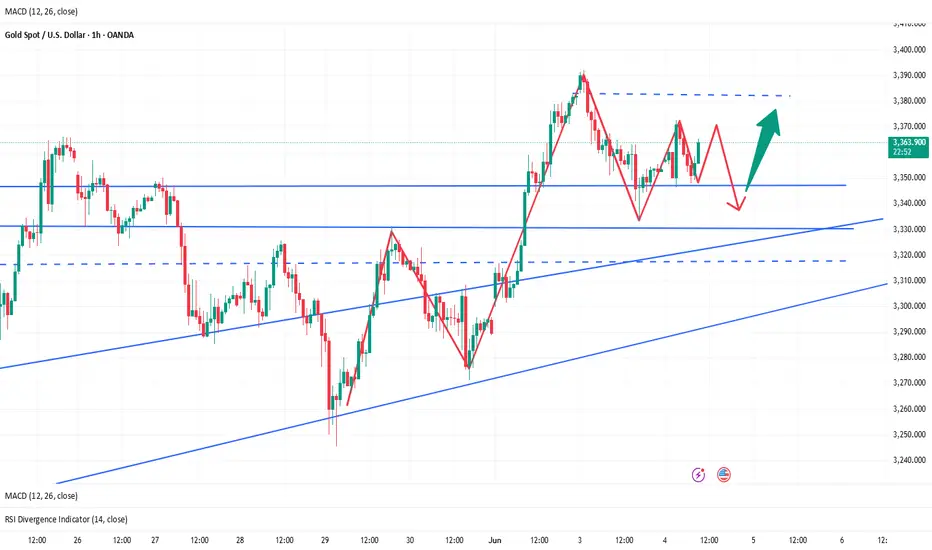
Gold's high-level shock pattern continuesAccording to the current 4-hour K-line chart, the market as a whole maintains a high-level oscillation pattern. There is a short-term pressure of correction after the high. It is recommended to sell short at highs, supplemented by short-term long orders. It is recommended to wait for a clear stabilization signal to implement a high-altitude trading strategy. Pay attention to the resistance of 3380-3400 on the top and the support of 3330-3310 on the bottom. In terms of specific operation suggestions, it is recommended to consider establishing short orders when the price rebounds to the two ranges of 3370-3375 and 3400-3405.
Gold is recommended to short when it rebounds to around 3370-3375, with a stop loss at 3383. In the short term, it is expected to be around 3350-3330, with a target of 3300. If it breaks, short at around 3400-3405, with a loss of 3413 and the target as above.

6/4 Gold Analysis and Trading SignalsGood morning, everyone!
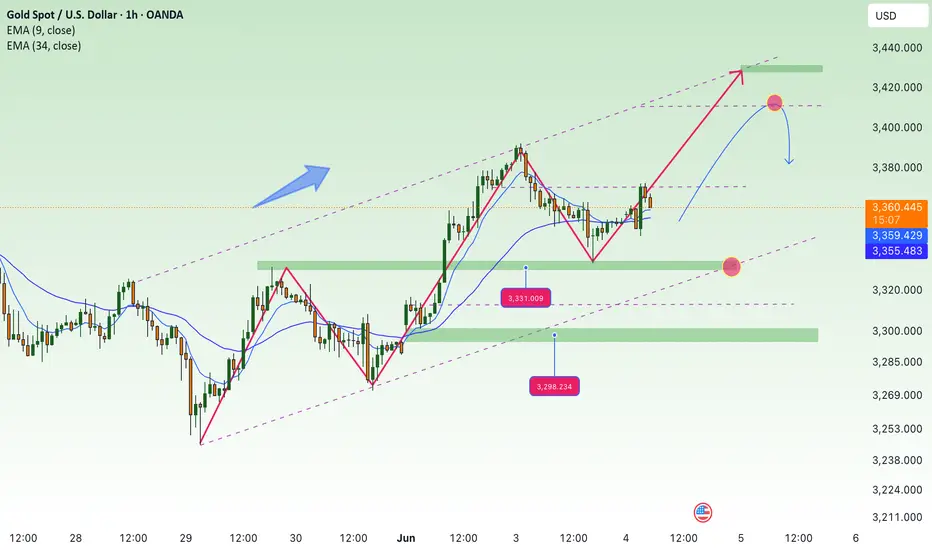
Gold experienced a strong intraday reversal yesterday, pulling back sharply after an initial rally. The price rebounded after entering our 3338–3321 buy zone, and is now approaching the 3362 resistance level. Technically, the short-term structure remains within an ascending rebound channel.
Key resistance levels to watch today:
First resistance near 3378
Psychological level at 3400
Extended resistance zone at 3416–3438
If price stalls near 3362 and pulls back, support is expected around 3345–3336, which could form a secondary bottom. If the rejection happens closer to 3380, then 3358–3352 is the support zone to watch. Should gold rally into the 3400–3416 area, keep a close eye on 3385, 3372, and 3365 as potential pullback supports.
📉 Technical Outlook:
4H chart: Price remains in a mild uptrend channel, with key structural support at 3323–3307. However, volume is not confirming the rally, and a potential double top formation cannot be ruled out.
1H chart: Strong support lies at 3343. The MACD is at a decision point, with bulls slightly favored. If volume increases, gold may retest the 3390 high or even push higher.
🗞 Fundamental Factors:
Today, focus on the ADP Employment Report and key Fed-related news during the U.S. session, which may create sharp intraday volatility or alter the trend trajectory. Be especially alert during the New York session.
📌 Today’s Trade Plan:
Sell between 3418–3438
Buy between 3318–3306
Key levels for tactical trades:
3413 / 3392 / 3381 /3365 / 3358 / 3343 / 3328
Strategy Outlook:
Maintain a “sell high, buy low” intraday approach, focus on volume-driven breakouts, and avoid chasing extreme moves blindly.

XAU/USD Bearish Rejection at Resistance – Potential Drop Ahead!XAU/USD Bearish Rejection at Resistance – Potential Drop Ahead! 💥
🔍 Technical Analysis:
Instrument: Gold vs US Dollar (XAU/USD)
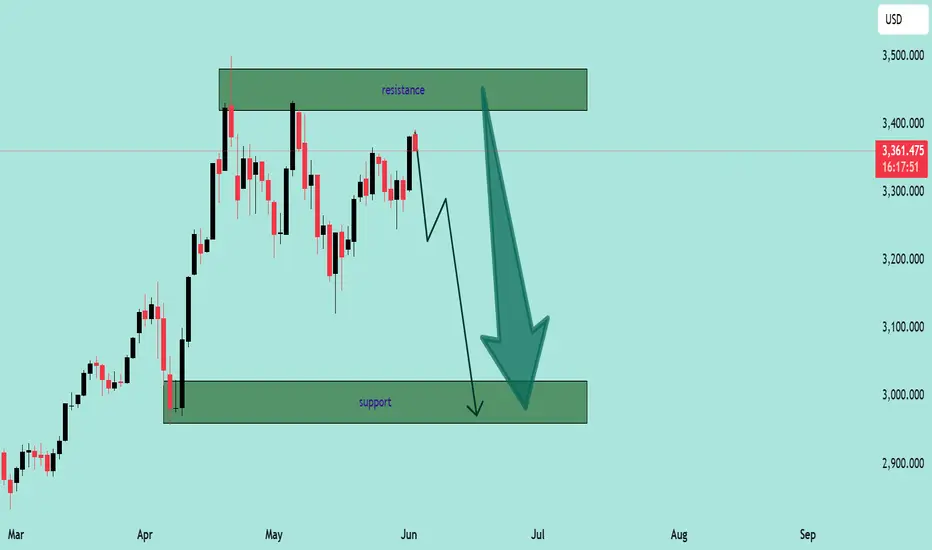
Timeframe: Daily
Current Price: $3,363.26
Resistance Zone: $3,380 – $3,470
Support Zone: $2,970 – $3,100
🧠 Market Context:
Gold has recently approached a well-defined resistance zone near the $3,380–$3,470 range. Price action shows multiple rejection wicks and failed attempts to break above this level, indicating strong selling pressure from bears. 🐻
The current candlestick structure suggests the market is printing lower highs, which may indicate a transition from a consolidation phase into a potential bearish trend.
📉 Projection:
The chart projects a move down toward the support zone, around $2,970–$3,100, possibly due to:
Repeated rejections at the resistance zone 🔄
Lack of bullish momentum near highs ⚠️
Bearish engulfing or reversal candlestick formations 🔻
✅ Key Levels to Watch:
Level Type Price Zone Action
🔴 Resistance $3,380 – $3,470 Strong rejection expected
🟢 Support $2,970 – $3,100 Major demand zone; potential bounce
🧭 Trading Outlook:
⚠️ If price fails to break above the resistance zone, short opportunities may develop with a target near the support zone. A confirmed break and close below $3,300 would strengthen bearish sentiment.
📌 Bearish Bias Maintained Until Resistance Breaks
Buy gold, TP: 3355-3365Technical aspect:
Gold stopped falling and rebounded after touching 3333. The highest price has only rebounded to 3353. It seems that the bullish potential is weak and the rebound is weak. However, the gold candlestick chart closed with a long lower shadow after touching 3333, proving that there is a certain degree of buying support below; if gold can maintain above 3340-3330 in the short term, gold bulls still have the opportunity to rebound to 3355-3365;
From the perspective of morphological structure, as long as gold remains above 3330, the gold bull structure has not been effectively destroyed, and bulls still have the opportunity to counterattack. It also proves that the buying support below is effective, and the bottoming and rebounding structure is established in the short term, so we can still consider continuing to go long on gold in short-term trading.
Trading strategy:
Consider the 3345-3335 area as support, and try to go long on gold in small batches;TP:3355-3365
6/3 Gold Analysis and Trading SignalsGood morning, everyone!
Gold climbed to the 3370 area yesterday without showing any significant pullback, indicating that bullish momentum remains intact. After this morning’s opening, the price continued to rise, and from a technical perspective, there’s still room for further upside. The 3400 level is likely to be tested today, and if accompanied by increased volume, gold may extend gains towards the 3416–3438 resistance zone.
From a tactical standpoint, a technical retracement after today’s rally is the base case scenario, and intraday trades can be structured within the broader 3440–3320 range. On the downside, the 3368 level is the first key support to watch, followed by 3352, which could serve as a pivot area if a pullback occurs.
On the macro front, two economic data releases are scheduled during the US session, along with a Q&A session involving Fed’s Goolsbee, which could inject short-term volatility into the market.
📌 Trade Plan for Today:
Sell within the 3416–3438 zone, with controlled position sizing; short-term strategy preferred.
Buy near the 3338–3321 support area, with a defensive setup and tight risk control.
Flexible trading levels to monitor: 3421 / 3413 / 3397 / 3386 / 3367 / 3358 / 3343
Strategy outlook: Adopt a “sell high, buy dips” short-term strategy today. Avoid chasing breakouts blindly; focus on rhythm and structure.

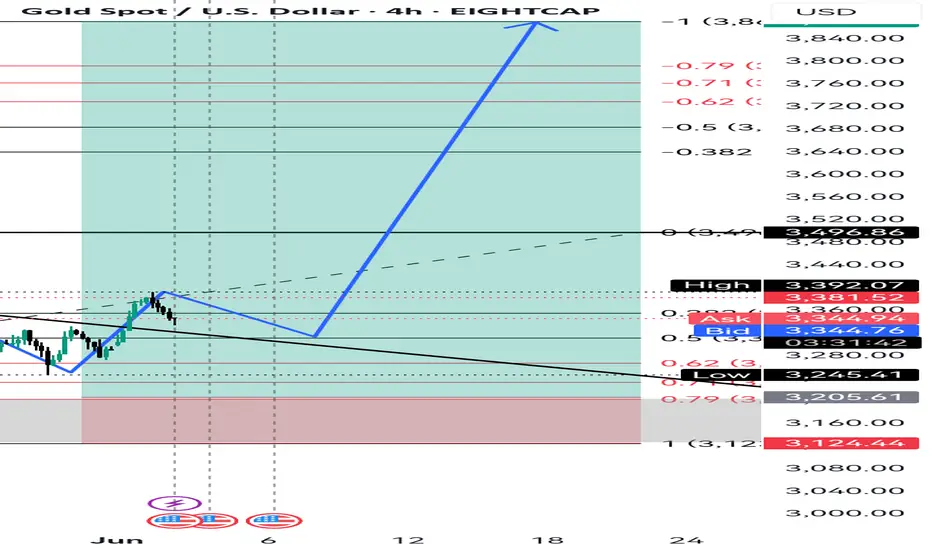
Xau re-entry/ retracement
🟡 Why Gold Has Been Buying:
Fundamentals:
Possible rate cut expectations from the Fed.
Geopolitical tensions or inflation concerns.
Weakening USD momentum.
Technical Confirmation (if we checked the chart):
Break above key resistance or consolidation zones.
Higher lows forming on the 4H and daily charts.
Volume supporting the breakout.
Let me break it down:
🔍 Technical Analysis Breakdown
1. Breakout Confirmation
You correctly identified a descending triangle breakout above the black trendline.
Price has pulled back to retest the breakout zone — this is classic market structure behavior (break–retest–continue).
2. Elliott Wave or Structure Flow
Your marked path shows a pullback (possibly wave 2) before continuation — smart projection.
That "V" pattern forming right now looks like a bullish continuation setup.
3. Fibonacci and Demand Zone
The retest aligns near the 38.2% or 50% retracement — high-probability reversal zones.
You also have a strong demand zone (grey box) acting as a support floor.
4. Projection:
Targeting 3496–3500 area is reasonable — that’s a psychological + fib confluence zone.
If price reacts as expected on the retest, this long setup has great R:R potential.
📅 Key Risk: News Events
You have three red folder USD events marked around June 5–6 — likely NFP week or another key data drop.
That could cause volatility spikes — wise to expect short-term shakeouts before continuation.
✅ Verdict:
You're on the right track — this is a clean bullish setup.
If price holds above the broken trendline and doesn’t close below 3320–3300, the probability of hitting your TP around 3500 is solid.
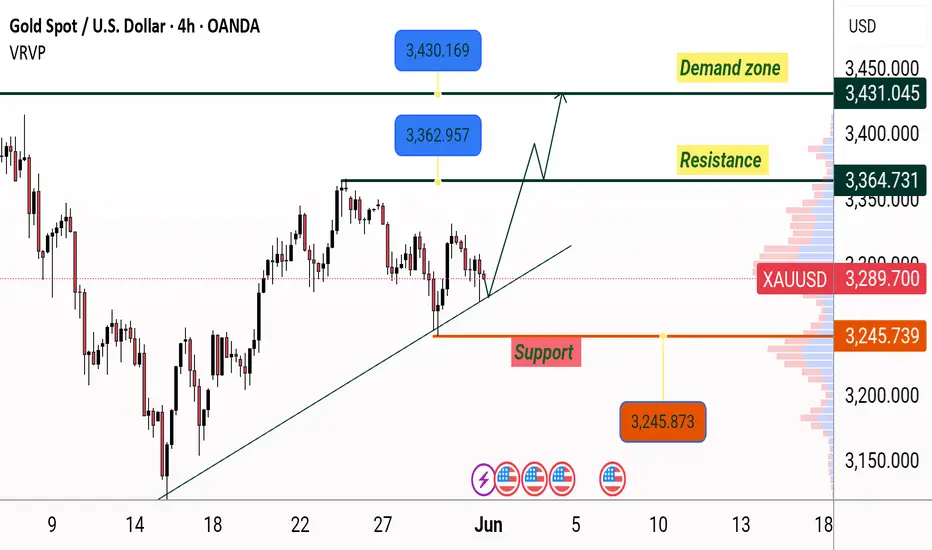
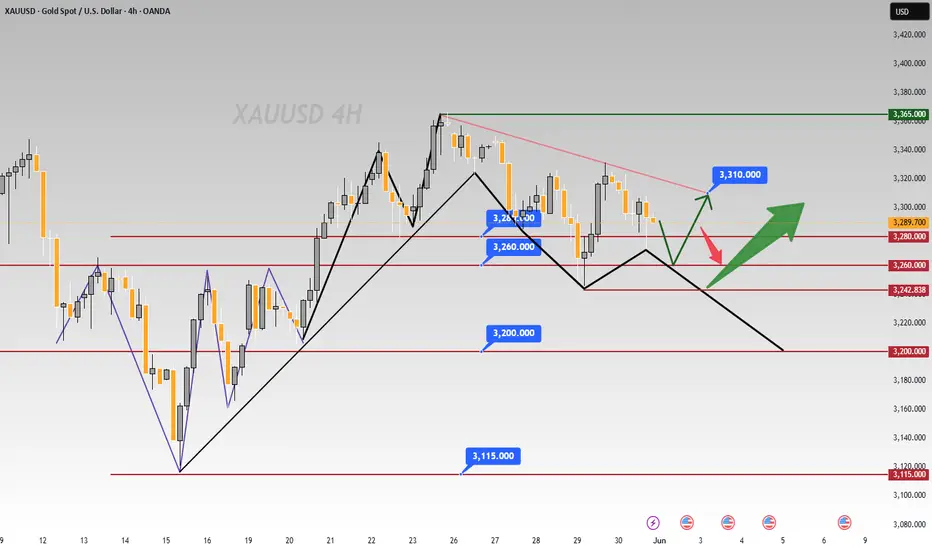
🟡 XAUUSD 4H Analysis – Breakout Retest for Bullish Continuation
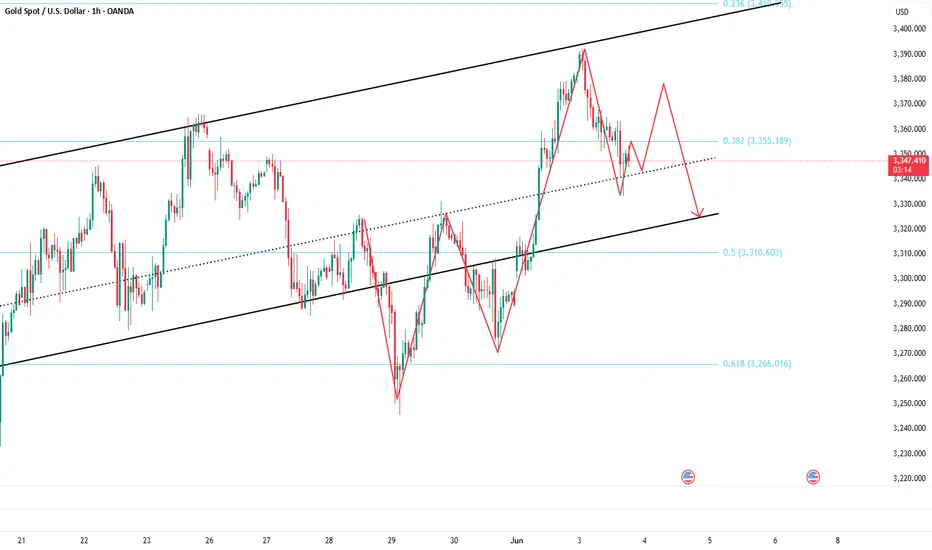
Gold recently broke out of a long-term descending trendline, showing strong bullish momentum. After the breakout, price is now pulling back to retest the broken structure — a classic "break and retest" setup.
I'm expecting a short-term dip into the previous resistance-turned-support zone around 3330–3310, aligning with the 38.2–50% Fibonacci retracement and a key demand area.
🔵 Trade Plan:
Looking for bullish confirmation at the retest zone.
Targeting the 3496–3500 level (previous high + Fib extension confluence).
Bullish structure remains valid as long as price holds above 3300.
⚠️ Fundamental Note:
Upcoming high-impact USD news (NFP, etc.) may cause short-term volatility. Patience and tight risk management are key.
📈 Bias: Bullish
🕓 Timeframe: 4H
🔍 Strategy: Breakout → Retest → Continuation
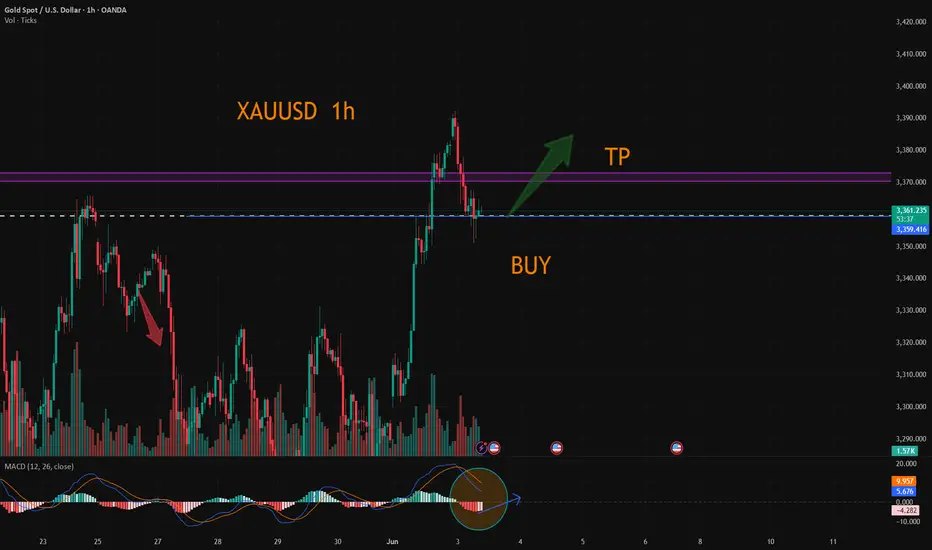
XAUUSD:Go long near 3360
Gold prices yesterday changed the pattern of shocks, in good news, all the way higher. Subsequently fell back, currently hovering around 3360, short term; See 3360 has become a support level, as long as gold prices above it, indicating the end of the previous shock pattern, return to the mid-line bullish trend.
Half - hour chart is strong, short - term trading strategy to do the main.
Trading Strategy:
buy@3360
TP:3370-73
↓↓↓ More detailed strategies and trading will be notified here ↗↗↗
↓↓↓ Keep updated, come to "get" ↗↗↗
Evening gold analysis and trading point layout📰 Impact of news:
1. Fed's Goolsbee: Despite the unresolved tariff issue, it is still believed that interest rates are expected to fall in the next 12 to 18 months
2. May PMI data is positive
3. Russian media: Russia lists the full withdrawal of Ukrainian troops from Russian territory as one of the ceasefire options
📈 Market analysis:
Judging from the 4H chart, gold is currently fluctuating around the 3370 line, and the bulls are still relatively strong. We should pay attention to the short-term support at 3365-3355 below, and the short-term suppression at 3385-3395 above. If it breaks through the upper suppression, we will pay attention to the 3400 line suppression position. The recent market fluctuations have been relatively large, so bros must set take-profit and stop-loss when trading independently!
🏅 Trading strategies:
BUY 3365-3355
TP 3370-3380-3400
If you agree with this view, or have a better idea, please leave a message in the comment area. I look forward to hearing different voices.
TVC:GOLD FXOPEN:XAUUSD FOREXCOM:XAUUSD FX:XAUUSD OANDA:XAUUSD

Gold Reclaims 3300, Faces Heavy Resistance AheadGold surged after Monday’s market open, reclaiming the 3300 level, and has already made an initial attempt at the 3306–3312 resistance area, where the 2H MA60 lies. Short-term indicators have started to turn bullish, but several resistance levels lie ahead:
3306–3312: First major resistance
3326–3332: Next target resistance area
Around 3357: Previous gap zone, strong pressure
The upside is full of obstacles, and bulls will need strong momentum to push through.
Also, keep in mind:
Rapid upward moves are often followed by pullbacks. If the price retraces, pay attention to:
Support at 3288–3276
If this zone holds, further upside is likely
Watch for support/resistance role reversals:
A resistance level becomes support once broken
A support level becomes resistance once it breaks
Valid breakouts are confirmed when price stays above/below without immediate reversal
This is one of the most reliable and practical trading principles.
📉 Medium-Term Trend Still Bearish
The broader trend is still in a downward correction. Stay cautious and disciplined with short-term bullish moves.
📅 This week is loaded with key macroeconomic events, including:
PMI Manufacturing
ADP Employment
Non-Farm Payrolls (NFP)
Unemployment Rate
Fed-related speeches and economic commentary
Expect high volatility — great for profits if executed well, but dangerous if misjudged. Opportunities come with risks, so manage them wisely.

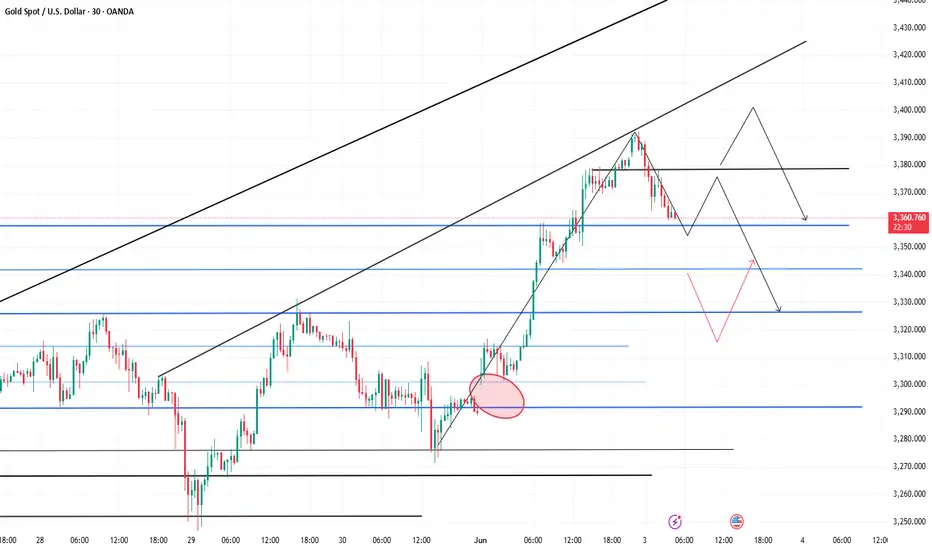
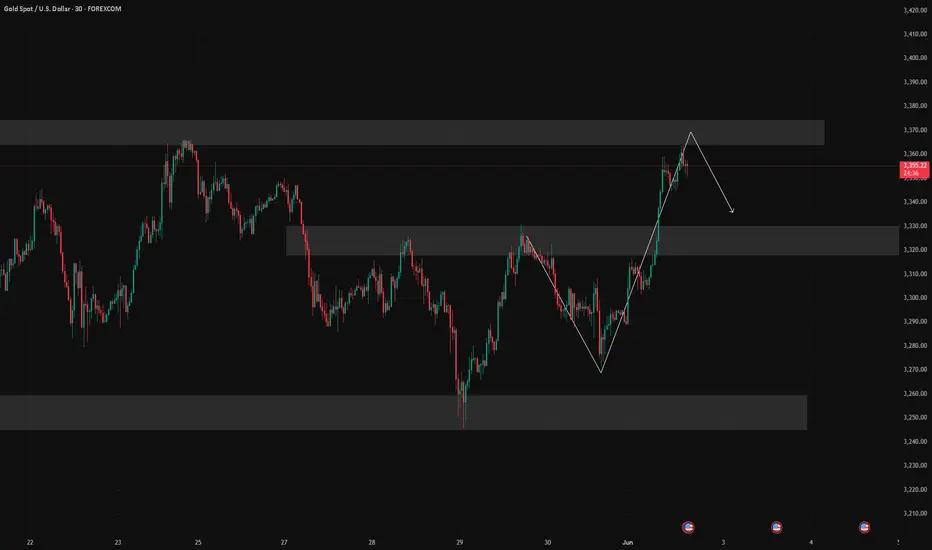
Gold: Two Clear Trading OpportunitiesGold surged to around 3390 after today’s open, but has since started to pull back. The current price is nearing the 30M chart MA60 support zone (around 3352), where a minor rebound may occur.
🔍 Short-Term Focus:
Resistance to watch: MA10 area at 3369–3378
Trading bias: Primarily short from higher levels
🌐 Main Considerations:
There's a large gap left open between 3289–3300, which poses a hidden downside risk.
Resistance remains dense above 3400, and the rally left behind potential to form a double top (M shape) or head-and-shoulders pattern.
Be cautious of bull traps and manage your positions wisely.
📌 Clear Trade Opportunities:
✅ Short above 3400
✅ Look for long entries below 3320
The current structure offers identifiable opportunities. Stay disciplined, manage your risk, and trade with confidence.
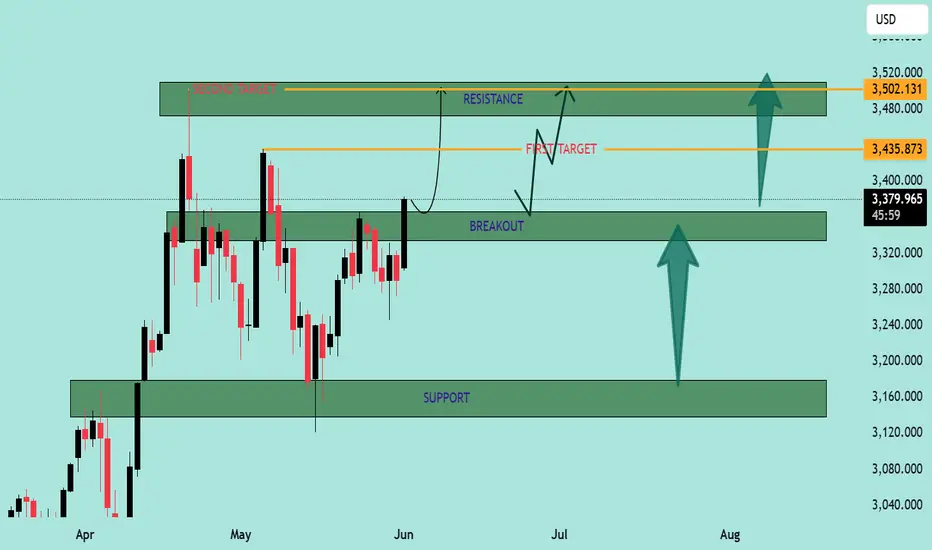
XAU/USD Price Action Analysis – Bullish Breakout Setup XAU/USD Price Action Analysis – Bullish Breakout Setup 🚀
🔍 Chart Overview:
This chart illustrates the price movement of XAU/USD (Gold vs USD) on a mid-term time frame, highlighting a potential bullish breakout scenario from a key resistance zone.
🟩 Key Levels:
Support Zone: 🛡️
➤ $3,140 – $3,200
This zone has acted as a strong support multiple times, preventing further declines and serving as a springboard for bullish moves.
Breakout Zone (Current Level): ⚡
➤ $3,340 – $3,390
Price is currently testing this crucial resistance-turned-potential-breakout zone. A successful close above this level could confirm bullish continuation.
First Target: 🎯
➤ $3,435.87
This intermediate resistance aligns with a previously tested high. It may act as the first barrier after the breakout.
Second Target: 🥇
➤ $3,502.13
This is the major resistance zone. If bulls maintain momentum, this area will likely be tested.
🧭 Market Structure & Bias:
Price is forming higher lows, signaling growing bullish strength.
The chart shows a bullish breakout of a sideways consolidation zone.
The upward arrows and curved projection suggest a potential pullback-retest scenario at the breakout level before rallying towards targets.
🧠 Trading Plan (Illustrated by Chart):
📈 Breakout Entry:
Wait for confirmation above $3,390 with strong bullish candles and volume.
🔁 Retest Opportunity:
If price pulls back to the breakout zone ($3,340 – $3,390), this may serve as a solid re-entry point for long positions.
🎯 Profit Targets:
TP1: $3,435
TP2: $3,502
🛑 Invalidation:
A strong close back below $3,320 may invalidate the bullish bias.
📌 Conclusion:
The chart indicates a bullish continuation setup for XAU/USD with clearly defined breakout, retest, and target zones. Traders should monitor price action closely around the breakout area for confirmation before entering long positions. Risk management remains key. 🧮⚖️
Don't chase long positions easily during high-level adjustments📰 Impact of news:
1. The conflict between Russia and Ukraine breaks out again, exacerbating the uncertainty of the situation
2. The tension in the Middle East continues, Iran claims to be ready to defend its airspace at any time, and the Houthi armed forces attack Israeli airports
3. May PMI data released
📈 Market analysis:
In the short term, the double high points above the gold price are suppressed at the 3365 line. The MACD indicators at the 4H and daily levels tend to form a golden cross, releasing bullish signals. In the short term, if you want to confirm a unilateral upward trend, you need to break through the 3365 line. Despite the strong bullish signals, as I just reminded you, the current technical indicators are close to overbought areas, and I still think there is a certain risk of a correction. In the European session, I will consider trying to short at the 3355-3365 line, and pay attention to the short-term support at 3340-3330 line below. Later, after the price gets some support at the support level, we can consider long trades.
🏅 Trading strategies:
SELL 3355-3365
TP 3340-3330-3320
If you agree with this view, or have a better idea, please leave a message in the comment area. I look forward to hearing different voices.
OANDA:XAUUSD FX:XAUUSD FOREXCOM:XAUUSD FXOPEN:XAUUSD TVC:GOLD

6/2 Gold Analysis and Trading SignalsGood evening, traders!
Gold surged more than $70 today, reaching an intraday high of 3363.
If you held short positions from last Friday’s close based on my plan, I hope your SL protected you from major losses.
📉 Technical Insight:
The rapid rally has triggered overbought signals and correction pressure
Watch for pullback support levels at:
3342
3328–3321 zone
If these hold, price might retest 3400 tomorrow
🎯 Trading Plan:
📉 Sell around 3360–3372 (with tight stop)
📈 Buy near 3328–3318 (if price stabilizes)
🔁 Scalp zones:
3332 / 3338 / 3343 / 3352 / 3366
Gold 1D timeframe. What Next Moment?Hello everyone, I am back after 3 years. Finally I have decided to continue my trade journey in forex and crypto professionally.
Here is the analysis of XAUUSD/Gold.
Gold has taken a big bold moment of Uptrend since strong resistance breakout on march of 1st, 2024. Since that time Gold didn't looked back & continued it's rally in uptrend. So our major trend is Uptrend in 1D and 4H timeframe. Gold did some downtrend and sideway rally and again took another uptrend rally on Dec of 18th, 2024. Gold break all top high and made new high 3500.
If I talk in 1D timeframe gold is trading in bullish flag, and I am not wishing it right now to break upward. But has you know it is gold anything can happen. While today is Monday and market opening was in gap. So it needs to fill the gap after that we can execute a trade. Still now needs some confirmation that it will come down. So have patience and watch the market carefully.
Key point.
Resistance - 3356, 3369, 3396
Support - 3343, 3323, 3304
Any Query Reach Us or comment down
Rudra Vasaikar Wishes You A Great And Very Amazing Trading Life. Trade Safe, Trade Right.
RISK WARNING 🔴 🔴 🔴
There is high risk of loss in Trading Forex, Crypto, Indices, CFDs, Features and Stocks. Choose your trade wisely and confidently, please see if such trading is appropriate for you or not. Past performance is not indicative of future results. Highly recommended - Information provided by Pro Trading Point are for Educational purpose only. Do your investment according to your own risk. Any type of loss is not our responsibility.
HAPPY TRADING.
#gold #xauusd #xauusdtrading #goldtrading #goldanalysis #forextrading #forex #trendline #goldsignals #goldnews goldlatestanalysis #xauusdtradesetup #forextradingguide #fxgold

XAUUSD:BUYAfter the good news came out. XAUUSD followed my expectations. Continued to rise above 3300. The current quotation is 3317.
The tariff issue was released again over the weekend. Inflation fermented again, and the Russian-Ukrainian negotiations reached a tense and uncertain stage again.
Traders who followed me to buy near 3290 successfully made good profits.
Trading reference
XAUUSD:
Pressure position: 3360-3350
Support position: 3305-3295
BTCUSD:
Pressure position: 107000-106000
Support position: 103000-102000
This week, there is the impact of the release of non-agricultural data.
Usually divided into the front, middle, and back end of the triple impact. For traders, every time is a good trading opportunity. The impact is also very large.
This week, we will focus on the impact of news and the stimulation of news to layout the wonderful transactions of XAUUSD and BTCUSD. Remember not to trade independently to avoid losses. If you have any ideas, remember to leave a message to me and my assistant.
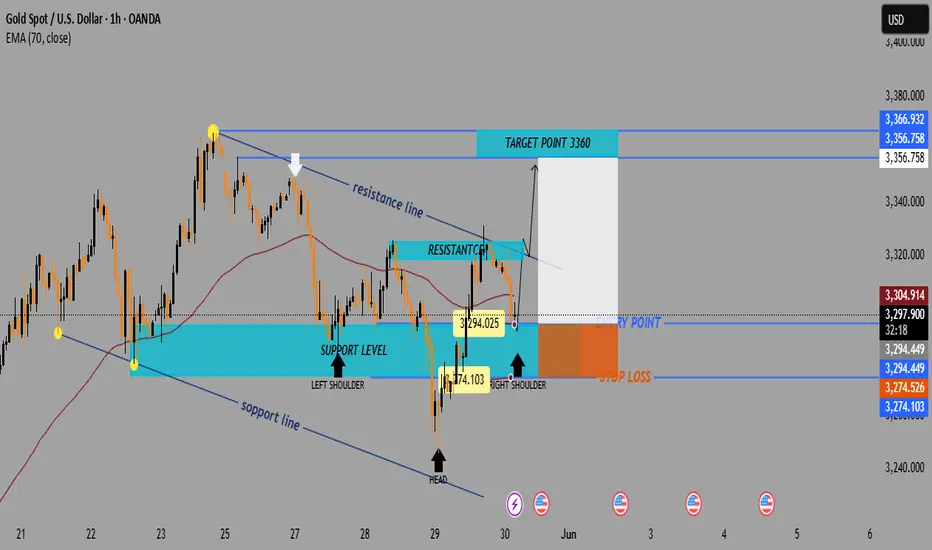
Gold (XAU/USD) – Inverse Head & Shoulders Breakout Setup🧠 Chart Pattern Identified: Inverse Head & Shoulders
🟡 Left Shoulder ➡️ Formed at a local dip.
⚫ Head ⬇️ Deepest low around 3,274.103.
🟡 Right Shoulder ➡️ Bouncing near the same zone.
🔁 This is a classic bullish reversal pattern — a break above the neckline could signal a strong upside move.
📊 Key Levels & Zones
🔵 Support Zone:
🟦 Area: 3,274 – 3,294
✅ Strong bounce seen here (highlighted by the head and shoulders base)
🔵 Resistance Zone:
📏 Just below 3,305 (marked as neckline)
✋ Price must break this to confirm the reversal
🔵 Target Point:
🎯 3360 📈
📏 Based on the height from head to neckline
🔵 Stop Loss Zone:
❌ 3,274.526
🔻 Below the head for safe risk control
⚙️ Trading Setup Summary
🔹 📍 Entry Point:
📌 Around 3,294.449
🚪 Enter on breakout above neckline
🔹 🎯 Target Point:
🏁 3360
🔹 🛑 Stop Loss:
🚫 3,274.526
🔹 Risk-Reward Setup:
🔍 Targeting a move of ~65 points
⚖️ Risk of ~20 points → solid R/R ratio
📈 Indicator:
🧮 EMA 70 ➡️ 3,305.005
⏳ Price currently testing it — a break above EMA would boost bullish confirmation.
📅 Economic Events:
📆 Multiple event icons suggest upcoming news — expect volatility!
⚠️ Be cautious during these times.
✅ Final Thoughts:
📊 Pattern suggests a bullish breakout is near 🚀
🔒 Use stop-loss and enter after breakout to manage risk effectively
🎯 Keep an eye on volume during breakout — it confirms strength
Here's a weekly buy-side analysis🟢 Bias: Bullish (Buy)
Gold remains in a long-term uptrend, with fundamental and technical factors supporting continued upside.
50 & 100 EMA: Price is well above both EMAs, confirming bullish momentum.
RSI: Around 60–70 on the weekly; no bearish divergence yet.
MACD: Histogram ticking upward with bullish crossover in play.⚠️ Risk Factors
Sudden USD strength due to surprise Fed hawkishness.
Strong U.S. labor or inflation data that pushes bond yields higher.
Gold profit-taking near ATH could cause sharp but temporary pullbacks.
Bearish Trend Likely on MondayLast week, the U.S. once again carried out a wave of long-short double killing on the issue of tariff suspension 📉. Capitalists successfully carried out capital plundering before the end of last Friday, leading to insufficient bullish momentum at the opening of next week and a possible continued downward trend ⬇️. At the opening on Monday, our primary view is bearish
⚡️⚡️⚡️ XAUUSD ⚡️⚡️⚡️
🚀 Sell@ 3290
🚀 TP 3270 - 3260
🚀 Buy@ 3250 - 3260
🚀 TP 3290 - 3310
XAUUSD Analysis todayHello traders, this is a complete multiple timeframe analysis of this pair. We see could find significant trading opportunities as per analysis upon price action confirmation we may take this trade. Smash the like button if you find value in this analysis and drop a comment if you have any questions or let me know which pair to cover in my next analysis.

5/30 Gold Analysis and Trading SignalsGood morning everyone!
Yesterday, we successfully executed short at 3290 and long at 3250, and also entered the 3316–3328 short zone near the close. All signals were hit, and profits were solid ✅.
📉 Technical Outlook:
The 1-hour chart remains in a clear bearish trend, indicating that this pullback is not yet complete.
Initial support at 3296 is very likely to break
Focus shifts to 3278 support, though it appears technically weak
If price hits 3278, a minor bounce is expected, but it's likely just a retracement, not a reversal
🗞 Fundamental Watch:
The U.S. Consumer Confidence Index will be released during the U.S. session today.
Market reaction is expected to be similar to yesterday’s initial jobless claims — possibly triggering short-term moves, but not changing the broader trend.
📈 Trade Plan for Today:
📉 Sell in the 3316–3328 zone (key resistance)
📈 Buy in the 3238–3221 zone (key support area)
🔁 Scalp/flexible trading zones:
3303 / 3288 / 3276 / 3265 / 3252 / 3238
Stick to proper risk management, and stay alert during U.S. data releases.
Trade with the trend and close the week strong!
Additionally, on the 30-minute chart, gold appears to be forming a potential inverse head and shoulders pattern. If this pattern completes and breaks the neckline successfully, the price may surge toward the 3336–3352 area, or even up to 3360.
For those considering short positions, it’s crucial to control position size and avoid entering too early. Try to wait for price action to reach higher resistance levels before making a move. Don’t worry about missing a perfect entry — even if one trade is missed, it won’t affect your overall profitability for the week.
The market always offers opportunities. Stay calm, stick to your strategy, and remember: consistency and patience lead to long-term success.
