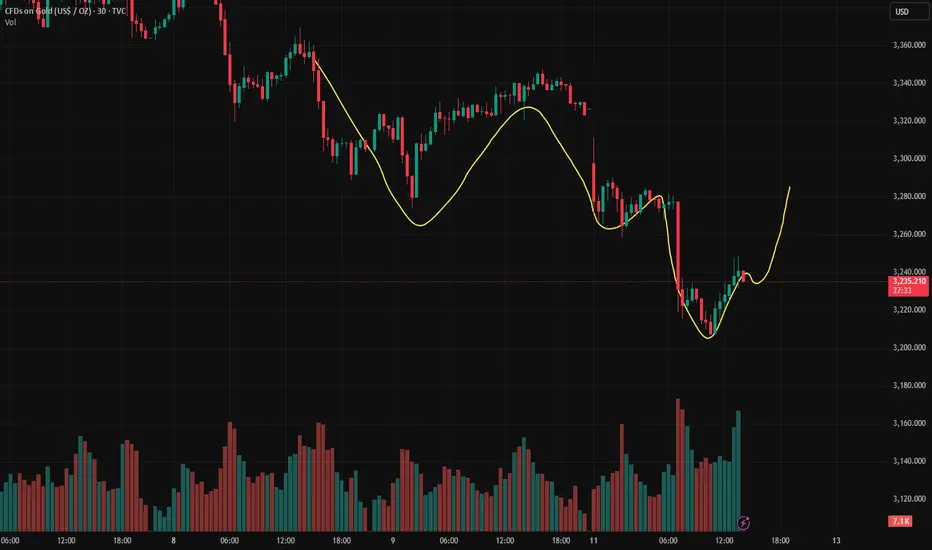
XAUUSD New York market trading strategy.The Russian-Ukrainian war sentiment has once again ignited the market's risk aversion sentiment. After the New York market opened, the US stock market opened higher, causing XAUUSD to fall to around 3200 and then rebound. After the New York market opened, XAUUSD continued to rise to 3248.
After the weekend news continued to be digested in the Asian market and the London market, the New York market once again boosted XAUUSD due to geopolitical news.
At present, we are paying attention to whether the position of 3255-3272 can be effectively broken through and stabilized. If it cannot continue to sell at a high level.
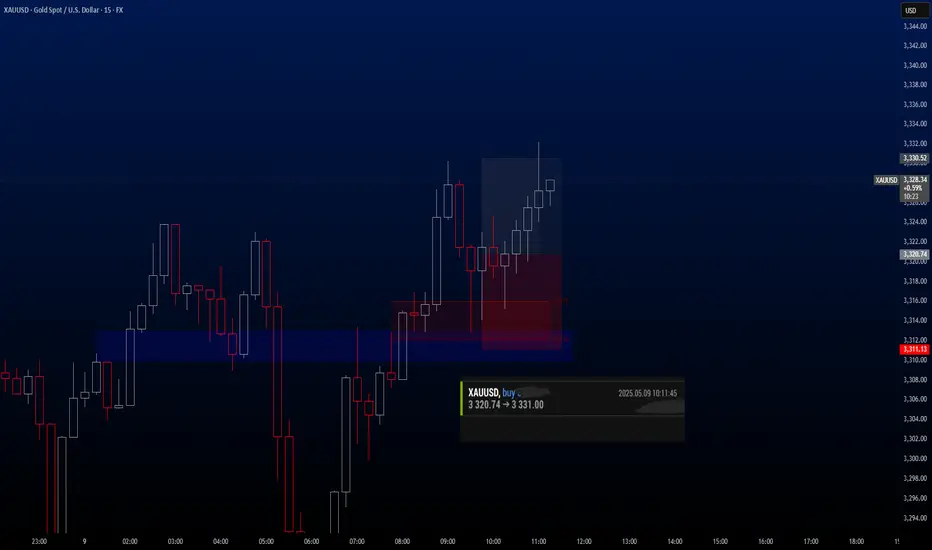
Xauusdbuy
XAUUSD GOLD LONG/BUYBy utilizing Fibonacci retracement levels, historical patterns, , we can formulate a hypothesis that the market might follow a similar trajectory if bullish sentiment prevails.
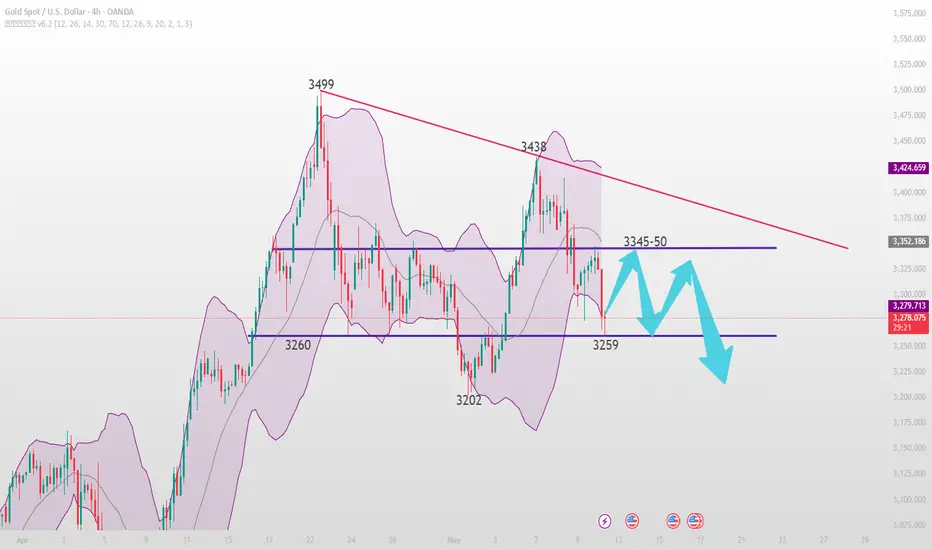
Today's gold trading analysisAffected by the optimistic news about Sino-US trade, spot gold opened sharply lower, and then the price of gold further declined. The current price of gold is around $3266/ounce, a plunge of nearly $60 in the day. Gold fell after being under pressure at the 3350 level last week. Our mid-term short position at 3343 finally ushered in a harvest at the beginning of this week. The market started the gap-down mode. The daily trend of gold is still likely to fall. It is currently an adjustment at the daily level, but the strength of the adjustment is relatively strong! The weekly line of gold fell back and closed lower, forming a double needle top with the upper shadow line of the previous high point, and gapped down to below 3300. The weekly and monthly lines have confirmed the second high, and the K-line pattern has the initial top adjustment. The daily chart has fallen back after a second high, and there is a possibility of forming a double top in some parts. 3500-3438 is the double high, and the neckline is at the 3200 line. If it breaks, a top adjustment structure will be formed.
Gold 4-hour chart forms a step-by-step oscillation and falls back. It is currently approaching the neckline. However, the moving average indicator is in a messy divergence. The short-term will be roundabout and repeated. The overall idea of falling back and adjusting is maintained. The middle track of the Bollinger Band coincides with the rebound high of last Friday, which is the critical point of this week's short position. There is a large gap in the hour, which is not easy to fill in the short term. It will be filled in the process of roundabouts in the market. This morning, gold opened at a low of $3259 and started a rebound trend! At present, the oversold rebound trend will continue today! Gold continues to rebound, and the support below is focused on the $3260 line. Today, relying on this support, we can rebound. The top can look at the $3300 and $3320 lines! On the whole, today's short-term operation strategy for gold is to focus on long positions on pullbacks and short positions on rebounds. The short-term focus on the upper side is the 3320-3330 line of resistance, and the short-term focus on the lower side is the 3259-3260 line of support.
Short order strategy:
Strategy 1: When gold rebounds around 3320-3325, short (buy short) 20% of the position in batches, stop loss 10 points, target around 3300-3280, break the position and look at 3260
Long order strategy:
Strategy 2: When gold falls back to around 3258-3260, buy long positions in batches (buy up) with 20% of the position, stop loss 10 points, target around 3290-3310, break the position and look at 3330
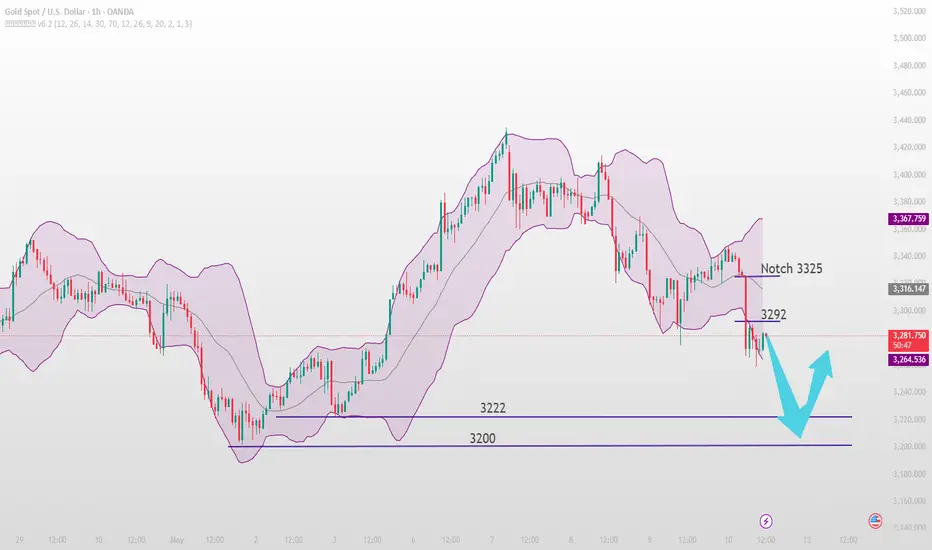
Gold opens low, beware of gap filling!Today, under the influence of various negative news over the weekend, gold opened sharply lower and directly broke through 3300, reaching a low of 3259. The most important point is that China and the United States have agreed to establish a trade consultation mechanism, and will finalize the relevant details as soon as possible. A joint statement reached at the talks will be issued on May 12, which is considered to be substantial progress.
This round of gold surge was caused by the trade war. Before April, the rise of gold was strictly based on the technical aspects, which was relatively easy to grasp. The rise and fall of the technology was more reliable, and the technical trend was more regular. In April, gold prices rose sharply due to the tariff war, and the market started to rise and fall sharply, mainly driven by news factors. The large amplitude and many opportunities also increased the risks. It was not so easy to grasp, and it was easy to make money and lose money. This is the coexistence of risks and profits.
Last week, gold failed to reach a high for the second time and fell sharply. The short-term trend turned bearish, but it is still bullish in the medium and long term. On the one hand, geopolitical conflicts have not decreased under the great changes that have not been seen in a century, trade frictions are still there, and the global economy is at risk of recession; on the other hand, the credit of the US dollar has declined, and the US Reserve has entered a cycle of interest rate cuts. Amid various risk aversion sentiments and capital seeking profits, gold is still a very good and trustworthy variety.
The current decline is just an adjustment to the previous crazy rise in gold. This year, the gold price rose from 2600-3500 to 900 US dollars in just four months, and it was only 800 US dollars in the whole of last year. Capital's short-term profit flight is also part of the reason. If the increase is too high, the callback range must be large. The daily and weekly lines deviate seriously from the short-term moving average and the 100-day moving average, so gold may fluctuate widely at a high level in the future. Wait until the market adjustment is over, and the next interest rate cut by the US Reserve is an opportunity
Today, gold opened sharply lower. Pay attention to the gap filling. The low level in the morning fluctuated sideways. Pay attention to the rebound strength in the afternoon. The upper pressure is 3290-3292.
According to the previous operating rhythm, the European session rebounded after falling in the morning. If the European session rebounded to fill the gap, it would rely on the 3320-3325 pressure to go short, and then gold would be a volatile market.
If the European session did not fill the gap, but was suppressed below 3292 and fell, then the rebound could be shorted for the second time. If the European session broke the low and fell and weakened, gold would continue to be bearish, and the support below was 3222-3200.
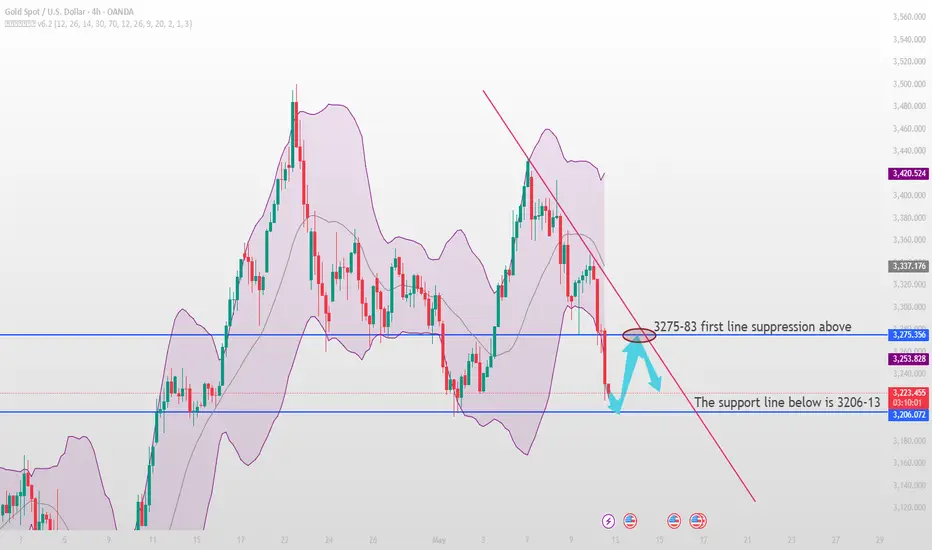
High-level strong pressure rebound continues to shortSince the opening gap at 3275, gold rebounded to 3292 and then started to fall. So far, gold has hit 3216 and then fluctuated upward. The bulls are temporarily suppressed. We still focus on rebounding and shorting. After all, the general trend is bearish. The upper 32775-3281 is the main short-term suppression level. If the rebound does not break, you can continue to short. The short position may continue to reach a new low. Pay attention to the support of 3200.
Judging from the current gold trend, the support at 3206-3215 is the focus below, and the short-term resistance at 3275-81 is the focus above. The strong resistance is near 3290-3300. This position is also the watershed between long and short positions. Before the daily level breaks through and stands on this position, the main short rhythm of the pullback will continue to remain unchanged.
Gold operation strategy:
1. Short gold at 3275-83 when it rebounds, short at 3290-95 when it rebounds, stop loss at 3303, target at 3206-3215, continue to hold if it breaks
GOLD ON REVERSE#XAUUSD ok reverse based on US-CHINA talk price was bearish but now possible reverse needs to occur before another selling.
Above the rectangle at 3224-3230 we await price to close on M30-H1 there to buy. TP 3258-3278.
above 3278 have bearish retracment, below 3205 will go full bearish.

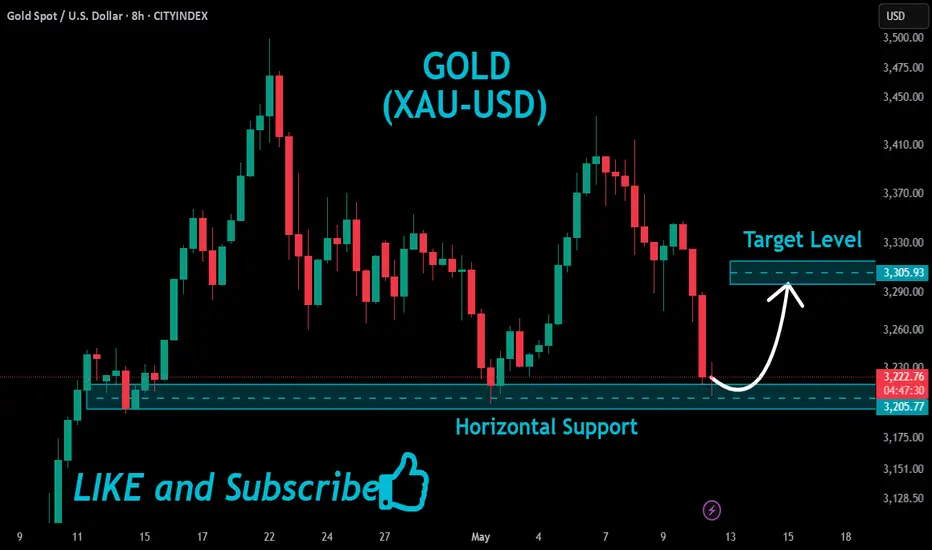
GOLD Swing Long!
HI,Traders !
GOLD has made a retest
Of the horizontal support
Of 3205.77 and we are already
Seeing a bullish rebound
From where we will be
Expecting further move up !
Comment and subscribe to help us grow !
Could India-Pak ceasefire & China-US talks trigger gold's declinNews
From May 5th to 9th, trade tensions and geopolitical conflicts have driven the gold market to rise 📈. The spot gold price has once broken through 3,438. As the bullish momentum has waned, investors have taken profits at high levels, and the weekly increase has narrowed to about 3.1%. Trump's remarks on tariffs, uncertainties in trade negotiations, the conflict between Russia and Ukraine, and the military standoff between India and Pakistan have stimulated the demand for safe-haven assets, pushing up the gold price 💹. Technical indicators show that the short-term correction pressure has increased, and the market may enter a phase of volatile consolidation 🤔.
Gold Trend
At the beginning of this week, influenced by the safe-haven property of gold, its price has increased. However, this tariff news has less of an impact on the gold price than before, and the upward trend has stopped at 3,439. After the Federal Reserve maintained its interest rate policy unchanged, the gold price has declined for two consecutive days 📉, and yesterday's closing price was above 3,300.
Looking ahead, with the ceasefire of the conflict between India and Pakistan and the advancement of the China-US talks, the gold price is likely to drop significantly next week ⬇️. The ceasefire between India and Pakistan has alleviated the geopolitical tensions, weakening the driving force for gold to rise as a safe-haven asset. If the China-US talks achieve positive results, the market's risk appetite will increase, and investors are likely to shift their funds from gold to risky assets such as stocks. In the past, when there has been progress in trade negotiations, the gold price has dropped significantly. Overall, there is an obvious downward trend for the gold price next week 😟.
⚡️⚡️⚡️ XAUUSD ⚡️⚡️⚡️
🚀 Sell@3330
🚀 TP 3280 - 3260
Accurate signals are updated every day 📈 If you encounter any problems during trading, these signals can serve as your reliable guide 🧭 Feel free to refer to them! I sincerely hope they'll be of great help to you 🌟 👇

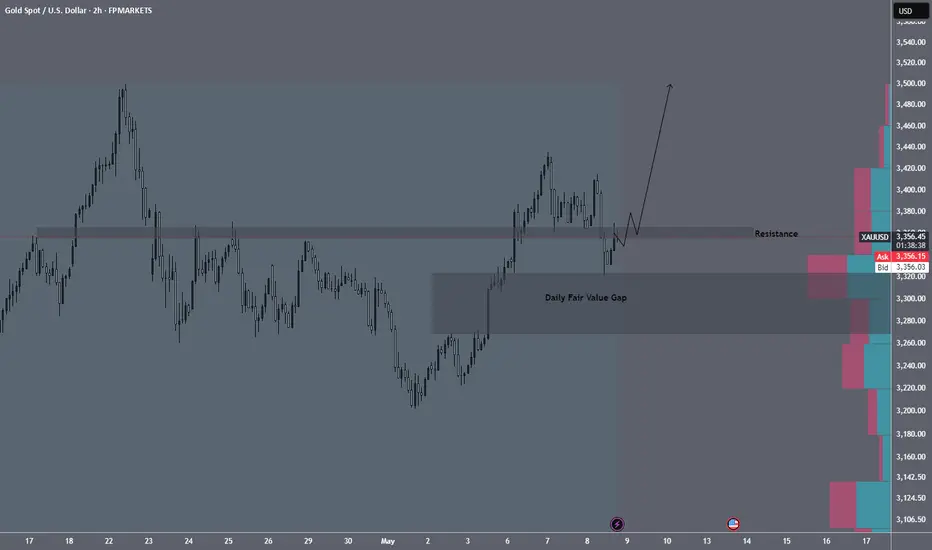
Is GOLD still rising star? XAUUSD AnalysisHello everyone!
i Want share my idea about gold price action.
End of April we had some correction but beginning of May it still has buyer and why? at global market we see still misunderstanding, America and China still talk about rates, final talk will be soon between that to giant country, Russia-Ukraine war plus we have very hard situation between India and Pakistan, everyone was expecting peace, after trump inauguration, but how we see we are still far, no one knows what will be next and for big investors gold is safest place to invest money. If we look at gold for long term we can see it has pretty strong bull run.
For me i have other view - China and America will deal about rates, which will give market better view, i think before it will happen, Gold will test new High, where it will find sellers and from there we will have 2 quarter Bearish trend. New high will be between 3500 - 3550, also if we look at Dollar index (DXY) at 1D chart it found buyers and slowly showing reversal, but don't forget 1W chart because there we had 1W consolidation from 2023 and the last fall was stronger than other falls, at technical it tested weekly Fair Value Gap, but i cant see any reason yet for fall.
I think Gold will show us new high which will be between 3500 - 3550 and then we will get bearish trend and we will see correlation with dollar and dollar will start bullish trend.
With technical i will use simple technic, gold tested today daily fair value gap and it got strong reaction, we have resistance + 2h FVG but for me it will be not hard for gold to brake it.
This analysis is from my experience, i am not financial advisor.
FOR COLLABORATION TEXT ME !
ALWAYS MAKE YOUR OWN RESEARCH !
Rebound or reversal? Analysis of gold trend on Monday🗞News side:
1. The India-Pakistan conflict escalates again
2. The progress of China-US negotiations
📈Technical aspects:
On Friday, we judged that the gold price trend may form a "head and shoulders bottom" pattern. Technically, the key support level below is still focused on the 3270 line, while the 3450 level above constitutes a significant double-top structure resistance level. At the daily level, the recent K-line combination has completed a deep retracement from the 3500 mark with two long negative lines, directly breaking through the important support platform. The K-line on the current day continues to adjust with a shadow line, and the oscillating rhythm of alternating yin and yang is in line with the characteristics of technical corrections. At the beginning of the week, it is recommended to maintain the operation idea of high altitude, low and long
1.🎁BUY 3320-3325, SL 3312, TP 3360-3380
2.🎁SELL 3355-3360, SL 3368, TP 3320-3300
If you agree with this view, or have a better idea, please leave a message in the comment area. I look forward to hearing different voices.
OANDA:XAUUSD FX:XAUUSD TVC:GOLD FXOPEN:XAUUSD FOREXCOM:XAUUSD

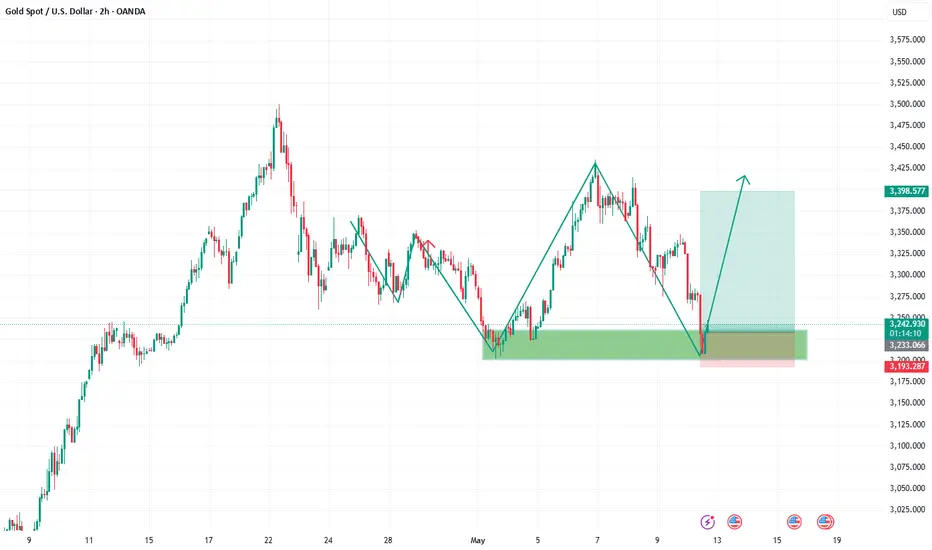
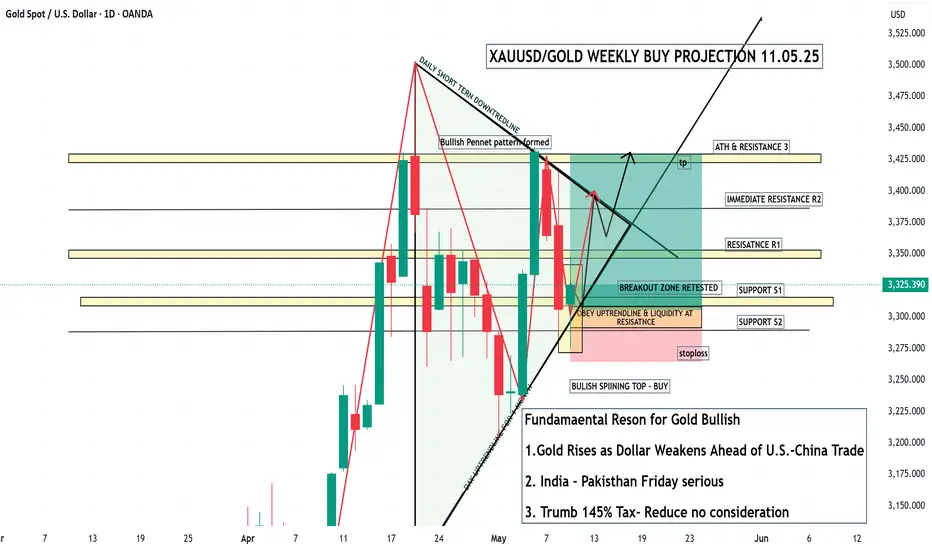
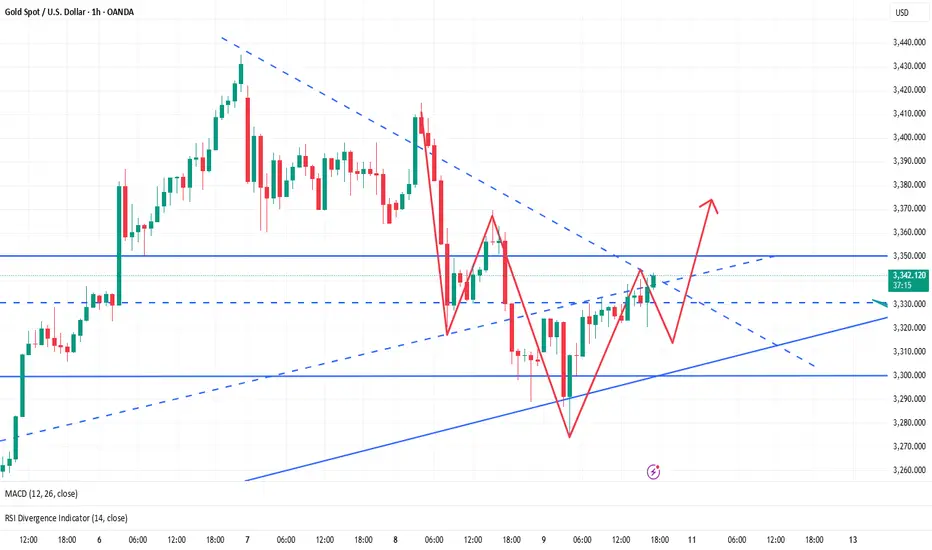
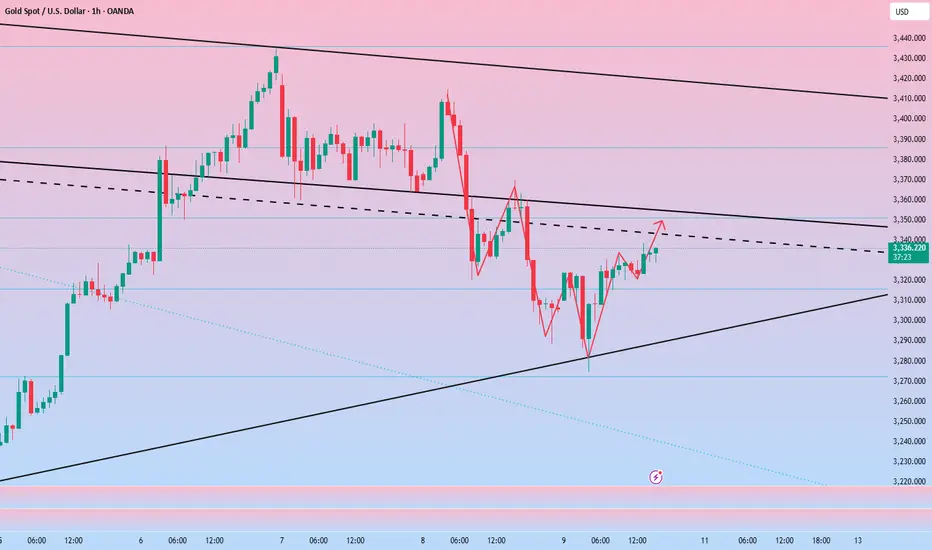
XAUUSD/GOLD WEEKLY BUY PROJECTION 11.05.25Pattern: A bullish pennant pattern has formed, signaling a potential upward continuation.
Breakout Confirmation: Price has broken the daily short-term downtrend line and is retesting the breakout zone, which suggests potential for a strong upward move.
Support & Resistance Zones:
Support Levels: S1 (≈ 3325), S2 (~3270)
Resistance Levels: R1 (~3350), R2 (~3375), ATH & Resistance 3 (~3425)
Entry Zone: Price is in a buy zone, reinforced by a bullish spinning top candlestick and alignment with an uptrend line.
Stop Loss: Placed just below Support S2 (~3270)
Take Profit (tp): Near ATH zone (~3425)
5/9 Gold Trading SignalsLong time no see, my friends! My holiday trip is about to end. I attended two weddings during this trip, which was unforgettable! I hope that everything goes well for everyone during my absence!
Gold has risen recently and returned to above 3400 again. Although it has fallen back in the past two days, the current technical level shows that the bulls are not over yet! This means that if there are friends who buy at high prices, they will have a chance to get out of trouble without doing other operations!
From the current pattern, it is in the stage of triangle consolidation. It is necessary to pay attention to the resistance of the 3360-3382 range. If the price falls under pressure at this position, we need to observe the support of the 3300-3280 range to determine whether it can form a short-term double bottom pattern or a head and shoulders bottom pattern again, so as to support the bulls to run again.
Based on the above analysis, today's trading suggestions:
Sell in the 3364-3386 range
Buy in the 3318-3302 range
Flexible trading in the 3323-3362 range

Gold head and shoulders bottom trend, bull market strong?🗞News side:
1. Tariffs push up inflation and slow down the economy, and the Federal Reserve may be in trouble
2. The situation between India and Pakistan escalates again
📈Technical aspects:
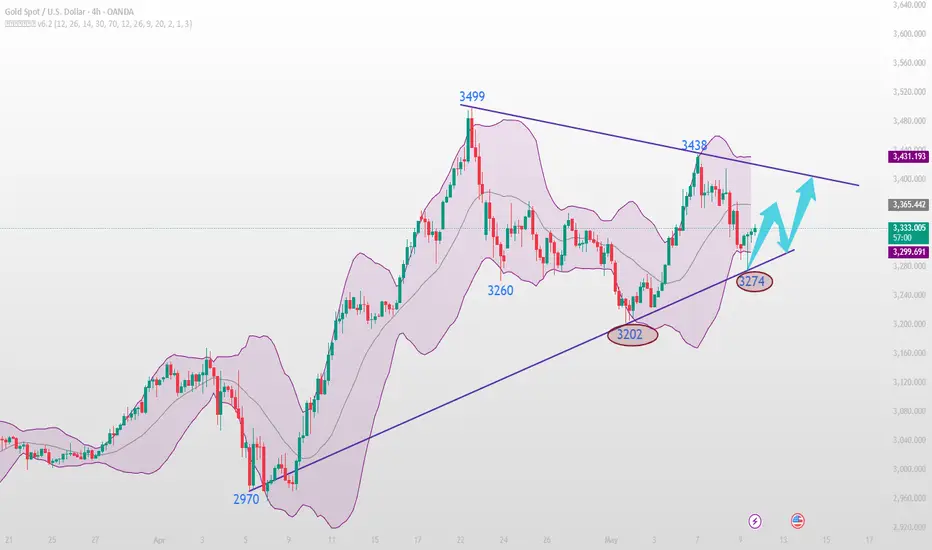
At the hourly level, today's Asian session continued the "wash-out" operation characteristics, quickly rising by 20 US dollars at the opening, and then stepped back to 3310 to confirm the top and bottom conversion support level. The two positive lines seemed to form a "yang-enclosing-yin" upward attack pattern, but suddenly reversed, not only breaking the trend support line of 3280, but also falling to 3274 before bottoming out and rebounding. This erratic trend has a significant long-short double kill effect for investors accustomed to trend continuation strategies. However, we can accurately find the right position in the market to trade and make profits.
At present, it is expected to form a "head and shoulders bottom" pattern from a morphological perspective, accumulating momentum for subsequent rises, and there is still room for upside in the short term. At present, any pullback is an opportunity for us to go long. Pay attention to the 3360-3370 line suppression on the top. If this resistance area is broken, it may open up a new round of upward space.
TVC:GOLD FOREXCOM:XAUUSD FXOPEN:XAUUSD TVC:GOLD FX:XAUUSD OANDA:XAUUSD
Start buying goldTechnical aspects:
Gold has bottomed out and rebounded after a rapid decline today. It has now stood above 3330. When gold breaks above 3330, it has to some extent broken away from the technical repair structure and began to tend to a bullish pattern in terms of form. Although gold is currently under pressure in the 3350-3360 area, as the center of gravity of gold moves up, the support below has gradually moved up to the 3325-3315 area. So I think there is still room for gold to rise, and it may continue to rebound to the 3345-3365 area.
Trading strategy: Consider going long on gold in the 3330-3320 area, TP: 3345-3365
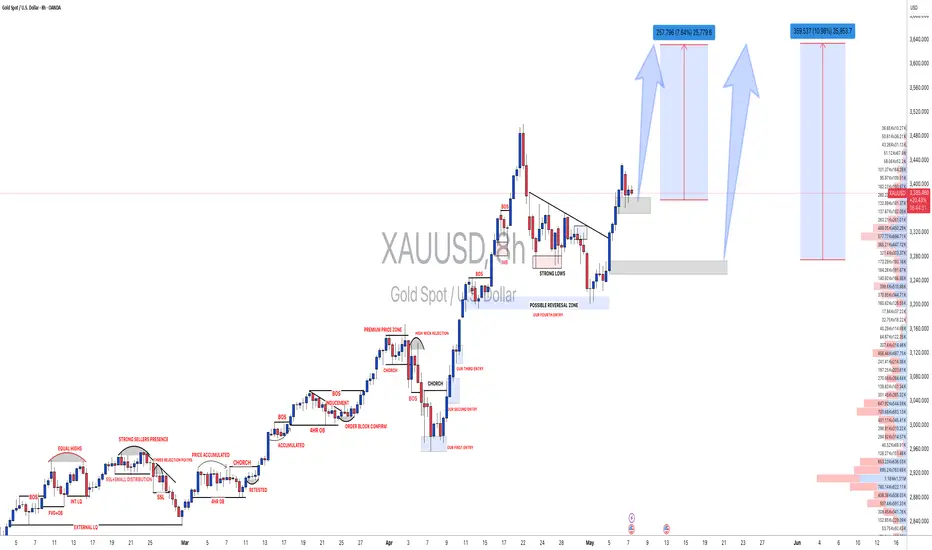
#XAUUSD: Price to go beyond $3650 to $3700 around 3500 pips moveThe XAUUSD price is moving nicely as we had predicted in our previous analysis. Both of our analyses have hit the take-profit target, and we are likely to see more bullish momentum continue in the coming time. There are two areas where price could move or reverse. Both targets have a long-term view, which means we are talking about a possible swing move that will take time to complete. Stop-loss and intraday target and position can be taken based on your own analysis and overview. Strong fundamentals are needed for price to reach our designated target area.
Good luck and trade safely. Trading financial instruments like gold and other markets brings extreme risk and can be severe if the risk is not managed correctly.
We are sharing our bias here, but it does not guarantee that the move will happen as described.
Once the trade is activated, you can set two targets. You can choose your own take-profit based on your analysis and trade management.
Good luck and trade safely! 😊
Thanks a bunch for your unwavering support! ❤️🚀
If you’re feeling generous, here are a few ways you can help us out:
- Like our ideas
- Comment on our ideas
- Share our ideas
Cheers,
Team Setupsfx_
❤️🚀
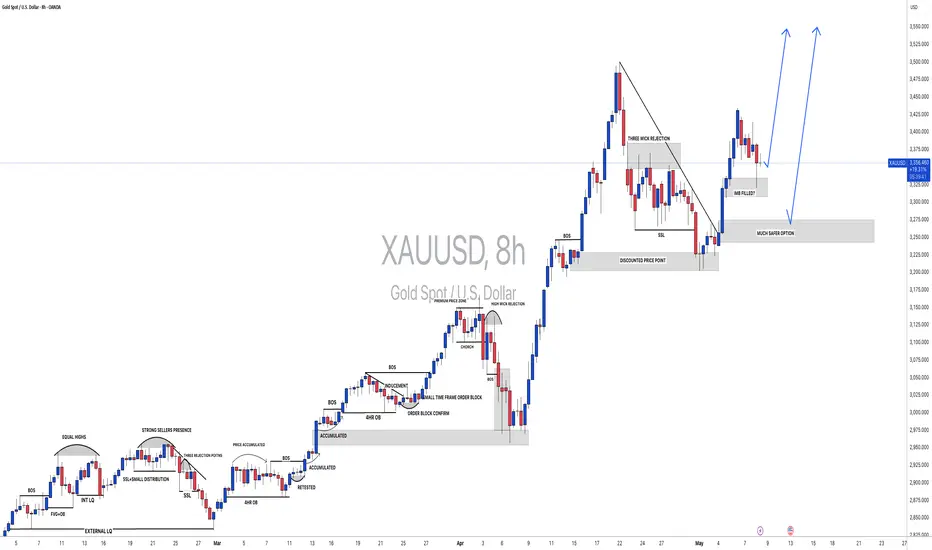
#XAUUSD: Gold to continue rising,$4000 by end of the year targetGold has unexpectedly declined to 3335 in response to the anticipated price increase following the unfolding conflict in Asia. Currently, two regions exhibit price reversals.
The XAUUSD price is progressing in accordance with our previous analysis. Both analyses have successfully reached the take-profit target, and we anticipate further bullish momentum in the near future. However, price movement is subject to potential reversals in two areas. Both targets are long-term oriented, indicating potential swing moves that may take time to complete. Stop-loss, intraday target, and position decisions should be based on individual analysis and overall market assessment. Strong fundamentals are essential for price to reach the designated target area.
We acknowledge our bias in this analysis, but it does not guarantee the realisation of the described outcome.
Upon trade activation, you can establish two targets. You have the flexibility to select your own take-profit based on your analysis and trade management strategies.
We appreciate your unwavering support.
For those who wish to contribute, we offer several avenues for assistance:
- Liking our ideas
- Commenting on our ideas
- Sharing our ideas
Thank you for your continued support.
If you feel inclined, we would be grateful for your generosity.
Best regards,
Team Setupsfx_❤️🚀
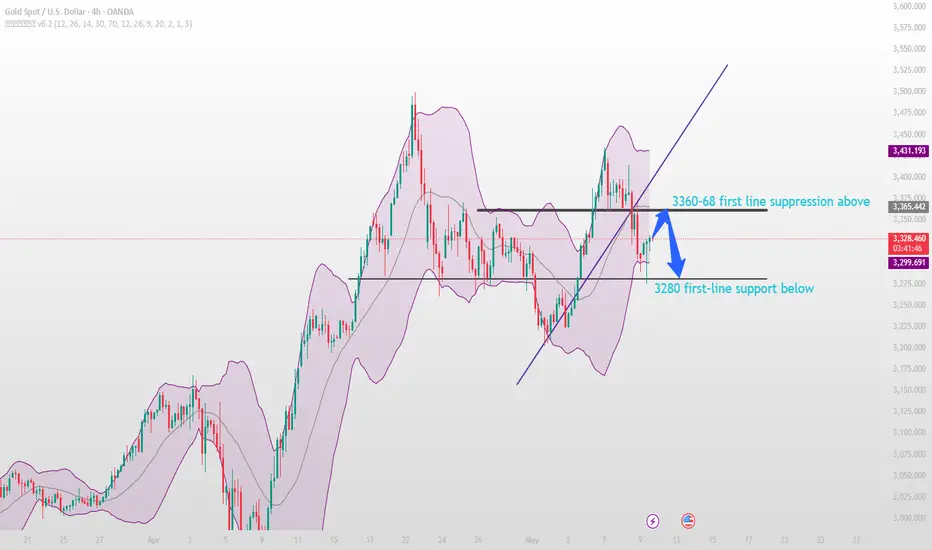
How to trade gold trendsTechnical analysis of gold: From a technical perspective, the overall framework of gold's rise has not changed. I said before that from a macro level, the conditions for breaking highs have been met, but in the short term, it will go back and forth several times before it can go up. If there is no adjustment, no washing, no horizontality, no shock, and the foundation is not solid, even if it goes up, it will come down quickly. If you want a solid rise, then give the market more patience. Today, gold is running around the bottoming out and rebounding pattern. After a sharp drop in the early trading, it quickly recovered the lost ground, and the signal has been released: the current key support reference is around 3280, and the upward movement needs to break through and stabilize the key dividing point of 3330. In the early trading, it fell back under pressure at 3330. Only when the entity stands firmly at this position can the breakthrough pattern of yesterday be reproduced. If the Asian and European sessions can close above 3330 steadily, the European and American sessions can directly see the new high of 3360/3370 area.
For today's market, I think it will still fluctuate upward, and will adjust and fluctuate at the current relatively low level for a period of time! If there are friends who are ready to get on the train today, then 3280 or below can be done in batches step by step. After the hourly line cycle opened the decline of 3324 and broke, today's market was not weak, and there was further upward continuation. I also said that the recent market cannot chase the rise and kill the fall. On the whole, it is still a wide range of shocks. Washing the market trend should be a violent roller coaster before the subsequent surge. The European market relies on the low point of 3310 as a defense. In the short term, continue to open more and look up, pay attention to 3350/3360. At that time, a new round of band rise will emerge, and this should be paid attention to! So I said that based on the general trend, short-term corrections are opportunities! On the whole, today's short-term operation strategy for gold is to focus on long positions on corrections and short positions on rebounds. The short-term focus on the upper side is the 3360-3370 line of resistance, and the short-term focus on the lower side is the 3280-3290 line of support.
Short order strategy:
Strategy 1: When gold rebounds around 3360-3365, short (buy short) 20% of the position in batches, stop loss 10 points, target around 3330-3320, break the position and look at 3310
Long order strategy:
Strategy 2: When gold falls back to around 3312-3315, buy long positions in batches (buy up) of 20% of the position, stop loss 10 points, target around 3330-3350, break the position and look at 3360
Gold 100% Profit SignalYesterday, gold surged and then fell. It was under pressure at 3415 in the early Asian session, and short orders were entered at 3413.6. After rebounding to 3369 in the European session, it was under pressure again, and short orders followed up at 3368.5. The overall trend continued to be extremely weak, breaking 3300 in the late trading and accelerating to 3288. It rebounded to above 3300 in the early morning, and the daily line closed with a long lower shadow positive line, indicating that short-term support is effective, but the rebound momentum is suppressed by the previous wave trend. The current gold price is fluctuating in the 3300-3348 range, with upper resistance of 3348-3352. If it breaks through, be alert to a second surge to 3365; the lower support is 3295-3303. If it loses or falls back to the 3275-3255 area. Trading needs to keep a close eye on the dynamics of key positions.
Operation strategy:
1. It is recommended to short gold when it rebounds to 3340-3345, with a stop loss at 3353 and a target of 3320-3300
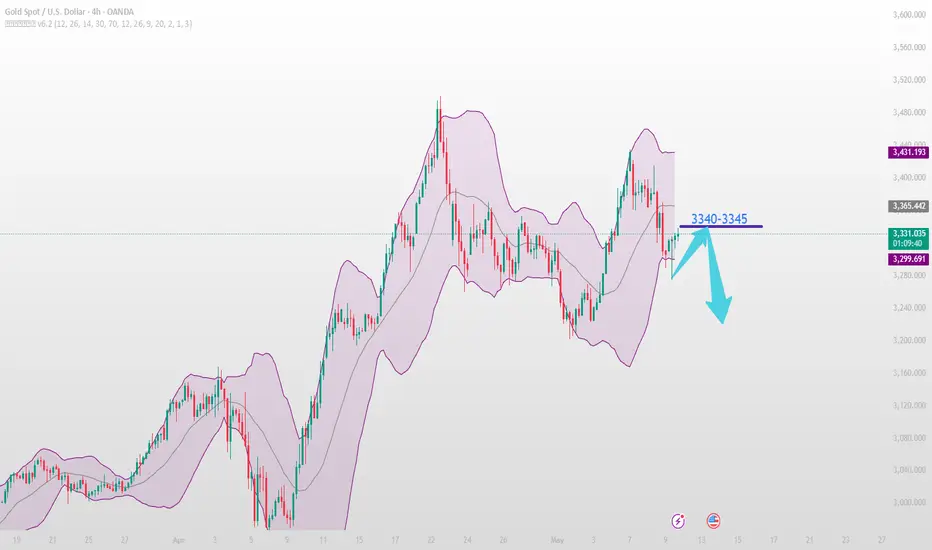
Gold market operation strategyYesterday, gold surged and then fell. It was under pressure at 3415 in the early Asian session, and short orders were entered at 3413.6. After rebounding to 3369 in the European session, it was under pressure again, and short orders followed up at 3368.5. The overall trend continued to be extremely weak, breaking 3300 in the late trading and accelerating to 3288. It rebounded to above 3300 in the early morning, and the daily line closed with a long lower shadow positive line, indicating that short-term support is effective, but the rebound momentum is suppressed by the previous band trend. The current gold price is fluctuating in the 3300-3348 range, with upper resistance of 3348-3352. If it breaks through, be alert to a second surge to 3365; the lower support is 3295-3303. If it loses or falls back to the 3275-3255 area. Trading needs to keep a close eye on the dynamics of key positions.
Operation strategy:
1. It is recommended to short gold when it rebounds to 3340-3345 area, with a stop loss at 3353 and a target of 3320-3300.
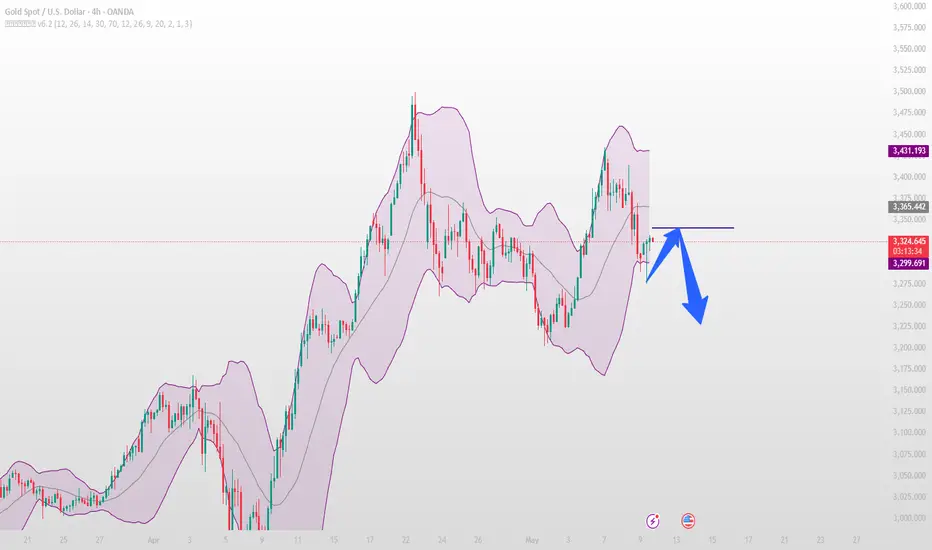
High pressure rebound continues to shortThe hourly moving average of gold has begun to turn downward, and the strength of gold bulls has been suppressed. After the US market rose yesterday, gold fell as expected, hitting the highest point of 3369. We also notified in real time that short orders can be entered at the 3360-65 line, and profit can be taken at the 3340 line. However, if gold rebounds too much, then gold will still fluctuate in a large range. However, if gold rebounds and does not even break through the 3336-40 line, then the strength of gold bulls will not be strong, and gold may enter a short trend. The US gold rebound is under pressure from the 3336-40 line. Continue to sell short at highs
From the 4-hour analysis, the support below is around 3280. If it falls back and does not break, the main bullish trend remains unchanged. Pay attention to the short-term suppression of 3334-40 above. The daily level maintains a high-altitude low-multiple rhythm.
Gold operation strategy:
1. Short gold at 3334-40 when it rebounds, short at 3358-65 when it rebounds, stop loss at 3373, target at 3300-3308, continue to hold if it breaks
XAUUSD Take ProfitThe gold trade I just shared delivered great profit and helped me hit my daily profit target in a single trade :)
So, gold ended up being both the first and last trade of the day.
Tomorrow is the weekend and the FX market will be closed, but as always, the crypto market stays open.
Hopefully, BTC will offer some good opportunities tomorrow :))
Wishing everyone a great weekend!
On May 9, London market BTCUSD real-time trading strategy
Yesterday, it was suggested to buy BTCUSD in the range of 98500-99500. The target of 102k achieved a good profit growth.
Regarding BTCUSD, the current demand is also rising sharply. For Trump's call for BTCUSD, while XAUUSD falls back, this is a positive boost. At present, more factors are pushing BTCUSD to continue to rise. You can pay attention to the retracement of the band support of 101500-10200, and the upper side needs to pay attention to 104500-106000
To prevent missing out on some good trading strategies and ideas, remember to continue to pay attention to the ideas of the swing trading center. If you want to get more and more accurate signals, you can leave me a message.

XAUUSD’s precise strategy.After the New York market, XAUUSD has seen some huge declines. 60-70 USD/ounce. Perfect decline.
Regarding the decline mentioned yesterday. These two days have perfectly verified this trading logic, falling from 3438 to 3300. It is completely in line with the analysis expectations. Follow the members and also successfully obtain rich profits.
The two important information mentioned yesterday and today, the interest rate decision and Powell's speech. These are the two bombshells in the current XAUUSD market. After the news landed, there was almost no bigger news to promote the rise in gold prices.
Tariffs were implemented again, reducing market tensions.
Many factors have consolidated the position of the US dollar. It has caused XAUUSD to fall under pressure. At the same time, the demand for the cryptocurrency BTCUSD is greater. Today, the London market clearly pointed out the buying point near 99400. Retreat to 98000 and continue to buy. The New York market rose sharply. The highest reached 101.5k, which also reached the expected range.
If you follow the signal and trade independently. There is profit. It's just a matter of how much. In market trading, you should seize the opportunity when you can accumulate profits. Because opportunities are not always there. So you can follow me to make more lucrative profits with such a good market.
