xauusd updateentry price 3288
stop loss update 3289
take profit
3414
3500
3625
hit first target now risk free
Xauusdbuy
XAUUSD Hello traders.
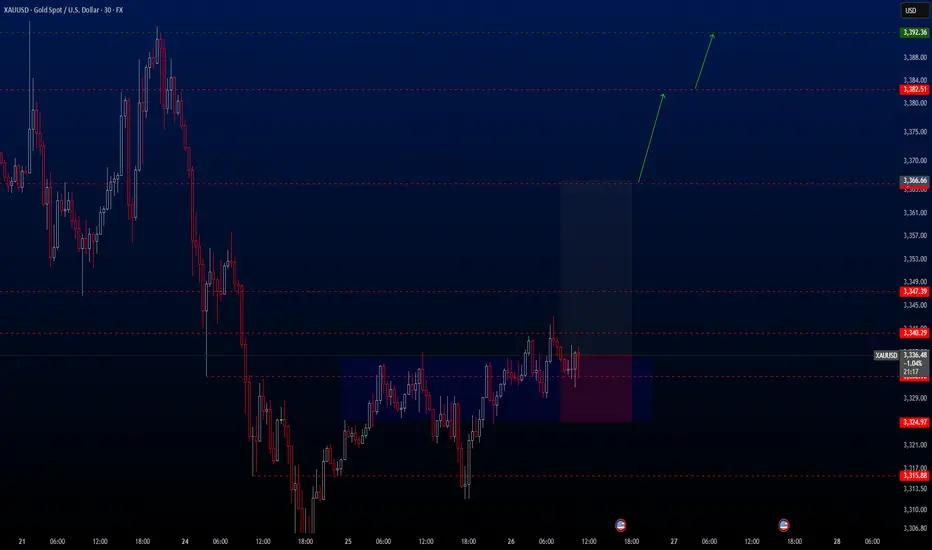
Today’s first trade setup comes from the XAUUSD pair. The pair is currently positioned in an ideal buy zone, and I’ve spotted a potential long opportunity. There are three different take profit levels, all of which are listed below. Personally, I’ll be closing my position at the first TP level: 3366.66.
However, keep in mind that two major economic events will be released today:
📌 Gross Domestic Product (GDP) (QoQ) – Q1
📌 Initial Jobless Claims
These are highly impactful events, so please manage your risk accordingly.
🔍 Trade Details
✔️ Timeframe: 30-Minute
✔️ Risk-to-Reward Ratio: 1:2.5
✔️ Trade Direction: Buy
✔️ Entry Price: 3336.62
✔️ Take Profit: 3366.67 / 3382.51 / 3392.36
✔️ Stop Loss: 3324.97
🕒 If momentum fades or the price consolidates within a tight range, I’ll keep this trade open only until 23:00 (UTC+4). After that, I’ll close it manually—whether in profit or loss—depending on how the price action evolves.
🔔 Disclaimer: This is not financial advice. I’m simply sharing a trade I’ve taken based on my personal trading system, strictly for educational and illustrative purposes.
📌 Interested in a systematic, data-driven trading approach?
💡 Follow the page and turn on notifications to stay updated on future trade setups and advanced market insights.
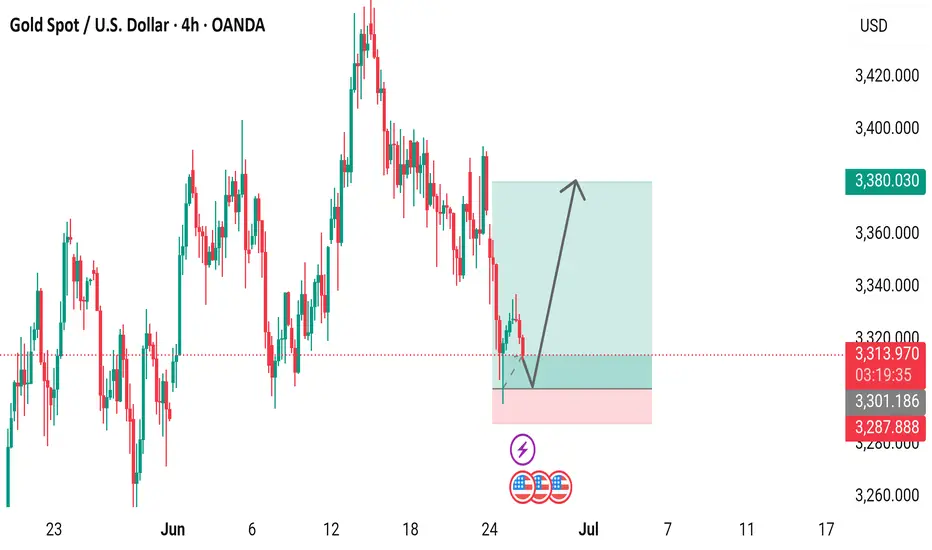
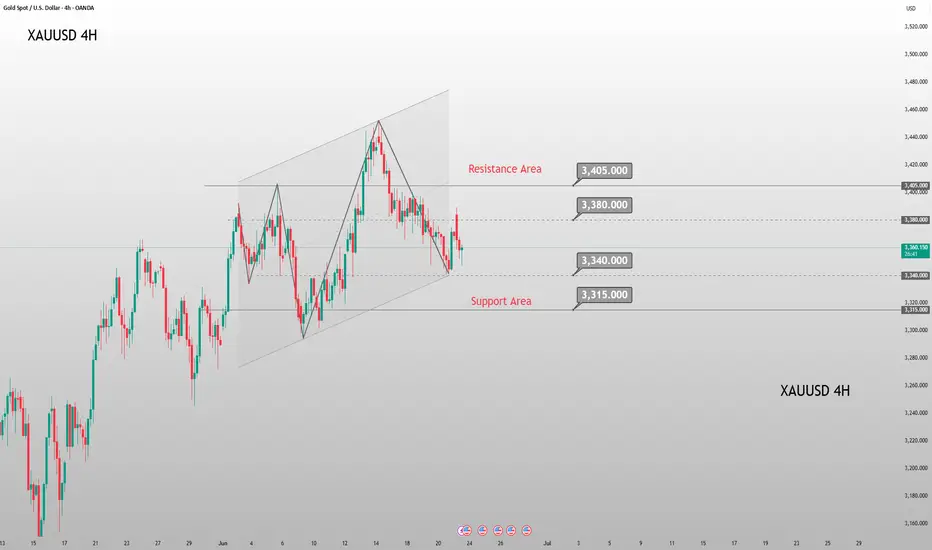
Gold Spot / U.S. Dollar (XAU/USD) 4-Hour Chart Analysis4-hour chart from OANDA shows the recent performance of Gold Spot priced in U.S. Dollars (XAU/USD), with the current price at $3,313.650, reflecting a decrease of $9.800 (-0.29%). The chart highlights a recent upward trend followed by a pullback, with a support zone around $3,301.186 to $3,313.650 and a resistance level near $3,380.030. The inset provides a zoomed-in view of the price action, indicating potential volatility with a lightning bolt symbol and U.S. flags, suggesting significant market movements or news
XAU/USD Bullish Reversal from Key SupportXAU/USD Bullish Reversal from Key Support 📈🟢
📊 Chart Analysis:
Rounded Bottom Structure ⬆️
The price has formed a rounded bottom pattern, indicating potential trend reversal from bearish to bullish.
Multiple bounces (🟠 circles) from the curved support trendline confirm the validity of this structure.
Support Zone Rejection ✅
Price recently rejected from a major horizontal support zone (around 3,303.796 USD) with a strong bullish wick.
This zone has acted as a springboard for prior upward moves.
Falling Wedge Breakout 💥
A falling wedge (bullish pattern) has formed and is breaking to the upside.
Breakout confirmation is underway, indicating momentum shift.
Target Projection 🎯
The projected move from the breakout suggests a potential target at 3,385.820 USD.
This aligns with previous resistance areas.
Key Levels to Watch:
Resistance: 3,385.820 USD (target) and 3,425–3,450 USD (major resistance zone)
Support: 3,303.796 USD (short-term), followed by 3,225–3,250 USD zone
🔔 Conclusion:
Price action suggests a bullish bias with a possible upward continuation if it sustains above the wedge breakout.
Confirmation above 3,330 USD with volume can fuel a rally toward the 3,385–3,400 USD target zone.
📌 Risk Management Tip: Watch for fakeouts near wedge resistance or a re-test of 3,303 USD for better entries.

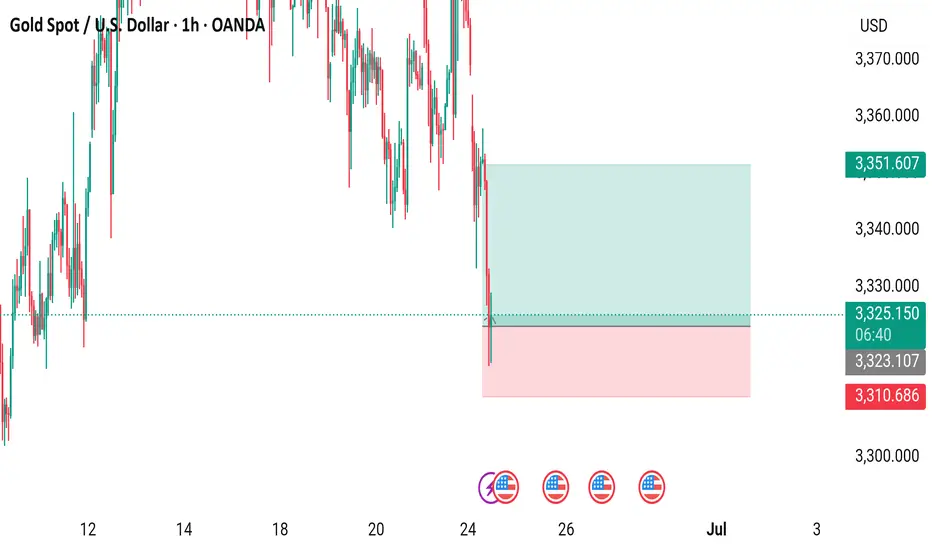
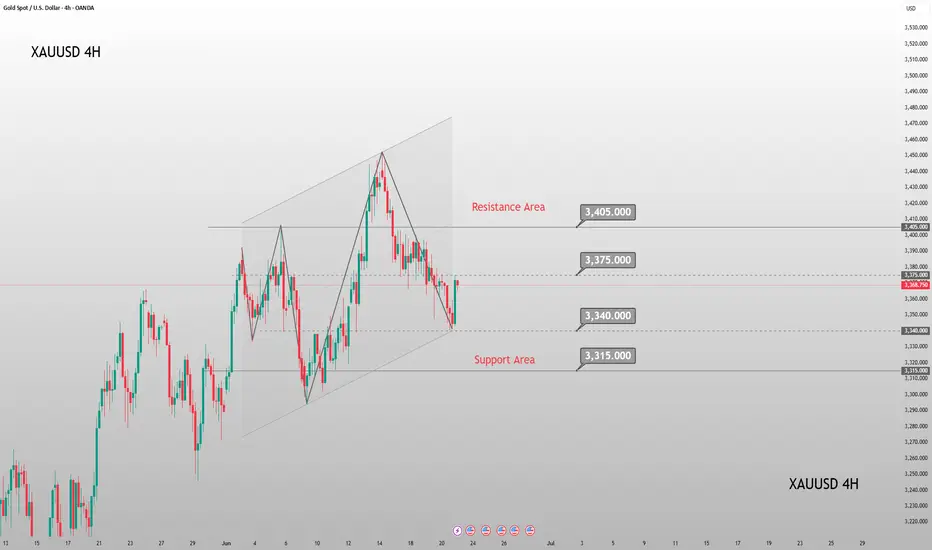
Gold Spot / U.S. Dollar (XAUUSD) 4-Hour Chart - OANDA4-hour candlestick chart from OANDA displays the price movement of Gold Spot (XAUUSD) from late June to early July 2025. The current price is $3,332.245, reflecting a +0.26% increase (+$8.795) as of 07:39 AM CEST on June 25, 2025. The chart highlights a recent price range between $3,320.076 and $3,365.226, with a notable support level around $3,329.934 and resistance near $3,355.226. The chart includes a shaded area indicating a consolidation or trading range.

Gold Trading Analysis and Strategies for Sideways Decline MarketAfter Trump announced a comprehensive ceasefire agreement between Israel and Iran, market risk aversion significantly cooled, and gold prices plunged by more than $30 in early trading. Although the stability of the ceasefire agreement remains doubtful, the rebound in risk appetite has dominated market trends, with stock markets rebounding, oil prices falling, and demand for safe-haven assets declining.
From a technical perspective, the moving average system on the daily chart of gold shows an intertwined state, indicating a relative balance between bulls and bears. The current key resistance above is near 3350, which is an important psychological threshold. If effectively broken, it may open up upward space; the lower support is focused on the 3285-3290 range, which is the lower edge of the May consolidation platform. A break below this level may intensify correction pressure. The loss of the midline in the 4-hour chart further confirms the short-term weak structure, providing technical support for the downward trend.
XAUUSD
sell@3330-3340
tp:3320-3310
buy@3285-3290
tp:3310-3320
Investment itself is not the source of risk; it is only when investment behavior escapes rational control that risks lie in wait. In the trading process, always bear in mind that restraining impulsiveness is the primary criterion for success. I share trading signals daily, and all signals have been accurate without error for a full month. Regardless of your past profits or losses, with my assistance, you have the hope to achieve a breakthrough in your investment.
Gold’s Geopolitical Launchpad: Eyes on $3,500+🟡 GOLD - Macro Fuel Meets Technical Momentum Trade Levels Inside
Gold continues to flex its haven status as geopolitical tensions flare once again—this time triggered by reports of a U.S. airstrike on Iranian nuclear facilities. That headline risk has lit the fuse under precious metals, and the reaction in futures markets has been swift.
Friday’s intraday washout—largely driven by hopes that President Trump would opt for diplomacy—was short-lived. The strong recovery into New York close left a long lower shadow, signaling buyers are already pricing in weekend escalation risk.
💡 Macro View:
- Analysts project a move toward $3,500–$3,700, driven by a twin-engine of geopolitical instability and sticky inflation.
- Central banks are staying long; ETF inflows are ticking up—this isn’t just speculative hype.
- Goldman’s base case: $3,700 EOY, $4,000 by mid-2026. Recession/volatility scenarios stretch targets up to $4,500.
🔧 Technical Setup:
- Bias across all time frames remains bullish. Open float pressure is stacking with long-side conviction.
- Key long trigger zone sits between $3,369–$3,375—I’m watching for confirmation here.
- Profit targets:
- First resistance: $3,440.48
- Second target: $3,500 zone
- Stretch: $3,520+ if volatility expands

Will the 3300 support hold today?Due to the sudden ceasefire agreement between Iran and Israel today, the gold market quickly flipped from bullish to bearish — when gold tested the 3300 support level just now, it rebounded near 3315 📈.
It may challenge the 3290-3300 support range again later: if it effectively breaks below, the next target is the strong support at 3265, and it may eventually dip to 3200 before starting a rebound 🔄.
If the breakout fails, it may consolidate near 3330, waiting for further market guidance 📊
⚡️⚡️⚡️ XAUUSD ⚡️⚡️⚡️
🚀 Sell@3330 - 3320
🚀 TP 3310 - 3305

Gold Spot Price Analysis (4-Hour Chart4-hour candlestick chart for the Gold Spot price in U.S. Dollars (XAU/USD) from June 22 to July 9. The chart shows a downward trend with recent prices around $3,299.48, representing a 2.07% decrease. Technical indicators and annotations suggest potential support and resistance levels, with a highlighted area indicating a possible trading range. The data is sourced from OANDA.

Gold is about to break through 3400! On June 21, 2025 local time, U.S. President Trump announced that the U.S. had launched strikes against three Iranian nuclear facilities—Fordo, Natanz, and Isfahan—using six B-2 stealth bombers 😲. This move marked the formal intervention of the U.S. in the Middle East conflict, prompting the UN Security Council to convene an emergency meeting immediately. This underlies the core logic of our sustained "long gold" strategy last week: the geopolitical situation in the Middle East harbors the risk of escalating at any moment 🤯. If the Security Council fails to roll out direct solutions, gold, as a safe-haven asset, may continue its upward trajectory driven by market panic 📈.
The UN Security Council meeting on June 23, 2025 failed to break the deadlock, and the Middle East situation remains highly fluid. Given that the U.S. is highly unlikely to implement any solutions proposed by the Security Council, the regional crisis may deteriorate further 🚨
Gold is about to break through 3,400! 🌟
Accurate signals are updated every day 📈 If you encounter any problems during trading, these signals can serve as your reliable guide 🧭 Feel free to refer to them! I sincerely hope they'll be of great help to you 🌟 👇
6/24 Gold Analysis and Trading OutlookGood morning, everyone!
Gold closed yesterday with a T-shaped candlestick. Although there was an intraday recovery after briefly breaching the MA20, the closing price remained below the MA5, indicating continued pressure on the upside.
Today’s opening saw a direct drop in price, suggesting a potential break below key support. Two important levels to monitor today:
Whether the closing price stays above 3355
Whether the intraday support at 3328 holds
If 3328 breaks down, the 3300 level may become the next major battleground between bulls and bears.
Driven by geopolitical news, gold has shown sharp volatility over the past two days. While this increases trading risk, it also presents more opportunities. From a technical perspective, today’s strategy should prioritize selling on rebounds, with buying at lower levels as a secondary approach. As always, stay disciplined and manage risk effectively.
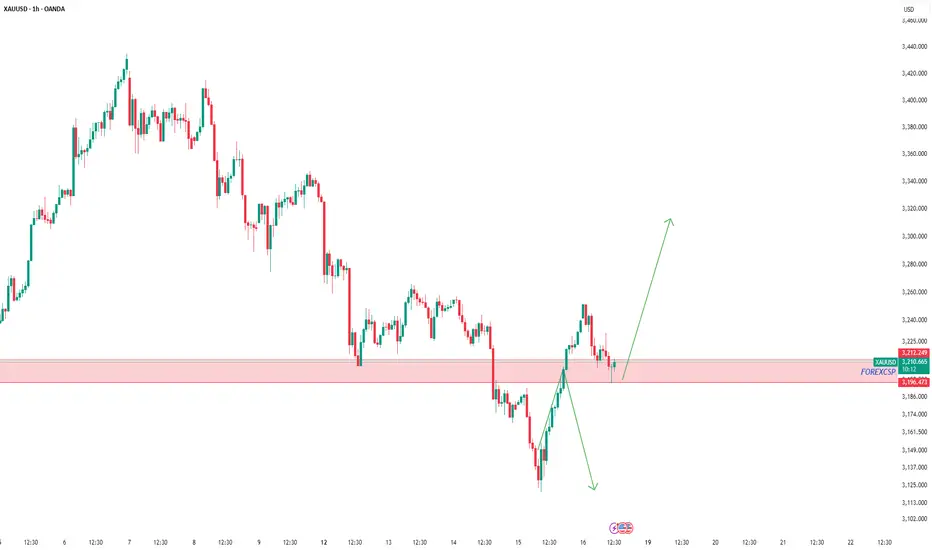
Gold updateAfter the previous level was broken and structure shifted, we’re now entering a new phase of analysis.
In this fresh setup, we’re looking for buy opportunities — but not blindly!
As always, waiting for a clean pullback to the new zone and a solid entry signal.
Experience teaches us: real profits come from patience and planning.
Here’s my new gold analysis — high probability, low risk.
For detailed entry points, trade management, and high-probability setups, follow the channel:
ForexCSP
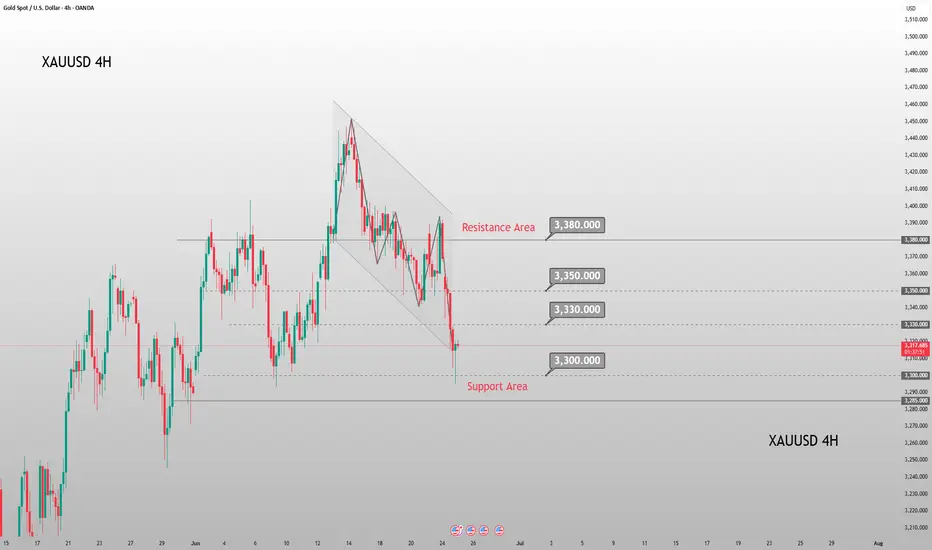
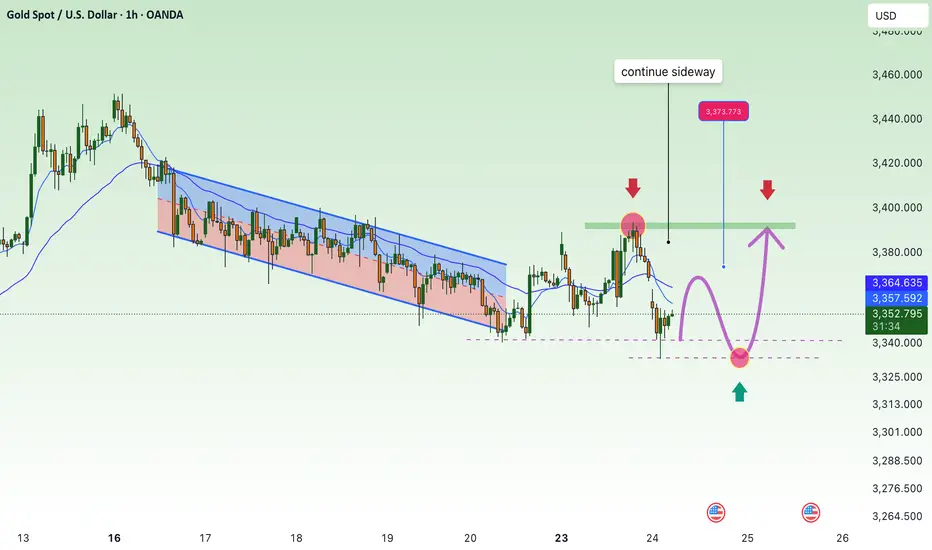
GOLD continue sideway , SELL 3393⭐️GOLDEN INFORMATION:
Gold prices remain well-supported during the North American session following breaking news that Iran has launched retaliatory strikes on US military bases in Qatar. The escalation comes in response to Washington’s weekend assault on Iranian nuclear facilities. As geopolitical tensions in the Middle East dominate headlines, investors have largely sidelined US economic data. At the time of writing, XAU/USD is trading at $3,385, up 0.39%.
Macroeconomic indicators have taken a backseat as heightened conflict drives market sentiment. Citing Israeli media, Al Arabiya reported that Iran targeted US bases in Qatar, Kuwait, and Iraq with missile strikes. In a further escalation, Tehran approved the closure of the strategic Strait of Hormuz and launched additional missiles at Israeli targets—amplifying safe-haven demand for gold.
⭐️Personal comments NOVA:
Gold prices reacted to a decrease in positive news about peace in the Middle East, continuing to accumulate.
⭐️SET UP GOLD PRICE:
🔥SELL GOLD zone: 3392- 3394 SL 3399
TP1: $3382
TP2: $3370
TP3: $3360
🔥BUY GOLD zone: $3319-$3317 SL $3312
TP1: $3327
TP2: $3338
TP3: $3349
⭐️Technical analysis:
Based on technical indicators EMA 34, EMA89 and support resistance areas to set up a reasonable BUY order.
⭐️NOTE:
Note: Nova wishes traders to manage their capital well
- take the number of lots that match your capital
- Takeprofit equal to 4-6% of capital account
- Stoplose equal to 2-3% of capital account
XAUUSD:Go long
The uncertainties in multiple dimensions such as geopolitics, US monetary policy and tariffs have significantly increased, which will bring more volatility to the gold price.
Today's market trend is still mainly volatile. During the Asian session, there has been a deep pullback. 3316 is the short-term support. It is expected that there will be a rebound in the future.
Trading strategy:
BUY@3325-30
TP:3345-50
More detailed strategies and trading will be notified here ↗↗↗
Keep updated, come to "get" ↗↗↗
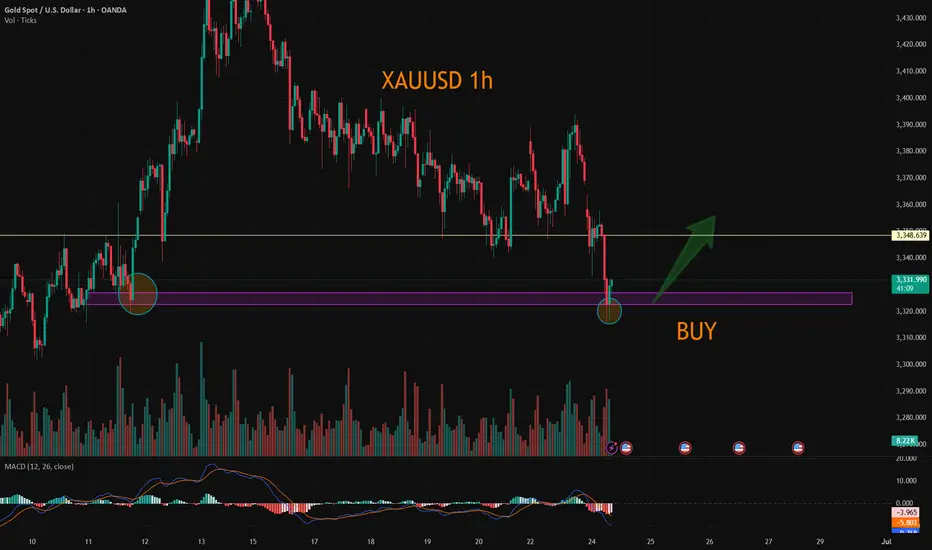
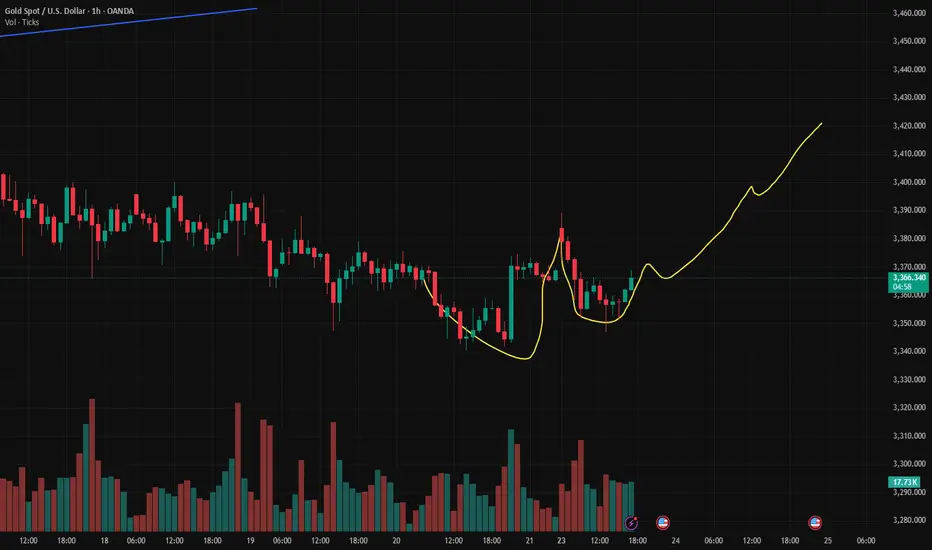
Gold Spot / U.S. Dollar (1h Chart) - OANDA1-hour chart from OANDA shows the price movement of Gold Spot against the U.S. Dollar (XAU/USD). The current price is $3,323.720, reflecting a decrease of $45.480 (-1.35%) over the last hour. The chart includes a candlestick representation with a notable downward trend, a support level around $3,324.455, and a resistance zone between $3,352.955 and $3,360.000. The time frame displayed ranges from 12:00 to 3:00, with the data updated as of 12:52 PM PKT on June 24, 2025.
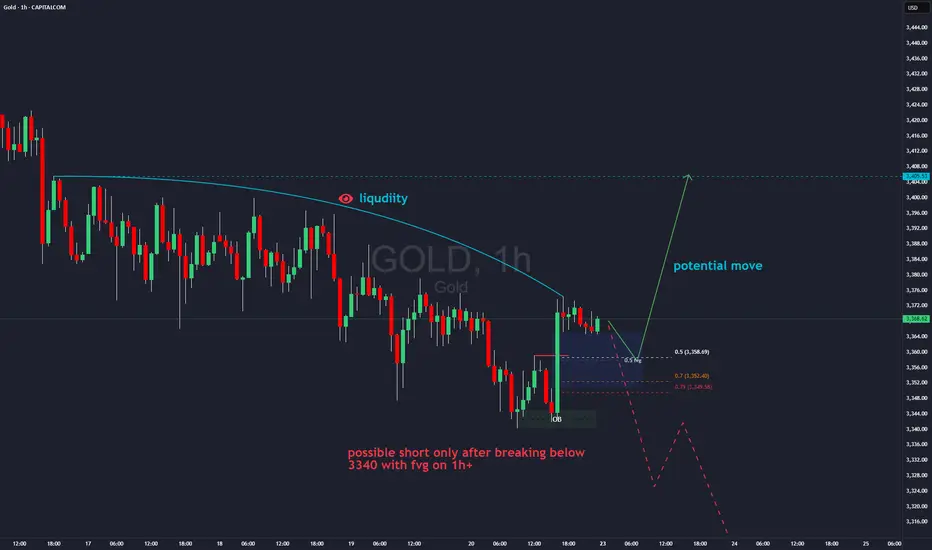
Gold, Will USA-Iran-Israel conflict affect it? The USA-Iran-Israel conflict can significantly impact gold prices. Gold is a safe-haven asset, so demand often rises during geopolitical tensions, pushing prices up
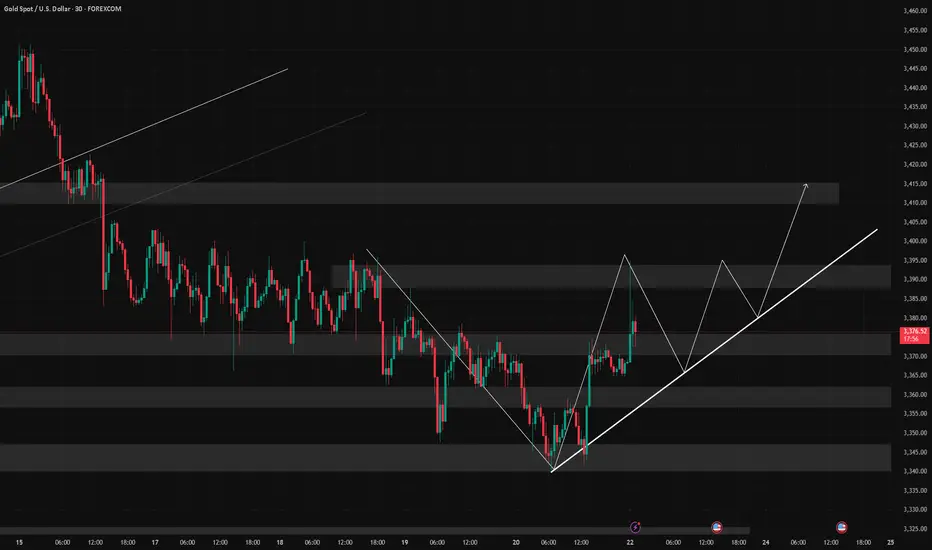
3406 gonna be first target for me, if it breaks this lvl with huge volume and FVG on 1h+ then most likely we will see ATH in near future
bearish scenario(lest likely) - price breaks down 3340 and close with nice volume and fvg on 1h+ which will open move all the way down to MO
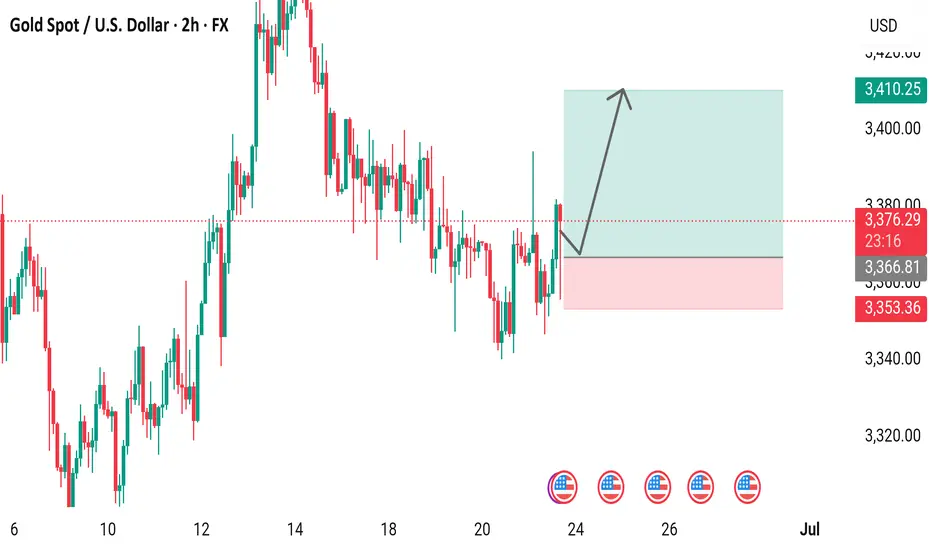
Gold Spot / U.S. Dollar (XAUUSD) 2-Hour Chart2-hour candlestick chart displays the price movement of Gold Spot (XAUUSD) against the U.S. Dollar, with the current price at 3,373.97, reflecting a +5.99 (+0.18%) change. The chart highlights recent price trends, including a notable upward movement, with key support and resistance levels marked around 3,366.81 and 3,410.25, respectively. The time frame spans from approximately 6:00 AM to 3:35 PM CEST on June 23, 2025.
Gold Market Analysis and Trading Recommendations for TodayLast Friday, the overall gold price on the technical side continued to be under pressure, retracing and oscillating in adjustment. Eventually, it stabilized at the 3340 level before the close, rebounding and oscillating to close. The daily K-line reported an oscillating digital K. The overall gold price continued the recent suppressed oscillating consolidation.
However, over the weekend, the US military attacked Iranian nuclear facilities, intensifying geopolitical tensions in the Middle East, and market risk-aversion sentiment heated up. This morning, the gold price gapped up, piercing the 3390 level, reaching a high of around 3398 before retracing and falling into oscillation.
In the short term, it is highly probable that the gold price will continue to operate in a wide-ranging oscillating interval between long and short positions, continuing to trade time for space. Although the gold price opened high and moved low, it still has not broken the long-term trend channel. Looking for opportunities to go long on retracement is also the current trend.
From the current market trend, today's technical support on the downside focuses on around 3350 - 3345, and the short-term resistance on the upside is around 3380 - 3385, with a key focus on the 3395 - 3405 level. For the day, first, rely on this interval to maintain the main tone of participating in the long - short cycle. For positions in the middle range, always observe more and trade less, and be cautious about chasing trades. Patiently wait for key points to enter the market.
XAUUSD
buy@3345-3355
tp:3370-3390-3410
Investment itself is not the source of risk; it is only when investment behavior escapes rational control that risks lie in wait. In the trading process, always bear in mind that restraining impulsiveness is the primary criterion for success. I share trading signals daily, and all signals have been accurate without error for a full month. Regardless of your past profits or losses, with my assistance, you have the hope to achieve a breakthrough in your investment.
Gold Spot Price Trend Analysispresents a detailed analysis of the gold spot price trend against the U.S. dollar, captured over a four-hour interval. The chart displays a fluctuating pattern, with prices ranging from approximately $3,320 to $3,383.74 USD. A notable decline is observed, marked by a red box indicating a support level at $3,332.53, while a green box suggests a resistance level at $3,383.74. The current price stands at $3,353.94, with a slight decrease of 0.42%. The chart provides valuable insights for investors and traders seeking to understand the dynamics of the gold market.

XAUUSD and USOILHesitation Geopolitical factors have led to the escalation of relations between several countries. The Middle East is in chaos. Although this is a trading market, the relationship between the two is too close. This is why the Asian market XAUUSD reached a high of 3400.
But it is not stable. Because after the news that stimulated the rise in gold prices over the weekend, there were some negative news. For example, peace talks, time differences, negotiations and other factors have eased the tense atmosphere. Then the gold price fell with the trend, reaching a low of 3347.
From the overall situation, the market still has the momentum to rise in the short term. But this depends on Iran's response. Including the impact of the Strait of Hormuz. This is the key factor in the rise or fall of oil prices. Investors with larger funds can arrange long orders in advance.
The view on XAUUSD is to buy at low levels. The impact of geopolitics is too huge. On the basis of interest rate cuts, buying is the key to profit. But everyone's financial situation is different, so when trading, remember to control the position ratio. Prevent trading errors from leading to account liquidation.
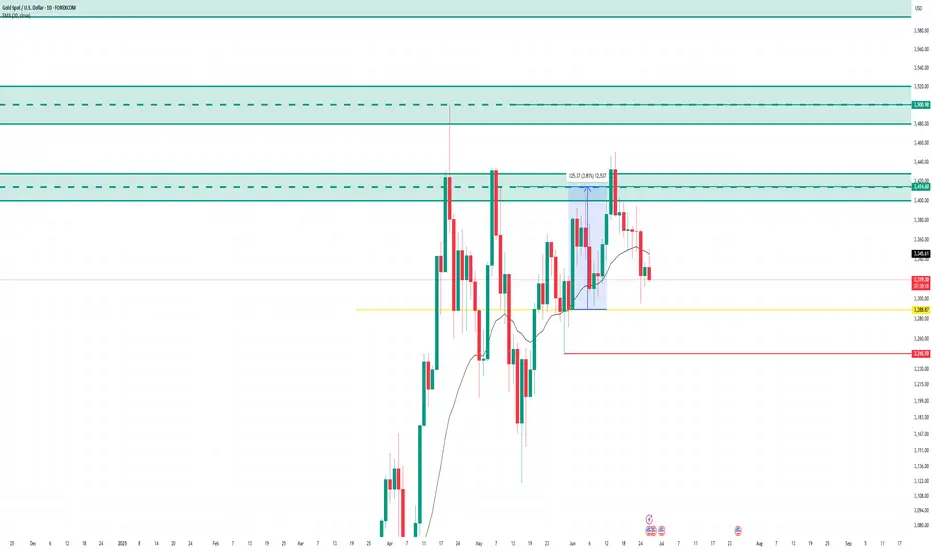
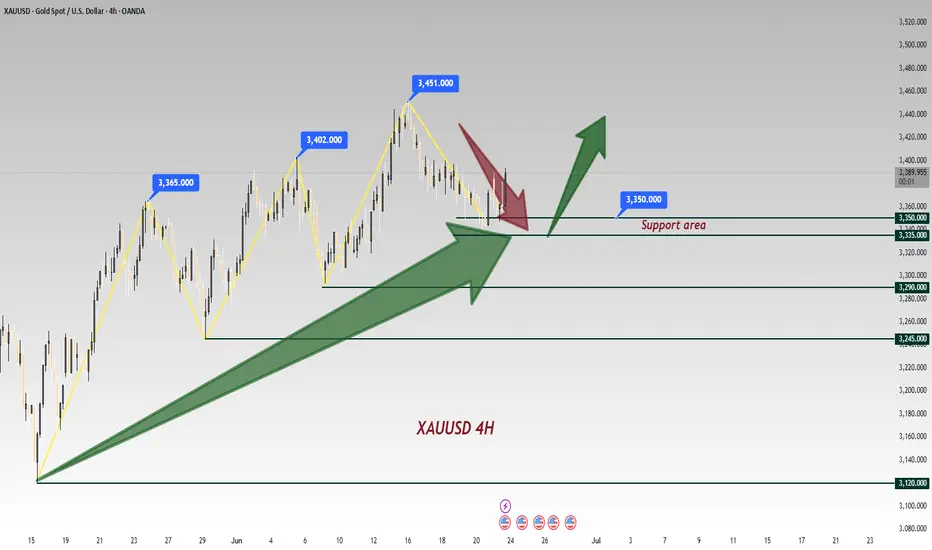
Next Week Gold Trend Forecast & Trading TipsDuring this round, the price was sold off sharply from the historical high of 3,500 to 3,120 before rebounding. After consecutive rallies, it faced pressure and fell back to 3,452 due to the fading of market risk aversion. On Friday, it rebounded from a low of 3,340. The daily chart recorded a consolidative bearish candle, with the K-line combination leaning bearish, while the 4H chart showed signs of stopping the decline.
In the short term, it is expected to consolidate below 3,400 next week. For the medium term, attention should be paid to the geopolitical crisis and the Federal Reserve's July interest rate decision. A breakthrough node will be ushered in after confirming the resistance above 3,400.
On the short-term 4-hour chart, the support below is focused around 3,340-45, and the short-term resistance above is around 3,380-85. The key focus is on the suppression at the 3,400-05 level. The overall strategy of going long on pullbacks within this range remains unchanged. For medium-term positions, it is advisable to stay on the sidelines, avoid chasing orders, and patiently wait for entry at key levels.
Investment itself is not the source of risk; it is only when investment behavior escapes rational control that risks lie in wait. In the trading process, always bear in mind that restraining impulsiveness is the primary criterion for success. I share trading signals daily, and all signals have been accurate without error for a full month. Regardless of your past profits or losses, with my assistance, you have the hope to achieve a breakthrough in your investment.
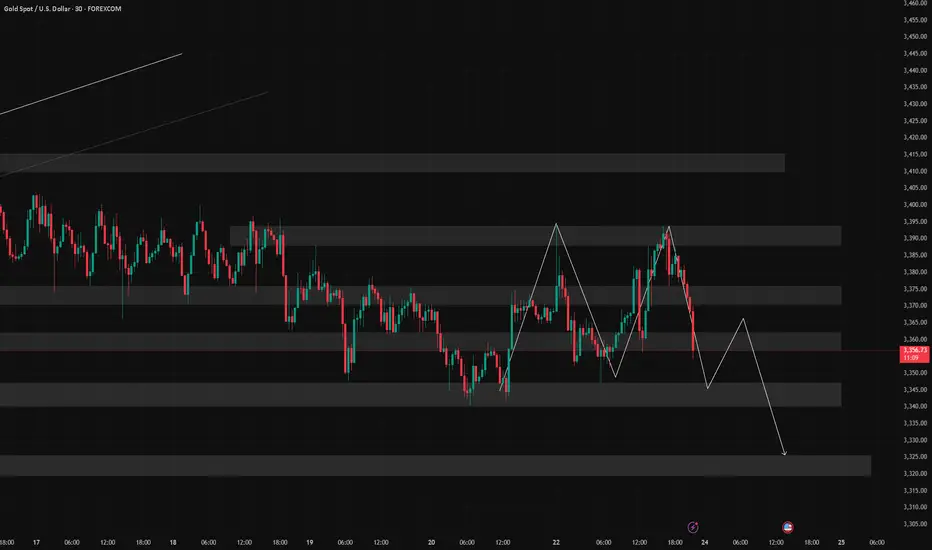
6/23 Gold Analysis and Trading ViewsGood morning, everyone!
Over the weekend, former President Trump announced and carried out an attack on Iran's nuclear facilities, triggering a renewed wave of risk-off sentiment in the markets. At today’s open, gold surged to around 3394. Driven by geopolitical tensions, the bearish technical structure has temporarily been disrupted.
Whether the bullish momentum can sustain will depend on how the situation continues to unfold.
Key technical levels to watch today:
Resistance: 3389 / 3407 / 3423 / 3432
Support: 3372 / 3365 / 3356 / 3348
Trading strategy: Given the current news-driven market, a buy-on-dip approach is preferred, with short positions as a secondary option depending on price reaction near resistance zones.
Also, pay close attention to today’s daily close (1D chart). If the price closes below 3355, it could signal profit-taking from the bulls, potentially pulling gold back into a bearish technical trend.
Gold Trade Setup - 22/Jun/2025Hi Traders,
I expect this pair to go Up after finishing the correction.
1) We are in uptrend and potentially correcting for further upside.
2) The current move can be just a part of a intermediate correction or can even go to break the top.
How to Enter : Look for engulfing with in the SL zone.
