XAUUSD Analysis todayHello traders, this is a complete multiple timeframe analysis of this pair. We see could find significant trading opportunities as per analysis upon price action confirmation we may take this trade. Smash the like button if you find value in this analysis and drop a comment if you have any questions or let me know which pair to cover in my next analysis.
Xauusdforecast

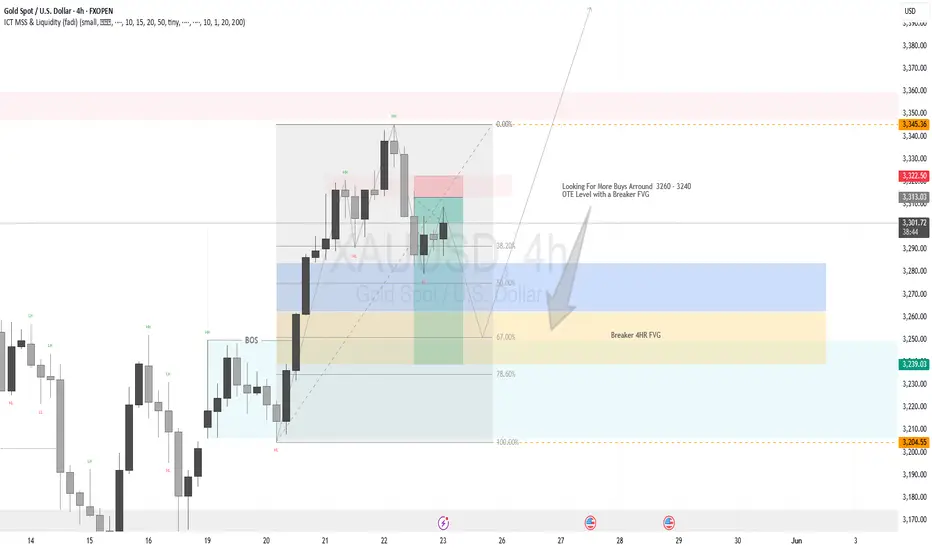
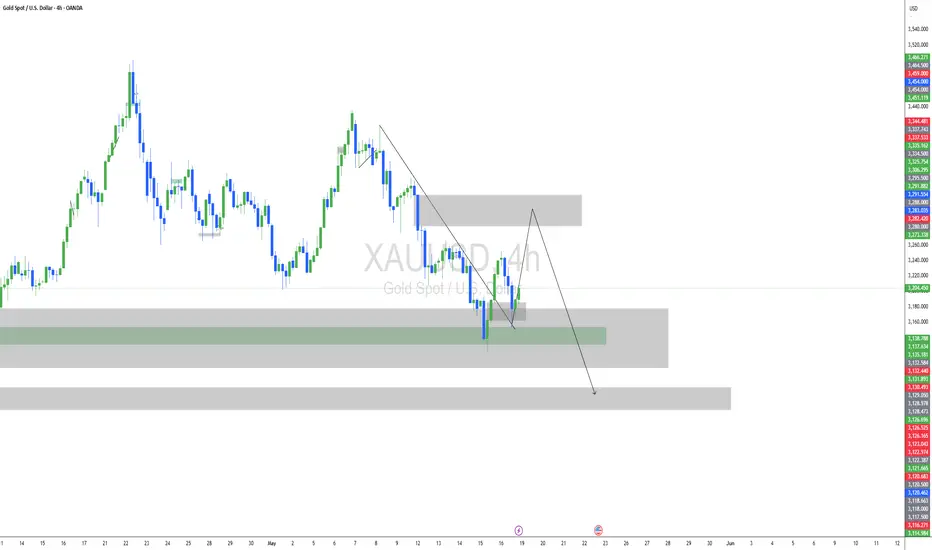
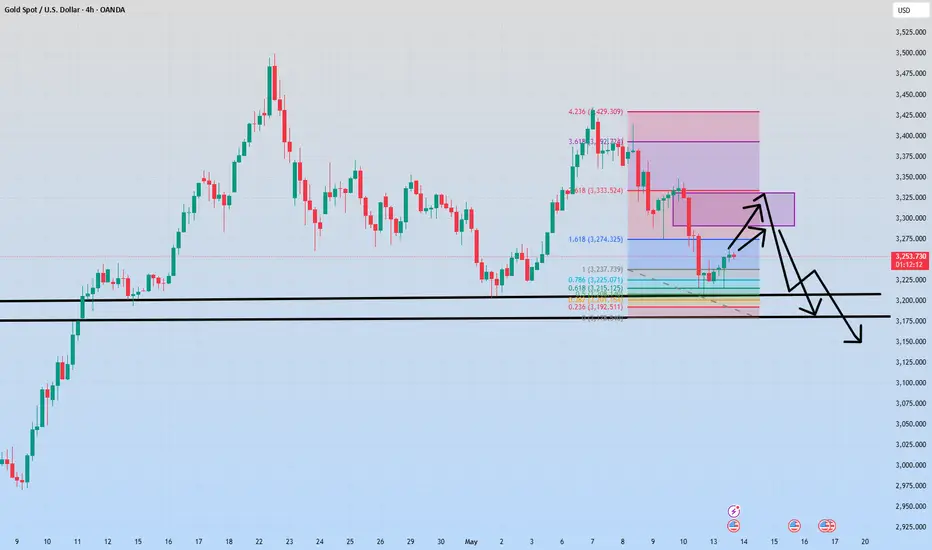
XAUUSD Market OutlookMy current bias on XAUUSD remains bullish, as we are targeting the lower high (LH) around the 3,438 level. However, the market is currently in a pullback phase within the LH & LL. Price has entered an OTA level within a Daily Fair Value Gap (FVG), ranging between 3,370 and 3,333. This presents a potential opportunity for short setups as we move towards the 3,251 level.
On the 4-hour timeframe, there's a valid FVG Breaker near our Fibonacci-based OTA level, aligning closely with the 3,251 support zone. This is a key area to watch for bullish confirmations. Any long positions should ideally be considered from this zone.
Important Note:
When trading gold, patience and discipline are essential. Only act on clear, confirmed setups that align with your strategy. Quality over quantity always wins in the long run.
[20250522] - Gold Overview1️⃣ Market Overview:
📌 Recent Closed: 3315
📌 Bullish sentiment confirmed above (3265)
📌 Key reversal threshold: (3296)
2️⃣ Key Observations:
✅ Price above (3253) suggests continued bullish bias.
✅ Recent High 3320—watch for a strong breakout or exhaustion.
✅ Next liquidity Range: 3337 (upside), 3264 (downside).
3️⃣ Potential Scenarios:
🔹 Bullish Continuation: Closing above 3320 confirms momentum toward 3337.
🔹 Bearish Exhaustion: Failure to hold 3296 could trigger a reversal toward 3253.
🔹 Invalidation: 💡 A break below 3296, failing Bull POC (3265), would shift sentiment bearish.
4️⃣ Entry & Target Levels:
🔹 Bullish Entry:
✔️ Price holding above 3296 strengthens bullish sentiment.
✔️ A confirmed break above 3320 opens room for a run toward 3337 liquidity zone.
🔹 Bearish Entry:
✔️ If price fails to sustain above 3296, watch for confirmation near 3253 VAH.
✔️ A strong rejection leads price toward next liquidity at 3264.
🎯 Targets:
Upside: 3320 breakout leads toward 3337 liquidity zone.
Downside: Failure at 3296 opens movement toward 3264 liquidity support.
📢 Your Thoughts? Drop a comment and let me know what you think! 🚀

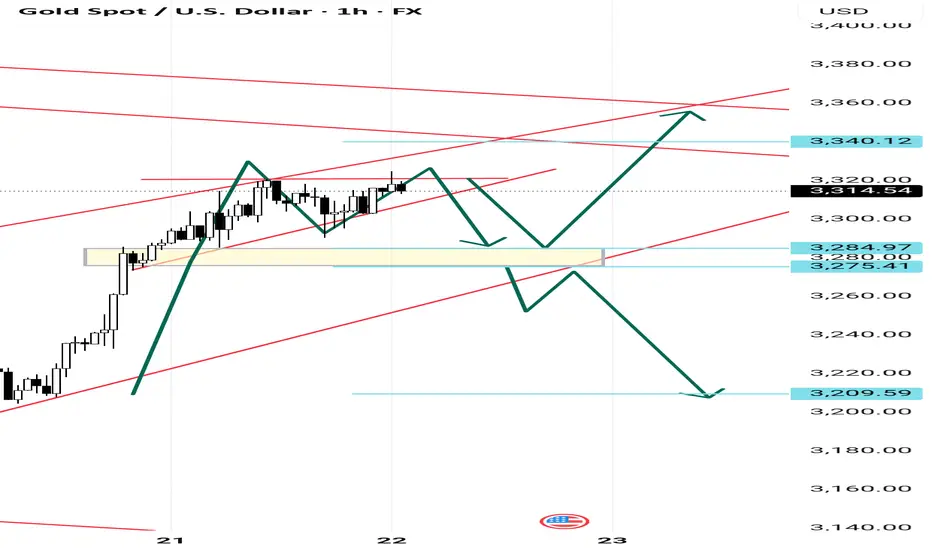
XAU USD NEXT POSSIBLE MOVE WITH SO MUCH UP AND DOWNIn hourly time frame it takes rejection and after opening session we can see two scenarios...
After opening new session if it comes down then tgt: 3385, from here have 90% chances to reverse for tgt: 3340, if it will not reverse and continue down side then we can go for the tgt:3275 to 3209
Will gold continue to rise to 3280-3330 today?Hello everyone. Let's discuss the trend of gold this week. Today, Moody's downgraded the US sovereign credit rating from AAA to Aa1 on the grounds of "debt surge and fiscal out of control", ending the US's last "top credit" title among the three major rating agencies.
Due to this influence, gold opened sharply higher today, Monday, and the highest so far is around 3250.
Here is the 1-hour chart:
If gold can continue to rush above 3250 in the short term, then we will see 3280-3300 later.
The high point of 3250 may be broken at any time.
For now, I think that as long as gold is above 3200 today, gold will continue to rise.
So, if you do it in the short term, you can buy in the 3200-3220 range, with 3200 below as defense, and as long as the upper target stands firm at 3250, you can continue to see the 3280-3300-3330 range.
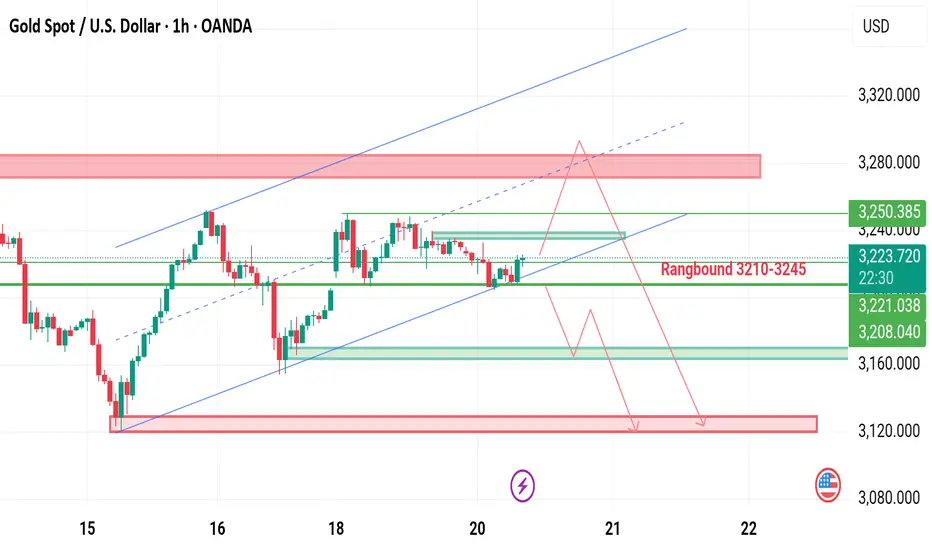
Rangbound with rising patternXAUUSD H1& H4 Timeframe .
Although gold is intact with the rising channel at trend line meets with 3205-3250
- I will sell on top from 3270-3280 structural resistance area if i got confirmation of rejection and to long target at 3130.
-if we get candle above 3235 then we'll see upside surprise towards 3252 first then 3270.
BEARISH SCANARIO:
-if 3210-3205 breaks then we should leave the upside back behind and sell towards 3180 in first stage then we will have to wait for the 3180 structural support Invalidation towards bottom side .once 3180 breaks in h4 then move your weapons towards 3130 target.
#XAUUSD
Will gold fall to 3180-3158?Hello everyone. Let's discuss the trend of gold this week. If you have a different opinion, you can express your different opinions in the comment area. Yesterday, Monday, retail traders made a record bottom-fishing in US stocks, reversing the 1% drop in the S&P 500 index caused by Moody's downgrading the US credit rating last weekend.
Yesterday, Monday, gold opened at a high point near 3250, but after the US stock market opened, it basically maintained a downward trend.
From the current 1-hour chart, gold has been fluctuating above the 1-hour chart range yesterday, Monday, but there has been a change today. It has continuously fallen below the hourly chart range support position at the opening.
Therefore, from the current point of view, gold is likely to retreat downward today, and the 3200 mark is currently difficult to hold.
Therefore, we must be alert to the possibility of a retracement today. As for the operation, you can rely on the 3220-3225 range to sell, and look at the target to 3180-3158.
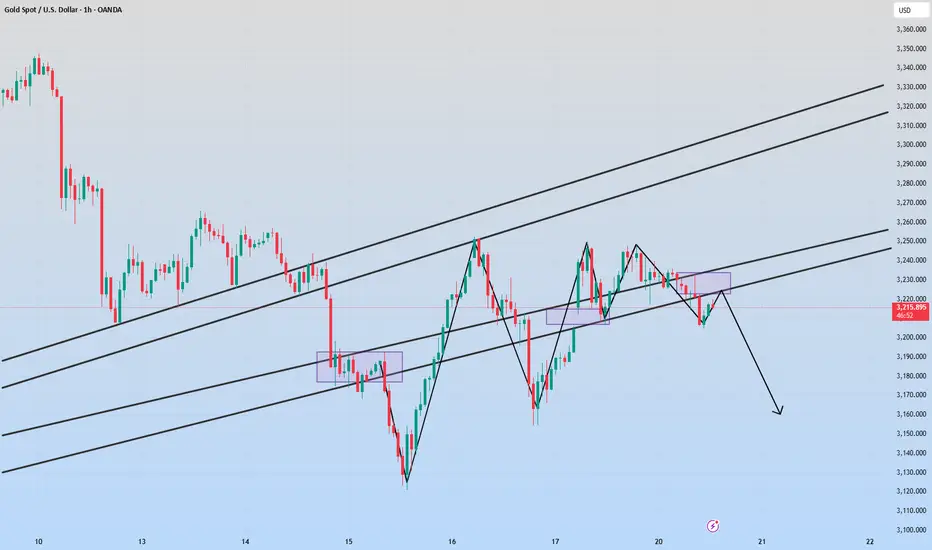
GOLD set for another drop?As expected in our previous analysis XAUUSD bounced to daily resistance and started to get rejected with a strong momentum in the major direction of the trend. As we see series of lower high formation XAUUSD may continue to drop to daily support level following the long term trend.

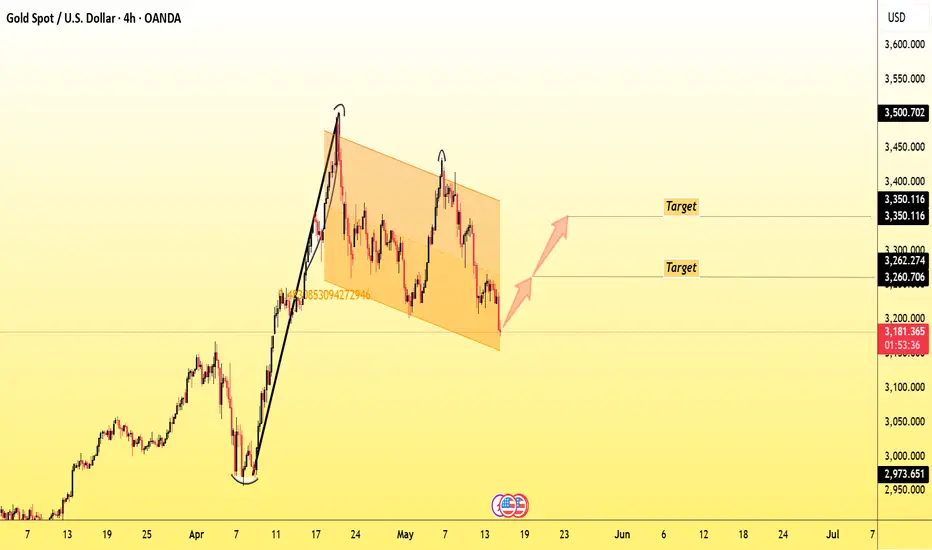
XAUUSD FLAG BULLISH PATTERN (HIGHER HIGH) ANLYSISThe XAUUSD Market momentum has made a flag bullish pattern showing the strong uptrend had the confirm targets at different zones.
1st Target Zone 3260
Final Target Zone 3350
resistance level: 3100
Conclusion: If the market momentum moves towards target then hold on your trades but if the market moves against to the target then there is an option of stop loss point active and all the trades should be closed.
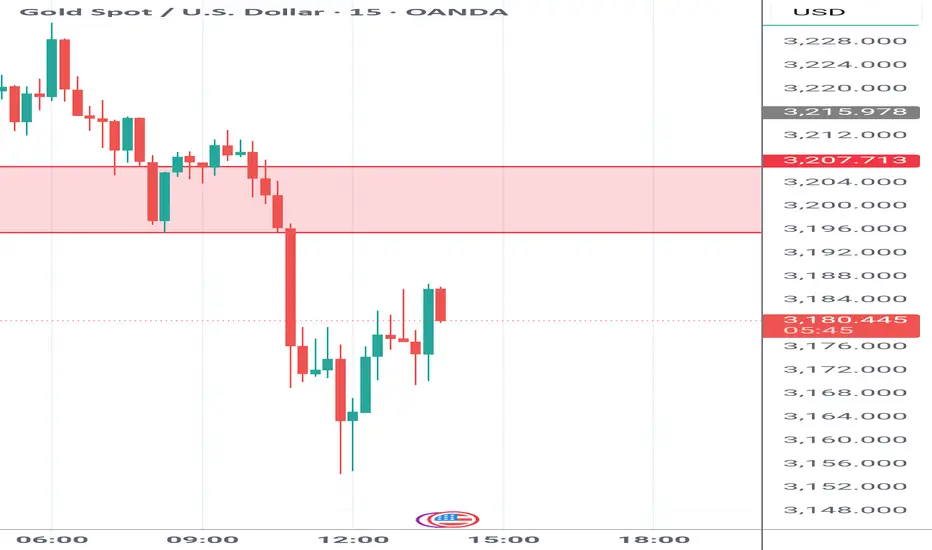
"XAU/USD Bearish Structure Developing Below Resistance"Gold price showed a sharp upward movement but faced resistance near the 3212–3220 zone. After forming a lower high, the structure appears to be setting up for a potential downside move.
The market seems to be respecting a descending channel and if the current resistance holds, we could see further continuation toward the 3120–3122 support area. Volume spike during the drop also indicates possible seller strength.
This is an educational analysis based on price structure and market behavior.
Feel free to share your thoughts or give a boost if it aligns with your view.
🔍 Key Points:
Resistance Area: ~3212–3220
Current Price Reaction: Forming lower highs
Target Zone: 3120–3122 (support)
Pattern: Bearish flag or channel
Volume: Increased on downside move – shows selling pressure

XAUUSD Waiting for the huntI will wait for the price to react to the red zone to decide how to enter the trade. I think we are at a crucial time for this. The most beautiful visualization for the continuation of the price movement is a pullback to the red zone and a continuation of the decline.
Gold Reversal Potential from Falling Wedge + Demand Zone
Gold (XAU/USD) is showing signs of a potential bullish reversal on the 15-minute chart. After forming a falling wedge pattern and reaching a key demand zone around 3120, price action suggests a possible bounce.
Falling wedge breakout observed with increasing volume
Strong rejection from the 3120 support zone
Risk-to-reward setup aligned with bullish momentum
Watch for continuation if price holds above the minor trendline
This idea is for educational purposes only and not financial advice.

Channel Breakout with Bullish Reversal on XAUUSD (15M)"
Price moved within a clean descending channel and eventually broke out with momentum. After forming a strong reversal candle near previous support, a long position was considered. Volume increase confirms potential buyer interest. Setup aims for upper imbalance / liquidity zones. Chart shown on 15-minute timeframe.

Will gold rise today?Hello everyone. Let's discuss the trend of gold this week. From the current 1-hour chart range, gold is at risk of falling again to 3200.
The current 1-hour chart range has been broken. After breaking the range support today, it has rebounded again, so the previous support has become a suppression position.
Therefore, if gold cannot stand above 3250, then we must be careful of the risk of gold testing 3200.
You can focus on 3240-3250. As long as it cannot stand above 3250, you can sell gold at 3240-3250. The target below is still around the bottom of the range 3200.

"XAUUSD Approaching Key Resistance – Falling Channel Breakout Se
Gold (XAUUSD) has been moving within a well-defined falling channel. Price is now approaching the upper boundary of the channel, indicating a potential bullish breakout. The recent uptick in momentum and volume suggests buying interest is building.
Key resistance is seen around 3215–3220, while immediate support lies near 3170–3160. A confirmed breakout above the channel could open the path for further upside, while rejection may lead to a continuation of the downtrend.
This is a technical outlook based on chart structure and volume behavior — always manage risk accordingly.

Gold fell below 3200 as expected. How to operate gold?An overall bearish trend of consecutive negative and single positive declines is formed. The double top above 3400 is suppressing the decline, and a top shape structure of a large M head is formed. The key lies in whether a substantial breakthrough can be formed at the previous low of 3200. Once it breaks down, the space below will be opened up, and the other half of the M head will continue to extend downward. At that time, the daily level may usher in an accelerated decline.
At present, gold has broken through 3200 and has been exploring downward. We have said before that we have been emphasizing that gold is mainly short. Keep paying attention to the trend of gold. Today's successful prediction of the trend of gold has been very rewarding. Keep up with my pace and you will definitely gain something. In the future, gold will still be mainly short. Go short immediately after the rebound

XAUUSD A place to decideWe will be ready to buy or sell. The price is at a decisive level and we will have to wait and see how the price reacts to it. It won't take long

Will gold continue to rise?Hello everyone. Let's discuss the trend of gold this week. If you have a different opinion, you can express your thoughts in the comment area. At present, the first important position of gold is around 3295, and the second is 3320-3330.
3295 is the 382 position of gold in this round. If the rebound does not pass here, then if it falls again next, it is very likely to break the support of 3200.
The second is 3320-3330, which is the gap on Monday. If it goes up, the possibility of filling the gap is also very high.
So, next pay attention to the two positions I mentioned above, 3295 and 3320-30. If you want to sell gold, it is best to wait for these three price positions.
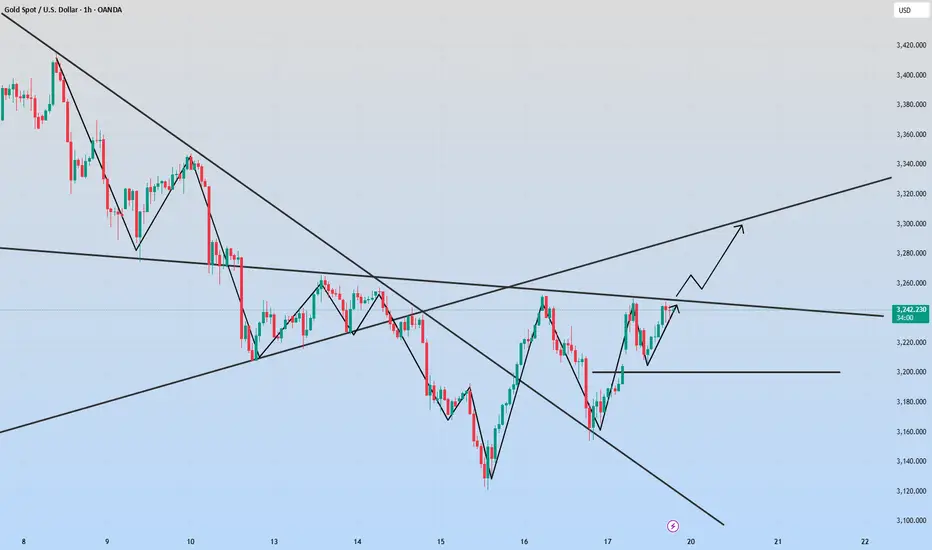
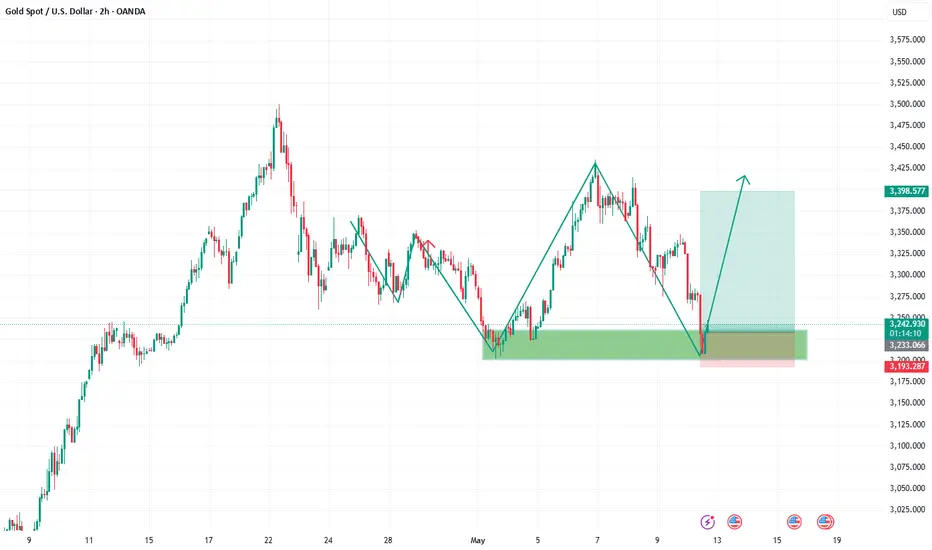
XAUUSD GOLD LONG/BUYBy utilizing Fibonacci retracement levels, historical patterns, , we can formulate a hypothesis that the market might follow a similar trajectory if bullish sentiment prevails.
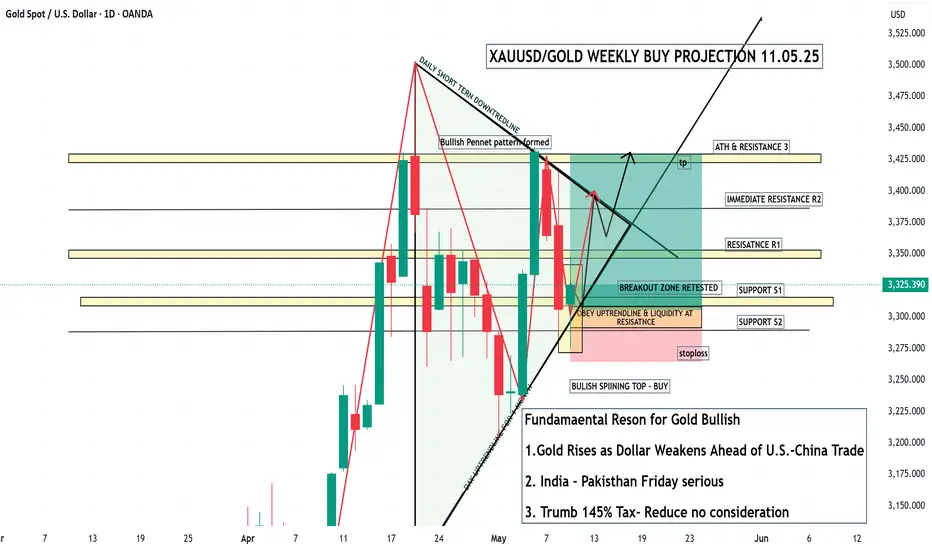
XAUUSD/GOLD WEEKLY BUY PROJECTION 11.05.25Pattern: A bullish pennant pattern has formed, signaling a potential upward continuation.
Breakout Confirmation: Price has broken the daily short-term downtrend line and is retesting the breakout zone, which suggests potential for a strong upward move.
Support & Resistance Zones:
Support Levels: S1 (≈ 3325), S2 (~3270)
Resistance Levels: R1 (~3350), R2 (~3375), ATH & Resistance 3 (~3425)
Entry Zone: Price is in a buy zone, reinforced by a bullish spinning top candlestick and alignment with an uptrend line.
Stop Loss: Placed just below Support S2 (~3270)
Take Profit (tp): Near ATH zone (~3425)
Gold waiting for TomorrowThe sell signal was issued on the last candle when the red zone broke down. But I don't know how it will react to the green support zone in a short distance.
If I insist on trading, I will enter a short sell trade at the opening of the next candle with a short stop loss above the red zone and I will be alert to the price reaction to the green zone.

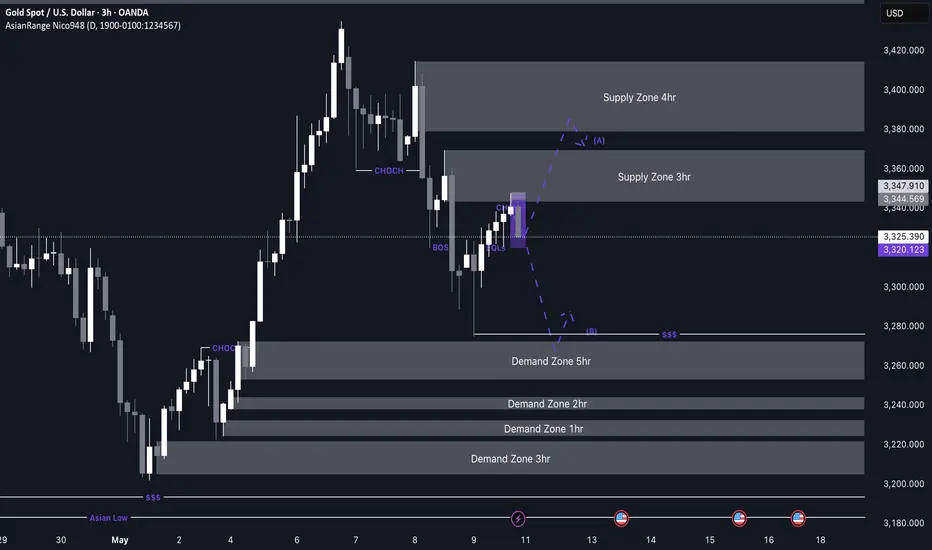
GOLD Possible bearish movesGOLD Weekly Outlook – Waiting for a Clean Entry
My focus this week on gold is based around the recent mitigation of the 3H supply zone. It was a clean setup, but unfortunately I didn’t get tapped in — and with it being late Friday, I decided to wait for a better entry, potentially on Monday.
As bullish pressure begins to weaken, I’m also keeping an eye on the 4H supply zone above, which could offer a stronger bearish reaction and a better opportunity to sell.
On the flip side, for any potential bullish continuation, I can see price sweeping the liquidity sitting below and then reacting from the 5H demand zone I’ve marked out. That area could provide the base for a re-accumulation and another move to the upside.
Confluences for GOLD Sells:
- Clear bearish reaction from the 3H supply zone with a completed Wyckoff distribution
- Liquidity to the downside remains untapped
- Weakening bullish momentum opens room for a possible sell-off
- DXY is showing short-term bullish strength, supporting a bearish bias on gold
P.S. If price reverses and takes out the current supply zone, I’ll be watching the next 4H supply zone for further reaction — but in the meantime, I’ll adapt by monitoring for a closer demand zone setup.
Have a great trading week ahead and stay sharp, traders!