XAUUSD Top-down analysisHello traders, this is a complete multiple timeframe analysis of this pair. We see could find significant trading opportunities as per analysis upon price action confirmation we may take this trade. Smash the like button if you find value in this analysis and drop a comment if you have any questions or let me know which pair to cover in my next analysis.
Xauusdforex

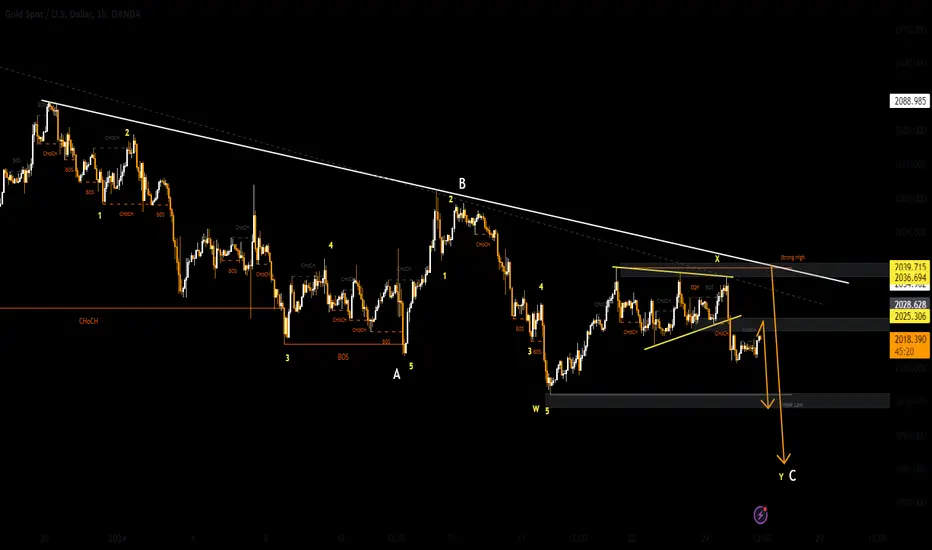
XAUUSD Gold New Week MovePair : XAUUSD ( Gold / U.S Dollar )
Description :
Symmetrical Triangle as an Corrective Pattern in Short Time Frame and Rejection from Lower Trend Line
Break of Structure and Retracement
CHOCH and Divergence in RSI
Completed " 12345 " Impulsive Waves and " AB " Corrective Wave
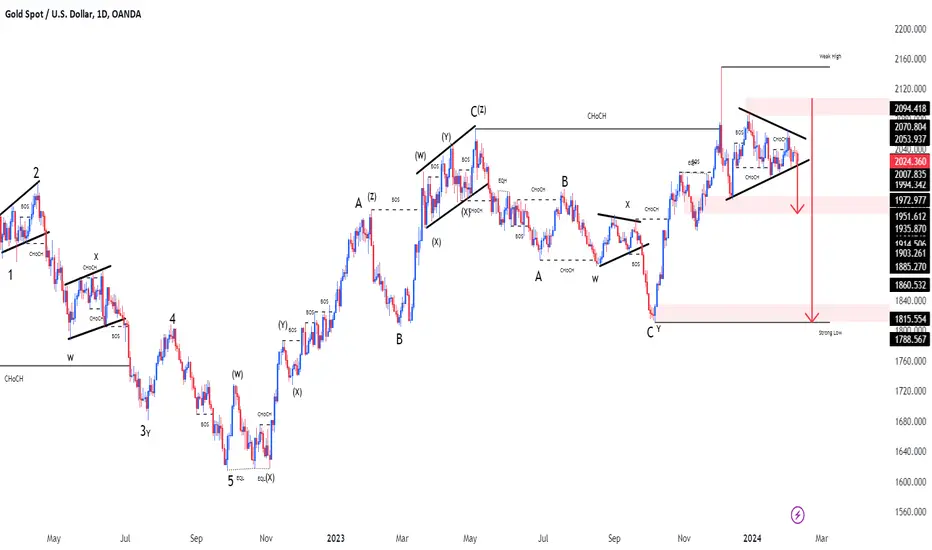
XAUUSD Pair : XAUUSD ( Gold / U.S Dollar )
Description :
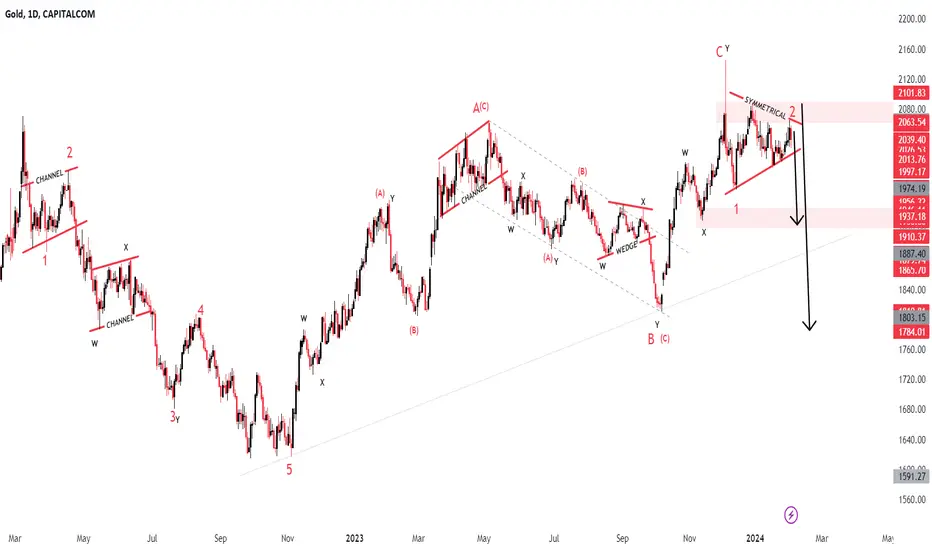
Completed " 12345 " Impulsive Waves and " ABC " Corrective Waves
Break of Structure and Completed the Retracement
Symmetrical Triangle as an Corrective Pattern in Short Time Frame and Rejection from Lower Trend Line
Strong Divergence in RSI
XAUUSD GoldPair : XAUUSD ( Gold / U.S Dollar )
Description :
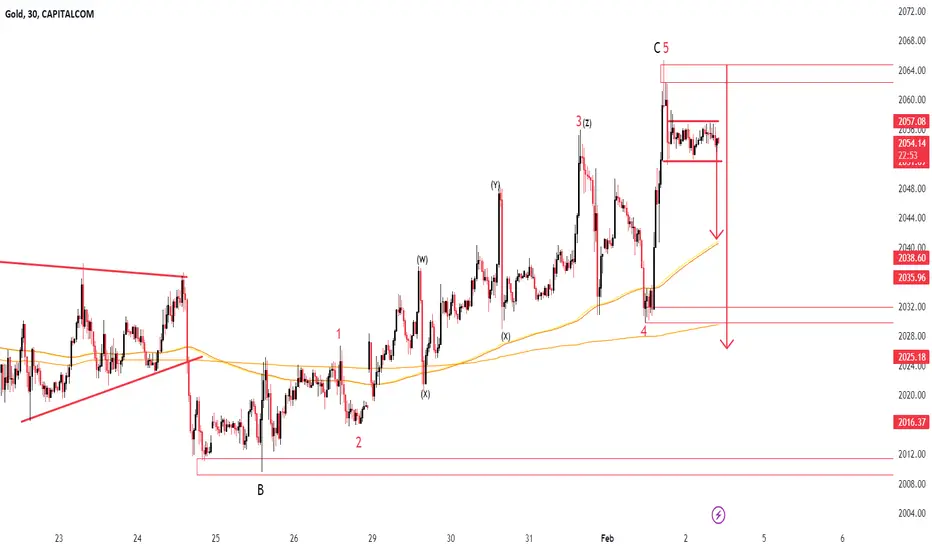
Completed " 12345 " Impulsive Waves and " A " Corrective Wave
Break of Structure
Consolidation Phase in Short Time Frame
Impulse Correction " ABC " Completed
Divergence in RSI
XAUUSD GoldPair : XAUUSD ( Gold / U.S Dollar )
Description :
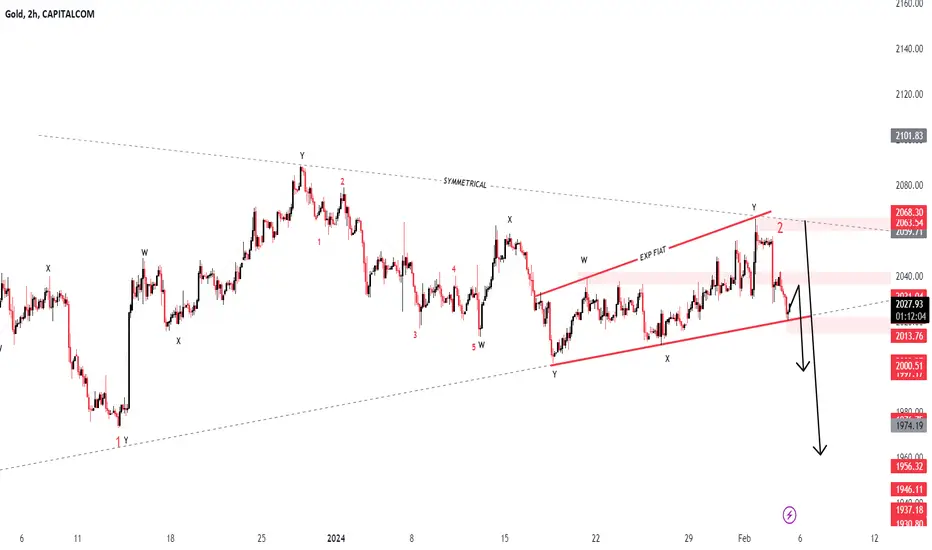
SYMMETRICAL TRIANGLE as an Corrective Pattern in Short Time Frame
Completed " 12 " Impulsive Waves and " ABC " Correction after Impulse
Break of Structure and Completed the Retracement
EXP FIAT as an Correction in Short Time Frame and Rejection from Lower Trend Line
CHoCH and Strong Divergence
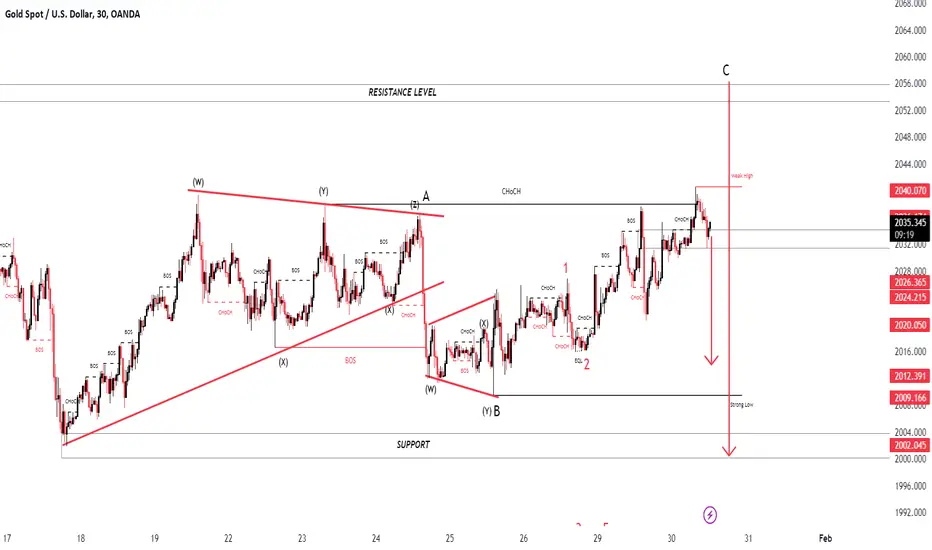
XAUUSD New Week Buy / Sell ? Pair : XAUUSD ( Gold / U.S Dollar )
Description :
We have Break of Structure and Completed its Retracement
Impulsive Waves " 12345 " and " Corrective Waves " ABC " Completed
Symmetrical Triangle as an Corrective Pattern in Short Time Frame and Rejection from Upper Trend Line
Strong Divergence in RSI
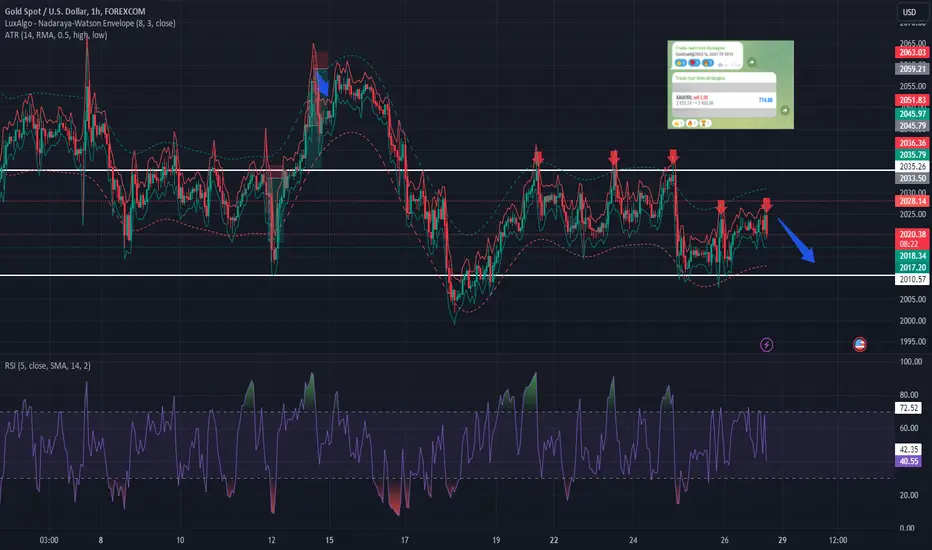
Bears Seize Control of the Gold MarketSince the onset of January 2nd, 2024, a discernible downtrend channel has shaped the intricate interplay between gold and the US dollar. Delving into the meticulous examination of gold's financial intricacies, my attention is laser-focused on identifying opportune moments for selling as the precious metal nears the trend line this week.
In the event that price encounters resistance within the critical thresholds of 2050 to 2070, a calculated strategy emerges – a potential short position with a downside target of approximately 55 pips, bringing us to an anticipated 2003 level. The overarching strategy hinges on a discernible transformation in the higher time frames, acting as a precursor for potential long positions.
In the strategic forecast, my outlook tends towards a bearish trajectory, unfolding gradually with each nuanced market development. Your active engagement in this financial analysis is pivotal. Appreciate your likes, comments, and shares as we navigate these nuanced market waters. Until the next data point emerges, see you on the analytical flip side! 🔄💹

XAUUSDPair : XAUUSD ( Gold / U.S Dollar )
Description :
Exp FIAT as an Corrective Pattern in Short Time Frame and Rejection from Upper Trend Line. Completed " AB - 12345 " Impulsive Waves and Corrective Waves. Consolidation Phase in Short Time Frame with Strong Divergence in RSI
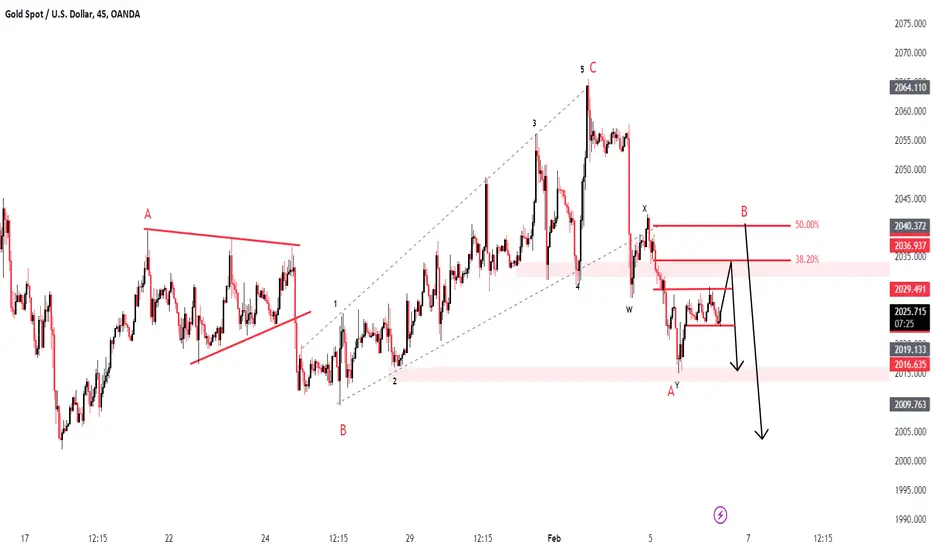
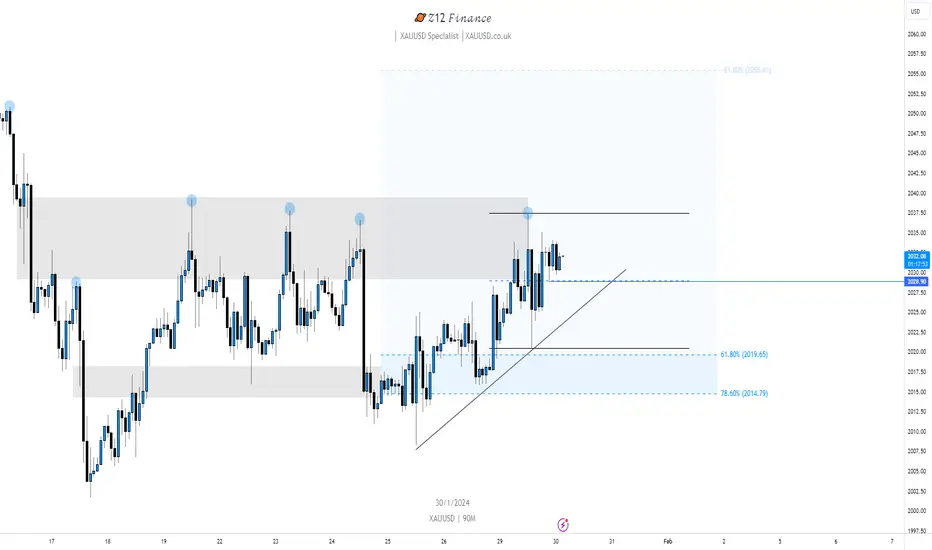
XAUUSD ( Gold / U.S Dollar )Pair : XAUUSD ( Gold / U.S Dollar )
Description :
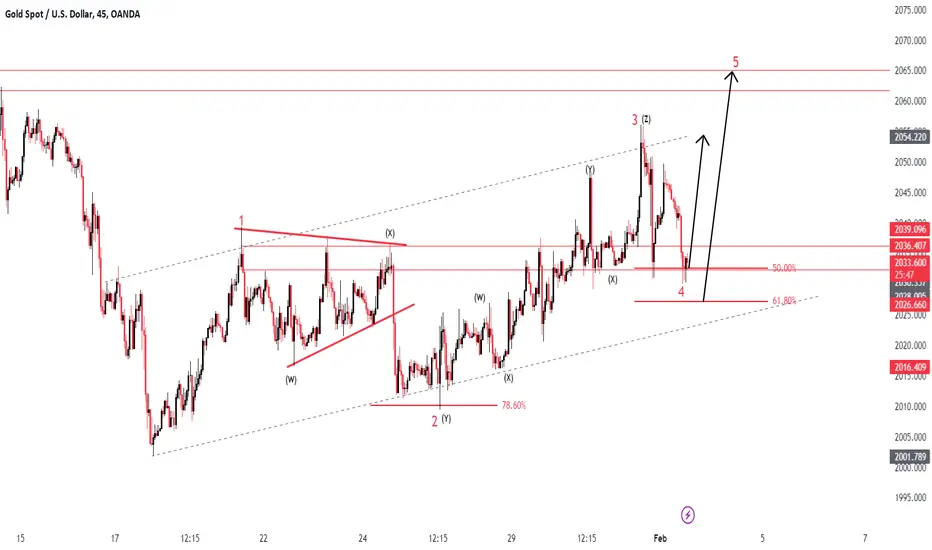
Completed " 1234 " Impulsive Waves at Demand Zone or Fibonacci Level - 50.00%. Bullish Channel as an Corrective Pattern in Short Time Frame and Rejection from Lower Trend Line. Strong Divergence in RSI and Completed the Retracement for Break of Structure
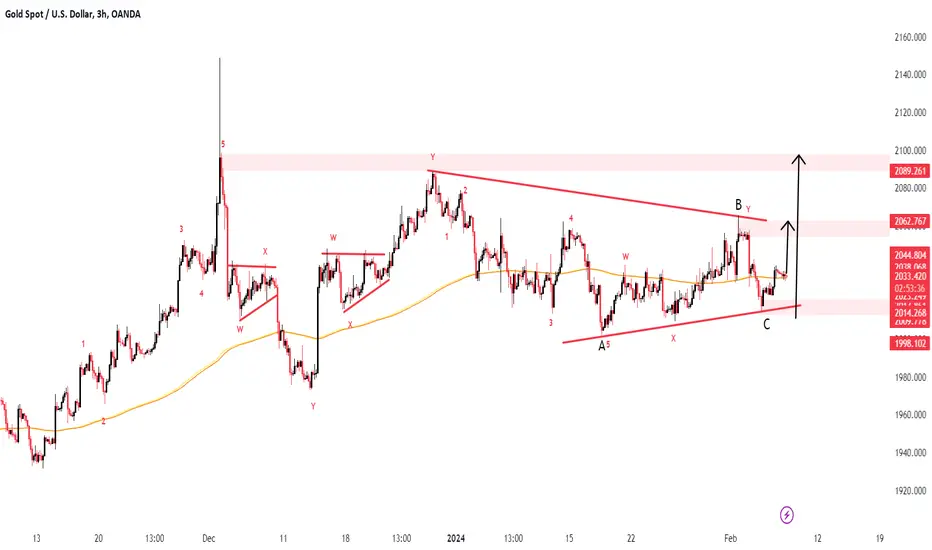
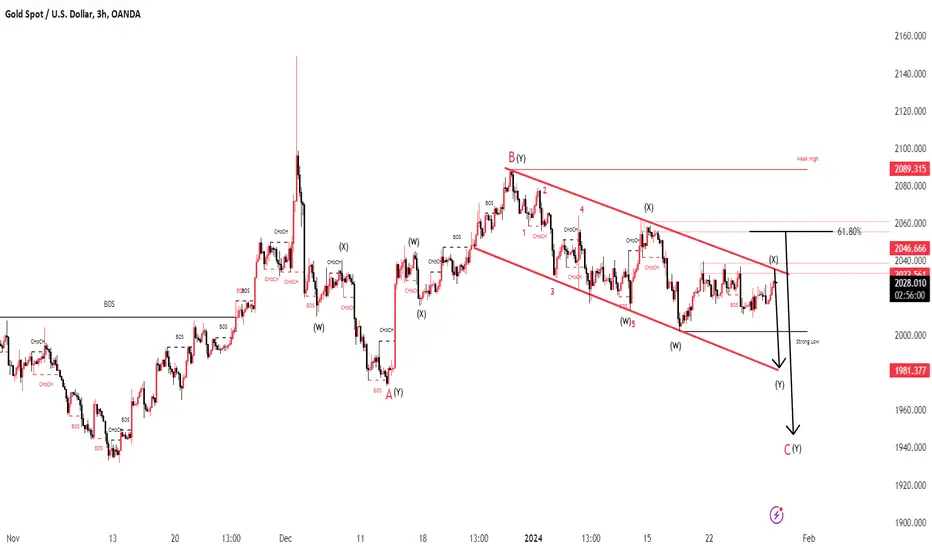
XAUUSD GoldPair : XAUUSD ( Gold / U.S Dollar )
Description :
Completed Impulsive Waves " 12345 " and " AB " Corrective Waves. Consolidation Phase in Short Time Frame with the Breakout of the Upper Trend Line and Retracement. Completed the Break of Structure and Retracement. CHoCH and Divergence
XAUUSD Clear Bullish MomentumI'm back and I wanna be top creator on here again for XAUUSD expect frequent chart updates on here that I am posting to my peers.
Lets smash 2024 together.
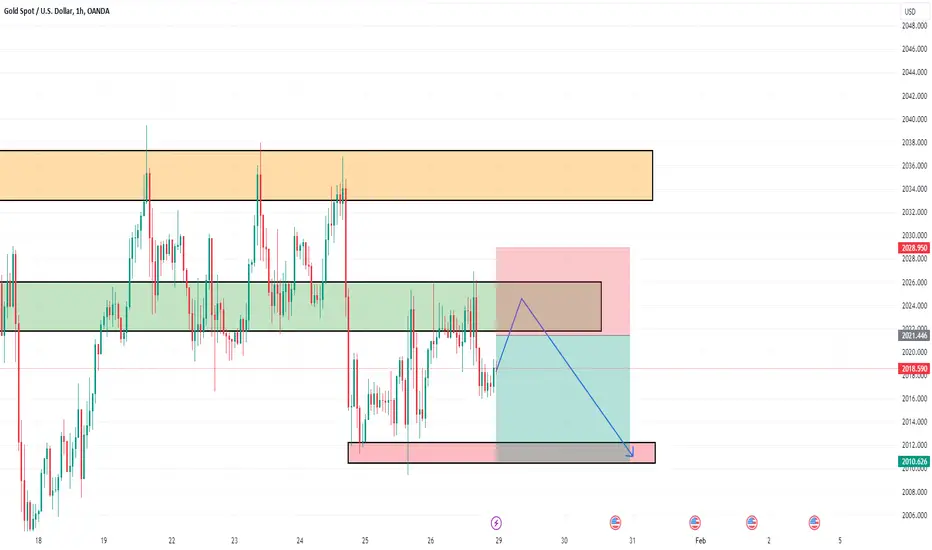
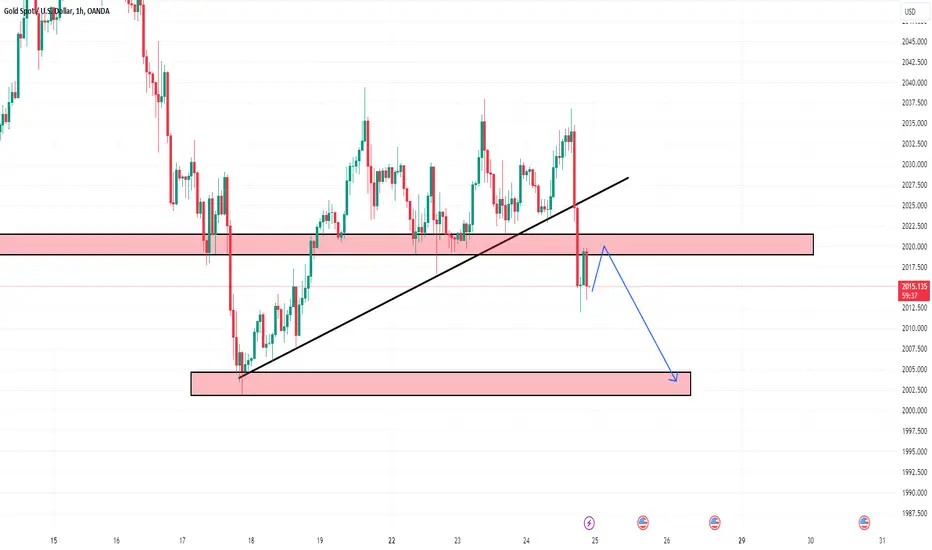
XAUUSD 1H SELL PROJECTION Overall Possible Outcome
XAUUUSD SELL @ 2030.5
SL 2036
TP 1 2024
TP 2 2017

XAUUSD Gold Sell/Buy ?Pair : XAUUSD ( Gold / U.S Dollar )
Description :
Completed Impulsive Waves " 12345 " and " ab " Corrective Waves. We have Break of Structure with the Breakout and Retracement. Bearish Channel as an Corrective Pattern in Short Time Frame and Rejection from Upper Trend Line.
GOLD ( XAUUSD ) Long Term Selling Trading IdeaJan 25
Hello Traders
In This Chart GOLD HOURLY Forex Forecast By FOREX PLANET
today Gold analysis 👆
🟢This Chart includes_ (GOLD market update)
🟢What is The Next Opportunity on GOLD Market
🟢how to Enter to the Valid Entry With Assurance Profit
This CHART is For Trader's that Want to Improve Their Technical Analysis Skills and Their Trading By Understanding How To Analyze The Market Using Multiple Timeframes and Understanding The Bigger Picture on the Charts
XAUUSD: Gold continues the short trend
After the release of the data, gold volatility is not large, the current trend of the US dollar index has encountered resistance to rebound upward, we then short gold near 2023!
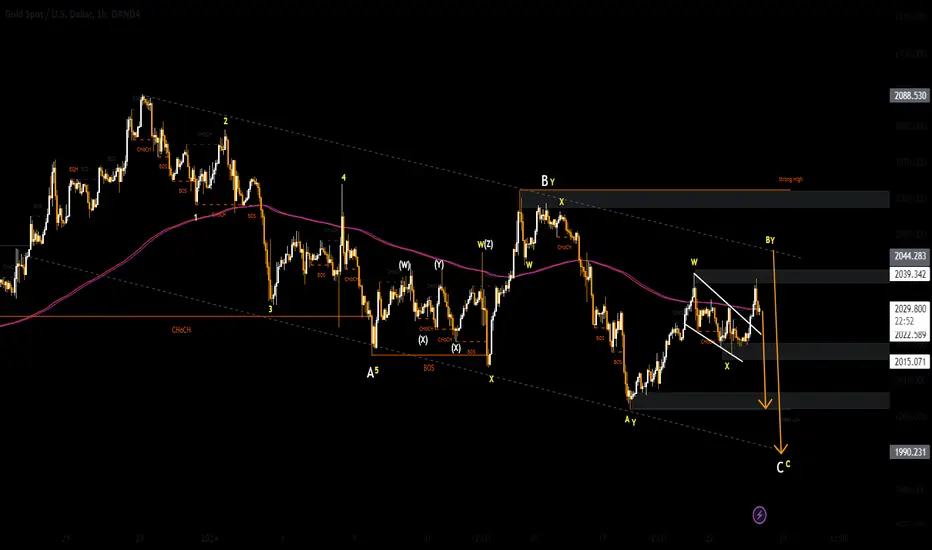
XAUUSD Gold Break of Structure !Pair : XAUUSD ( Gold / U.S Dollar )
Description :
Completed " A - 12345 , B - wxyxz " Corrective Waves. Symmetrical Triangle as an Corrective Pattern in Short Time Frame with the Breakout of the LTL and making its Retracement in Corrective Pattern " Exp FIAT ". Break of Structure with the Retracement at Demand Zone

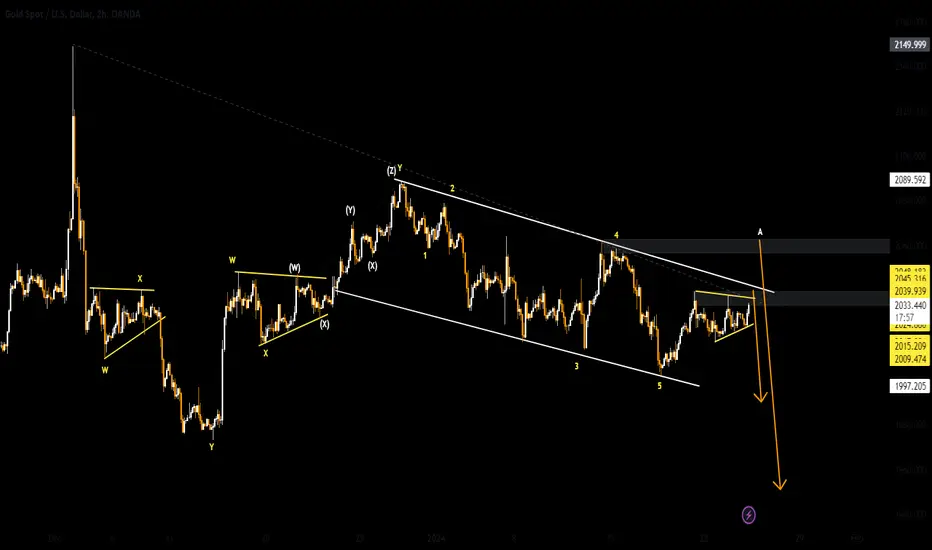
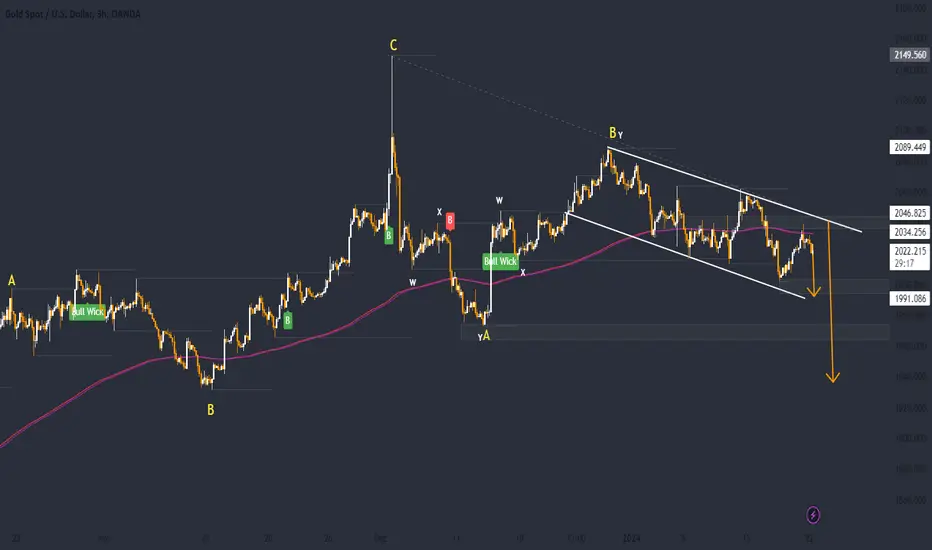
XAUUSD 25/01Pair : XAUUSD ( Gold / U.S Dollar )
Description :
Symmetrical Triangle as an Corrective Pattern in Short Time Frame with the Breakout of Lower Trend Line and Retracement. Completed Impulsive Waves and Corrective Waves " A - 12345 , B - 12345 ". Bearish Channel as an Corrective Pattern in Long Time Frame.
GOLD ( XAUUSD ) Long Term Selling Trading IdeaHello Traders
In This Chart GOLD HOURLY Forex Forecast By FOREX PLANET
today Gold analysis 👆
🟢This Chart includes_ (GOLD market update)
🟢What is The Next Opportunity on GOLD Market
🟢how to Enter to the Valid Entry With Assurance Profit
This CHART is For Trader's that Want to Improve Their Technical Analysis Skills and Their Trading By Understanding How To Analyze The Market Using Multiple Timeframes and Understanding The Bigger Picture on the Charts
xauusd: Will gold reach 1900?Hello friends, I'm Luke, a former champion trader in multiple regions. I'm excited to join TradingView and share my strategies with you every day, hoping to provide assistance.
Gold has continued its downward trend this week, with further pressure expected due to the renewed rise in DXY. Personally, I anticipate another decline in gold, so my trading advice for the near term is to wait for an upward movement before continuing to short.
Key resistance levels to watch are 2040-2050-2060. Scaling in short positions can be considered upon reaching this area, with target zones focused on 1980-1960-1940.
I update market analysis daily and also send accurate trading signals within Luke's group to help ensure the long-term stability and profitability of your account. Don't miss out!

XAUUSD GoldPair : XAUUSD ( Gold / U.S Dollar )
Description :
Bearish Channel as an Corrective Pattern in Short Time Frame. Completed Impulse and Correction as Symmetrical Triangle in Short Time Frame. " 12345 " Impulsive Waves and " A " Corrective Wave Completed. Triple Top Pattern in Short Time Frame.
XAUUSD 23/01 Pair : XAUUSD ( Gold / U.S Dollar )
Description :
Impulse Correction " A -12345 , B - wxy " Completed at Fibonacci Level - 61.80%. CHoCH at Demand Zone in STF. Falling Wedge as an Corrective Pattern in Short Time Frame with the Breakout of the Upper Trend Line and Retracement.
XAUUSD GoldPair : XAUUSD ( Gold / U.S Dollar )
Description :
Bearish Channel as an Corrective Pattern in Short Time Frame. Impulse and Corrective Waves " AB " Completed at Fibonacci Level - 61.80%. Break of Structure and Retracement Completed at Demand Zone. Strong Divergence in RSI
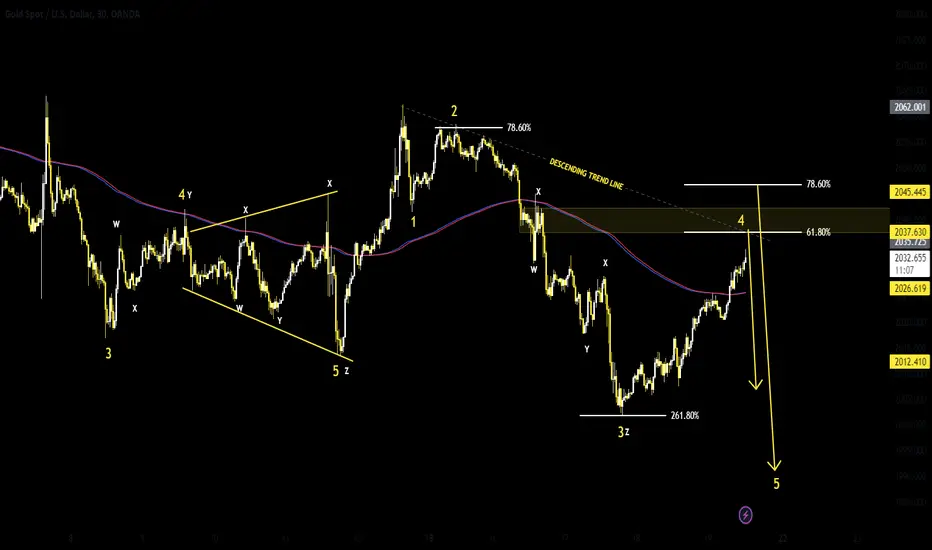
XAUUSD Pair : XAUUSD ( Gold / U.S Dollar )
Description :
" 1234 " Impulsive Waves will be Completed at Fibonacci Level ( 61.80% - 78.60% ). We have Break of Structure will Complete its Retracement at Demand Zone / Descending Trend Line. Bearish Channel as an Corrective Pattern in Long Time Frame