XAUUSD Trading Signals: Buy Dips at 3335-3345 Amid Bear Trap💡 Trading Framework In-Depth Analysis:
The Fed's policy statement failed to stir volatility (markets had fully priced in dovish expectations 💨);
Weekly market pattern: Asian sessions consistently saw rallies 📈, followed by profit-taking pullbacks in subsequent sessions 📉;
Tactical entry logic: Use intraday highs in Asian trading as resistance references for long positions 🎯.
📊 Technical Validation & Risk Anchors
⚠️ Key Warning: Geopolitical bullish signals ignored → classic "bear trap" characteristics (bear trap 🚫);
⏳ Timing Strategy: Asian session highs form ideal resistance levels—recommend entering on pullbacks to the 38.2% Fibonacci support level 🎯.
⚡️⚡️⚡️ XAUUSD Precision Trading Signals ⚡️⚡️⚡️
🚀 Long Entry Range: 3335-3345 (stop loss can be set below 3325)
🚀 Take-Profit Target Range: 3360-3370 (partial profit-taking at first target 3360 recommended)
📢 Service Value-Added Notes
✅ Core trading signals updated daily in the morning (validated across 4-hour/daily double-timeframes);
✅ Refer to signal logic at any time during trading for sudden situations 🧭 (with historical win-rate statistics attached);
🌟 Wishing you smooth trading Next week — seize pullback opportunities to position 👇
Xauusdidea
XAUUSD:Go long before you go short
Yesterday's market is relatively fast, we pay attention to the stop profit point, today's Asian plate fell, technical point of view, this week after the big Yin, there is little strength of the rebound, often after the reverse draw will be recovered, the same down after the rapid counterattack, short-term overall performance for the shock downward trend, the center of gravity moving down.
The trading space is also gradually shrinking, within the day can be around 3340-3370 range to operate.
Trading Strategy:
BUY@3344-49
TP:3365-70
Consider going short at 3370-75
More detailed strategies and trading will be notified here ↗↗↗
Keep updated, come to "get" ↗↗↗

Elliott Wave Analysis – XAUUSD Trade Plan for June 19, 2025🌀 Wave Structure
On the H4 timeframe, following a strong selloff, price is now consolidating within a narrow price channel — suggesting that we are currently in wave b (black) of an abc correction.
This structure implies that one more leg down is likely to complete wave c (black). However, due to the overlapping and sideways nature of the move, it's difficult to clearly identify the end points of waves a and b, making traditional Fibonacci targeting less effective.
➡️ To improve accuracy, we’re combining Volume Profile data with price action and have identified four key support zones:
3349, 3335, 3313, and 3297
Among these, we’re giving special attention to:
🎯 Target 1: 3335
🎯 Target 2: 3297
We'll wait for bullish momentum signals near these levels to increase the probability of catching the end of wave c.
🔋 Momentum Outlook
Daily (D1): Momentum is about to enter oversold territory. By the end of today or tomorrow, the daily candle is expected to confirm this — suggesting a weakening bearish trend.
H4: Also approaching oversold. If price is hovering around one of the key support levels (3349 | 3335 | 3313 | 3297) when this happens, and the D1 is already oversold, then we may be looking at a high-probability reversal zone.
H1: Nearly oversold as well — expect a short-term bounce soon. The best timing for a BUY will be when the H1 starts turning bullish while both the D1 and H4 are oversold.
✅ Trade Setup
🔹 Scenario 1
BUY ZONE: 3336 – 3333
SL: 3326
TP1 | TP2 | TP3: 3345 | 3378 | 3402
🔹 Scenario 2
BUY ZONE: 3300 – 3297
SL: 3290
TP1 | TP2 | TP3: 3313 | 3345 | 3402
⏳ Patience is key — wait for confluence between support zones and momentum reversals. That’s where the high-probability BUY setups emerge.
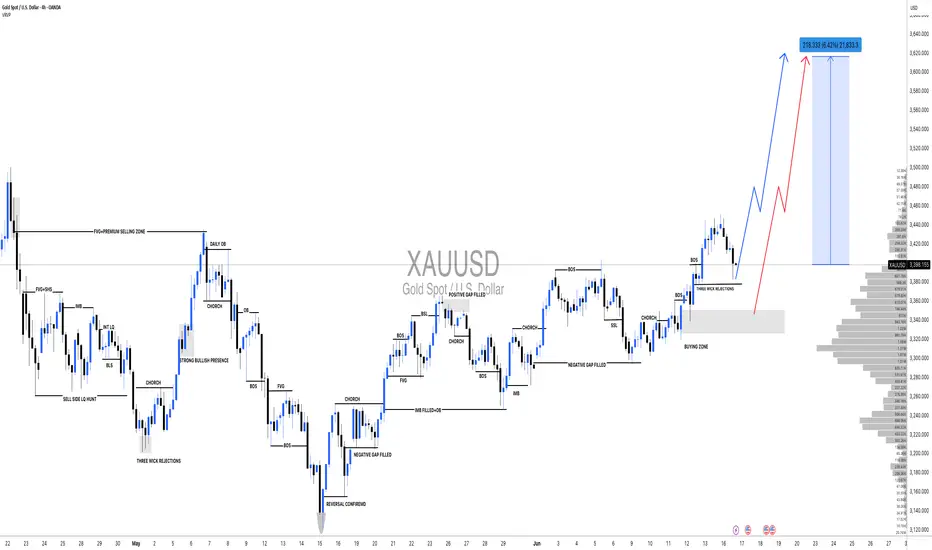
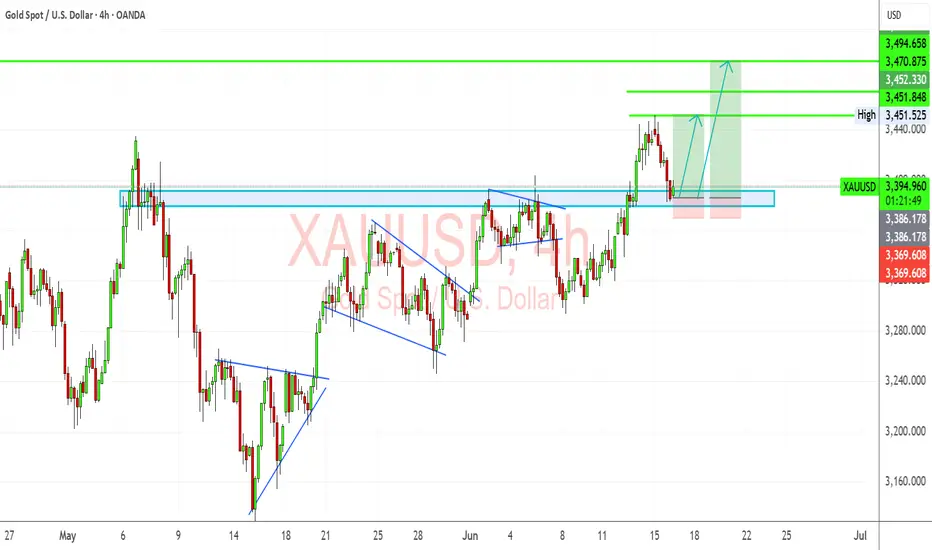
XAUUSD: Is Bullish Trend Ended? Or It is just beginning big moveAs we previously stated that price can reverse between 3340 to 3350 region, which was a pivotal point for bulls. Price smoothly moved currently trading at 3376 and possibly bullish move continuing towards 3400,3450 and ultimately reaching 3600.
Following the price’s all-time high at $3500, it experienced a sharp decline and failed to maintain that level. A substantial 2400 pips would have resulted in significant losses for many accounts. Initially, it was perceived as a minor correction, with the expectation of further price appreciation. However, this assumption proved incorrect. After reaching an even higher peak, the price invariably undergoes a more substantial correction.
At 3260, substantial bullish volume surged into the market, necessitated by the presence of a fair value gap. Subsequently, the price experienced a decline, reflecting the prevailing bearish trend, which favoured the bears. However, at 3200, a pivotal level representing a discounted price point, bull volume surged. This powerful bullish impulse propelled the price to 3432, ultimately confirming the bullish trend. AB=CD there recurring pattern emerged weekly. When the price reached the 3432 level as a fair value gap, the CD pattern commenced.
AB=CD we have identified a recurring pattern. It appears to be an equal move in any direction, and it has manifested precisely as anticipated. We were aware that the price would reject at 3120, and it did so accordingly. Currently, the market is in our favour. Upon market opening, it exhibited a positive gap, propelling the price to 3450. However, it subsequently declined, reaching 3384.
Presently, we find ourselves in the accumulation phase, poised for distribution. This distribution is anticipated to be substantial, potentially leading to another record high, potentially reaching 3650.
Moving forward, the price could continue towards our target from its current position. Alternatively, there exists a possibility that it may drain the sell-side liquidity and reverse from 3360-3370.
Our take-profit levels are set at 3450, 3490, 3520, and finally, 3600. When entering the market, it is advisable to employ a short time frame. It is important to note that this analysis is merely our opinion, and market conditions may deviate from expectations.
We extend our best wishes for success and safe trading. If you wish to demonstrate your support, you may consider liking, commenting, or sharing this analysis with others.
Sincerely,
Team Setupsfx_
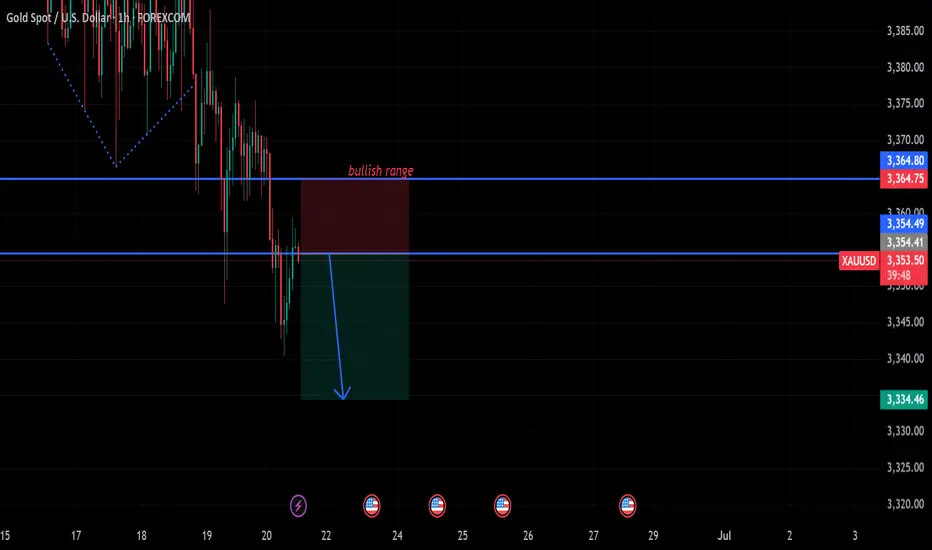
gold on sell#XAUUSD price await breakout below 3354.5 for selling.
Below 3354.5 have low bearish which will drop firstly below 3346-3334.46, SL 3364.8
Below 3345 have a strong bearish continuation which will drop more. Any possible buy above 3364.8 on H1 closure will start bullish from there.
Gold Broke Out – Another Drop Loading?OANDA:XAUUSD TVC:GOLD Gold is attempting a rebound but faces strong resistance near $3,364–$3,368, where previous support converges with the descending trendline (TL1). A clear rejection here could resume the bearish momentum.
Technically, the price is hovering just below the TL1 resistance. The zone around $3,368 is critical — if bulls fail to reclaim this area, we could see a move back toward the $3,326 support, with a deeper target near weekly support at $3,310.
📉 A rejection around current levels = high probability drop
📈 Break and hold above TL1 = potential short-term reversal
🧠 Macro Check:
Despite intensifying Middle East tensions (Israel-Iran conflict escalating, Trump weighing intervention), gold remains under pressure. The Fed’s hawkish hold, persistent inflation, and a strong dollar continue to weigh on bullion in the near term.
🔍 Key Levels:
Resistance: $3,364–$3,368 (structure + TL1)
Support: $3,326 / $3,310
Bias: Bearish below $3,368
Setup Idea: Watch for rejection near resistance for short setups toward $3,326 and $3,310

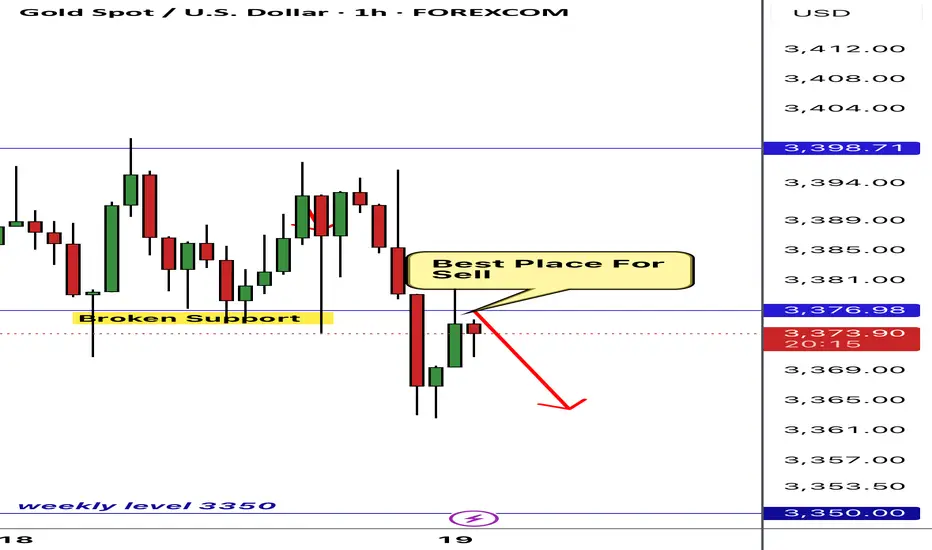
GOLD Finally Breakout , Short Setup Valid To Get 200 Pips !Here is my opinion , after this amazing 4H / Daily Breakout , we should sell Gold From Area Between 3377.00 / 3375.00 And Targeting 250 Pips At Least .
Fed Rate Decision: Gold's 3,400 Threshold as Bull-Bear DivideToday, the market has consolidated in a range throughout the day, with neither price direction nor volatility breaking through the range. However, our trading approach proved accurate: short positions were initiated near 3,400 during rebounds, and long positions were entered near the key level of 3,370 during pullbacks. Investors following our strategy have achieved profits from both directions. With limited price movement currently, the Fed's interest rate decision due to land in an hour will become the core variable dominating the market trend for the rest of the month.
Currently, gold prices continue to trade below the 3,400 threshold, maintaining a weak market structure. The 3,400 level serves as a key watershed between bulls and bears, and the validity of its breakthrough will determine the trend inflection point: if prices effectively hold above 3,400 after the data release, it indicates that gold will break out of its weak pattern, with the potential for an accelerated rally ahead. Conversely, if prices remain suppressed below 3,400, it is highly likely to trigger further downward exploration. It is recommended to closely monitor the breakthrough signal at the 3,400 threshold after the data release, using this as the operational basis for trend switching.
XAUUSD
buy@3370-3380
tp:3400-3420-3450
Investment itself is not the source of risk; it is only when investment behavior escapes rational control that risks lie in wait. In the trading process, always bear in mind that restraining impulsiveness is the primary criterion for success. I share trading signals daily, and all signals have been accurate without error for a full month. Regardless of your past profits or losses, with my assistance, you have the hope to achieve a breakthrough in your investment.
XAUUSD:Today's Trading Strategy
Yesterday, gold prices fluctuated greatly in the US, and around 3400 has become an important pressure level at present. If you want to short, you can consider 3395-3400. At present, the price is near 3362, and the trading idea is mainly long first.
Trading Strategy:
BUY@3357-62
TP:3375-80
↓↓↓ More detailed strategies and trading will be notified here ↗↗↗
↓↓↓ Keep updated, come to "get" ↗↗↗

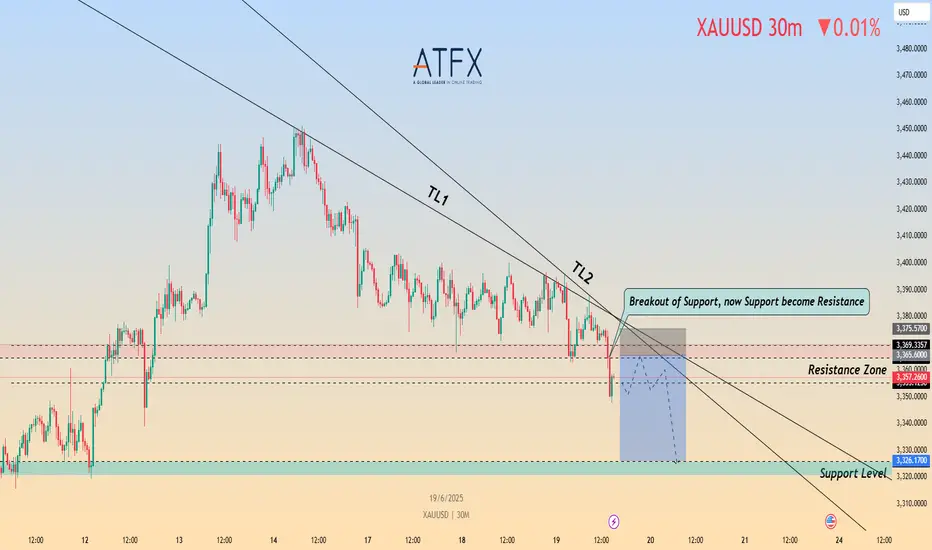
Gold Slips Below Key Support – Is $3,326 Next?OANDA:XAUUSD TVC:GOLD Gold has broken beneath the $3,365–$3,369 support zone, which now aligns with descending trendlines TL1 and TL2 acting as resistance. The 30-minute chart confirms a clean bearish breakout and retest, signalling potential continuation toward lower support near $3,326.
🎯 Short Setup
Entry: $3,365 (retest of broken support / trendline confluence)
Stop: $3,375 (above TL2 and intraday highs)
Target 1: $3,330
Target 2: $3,326
R:R: ~1:3.95
📊 Technical Context
• Price is capped below the $3,365–$3,369 supply zone
• Trendline resistance (TL1, TL2) remains intact from mid-June
• Structure favours continuation lower as long as price stays beneath the retest zone
🌐 Fundamental Backdrop
• Fed held rates steady, but Powell’s tone remained hawkish, warning of “elevated inflation” — supporting USD strength
• Rising Middle East tensions (Israel-Iran conflict) offer safe-haven bids, but not enough to break resistance
• Trump’s tariff threats and criticism of Fed policy add macro uncertainty — mildly supportive of gold in the longer run
📘 Trade Bias
As long as gold holds below $3,365, the bearish thesis remains intact. A sustained push above $3,375 would invalidate the setup and signal a potential reversal or breakout retest.
⚠️ Disclaimer
This analysis is for educational purposes only. Always do your own research and consult a licensed advisor before making financial decisions.
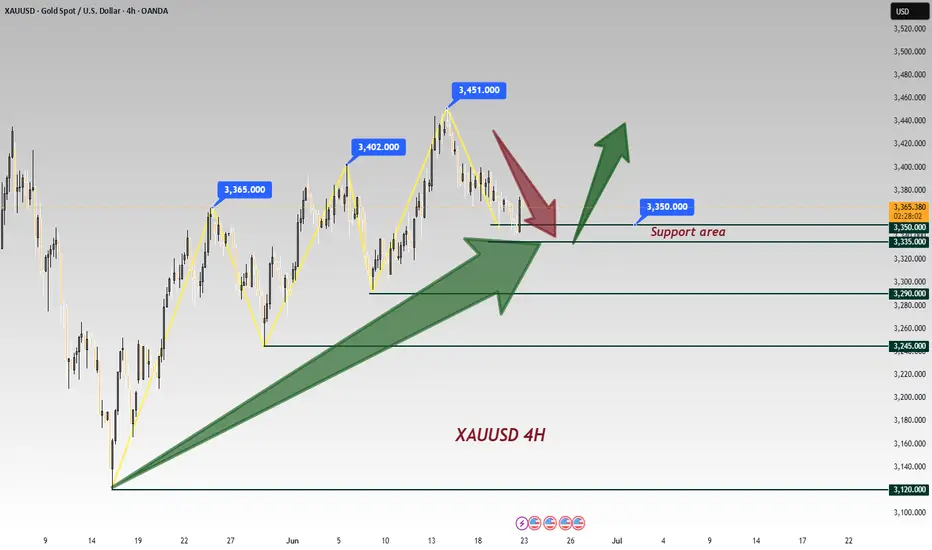
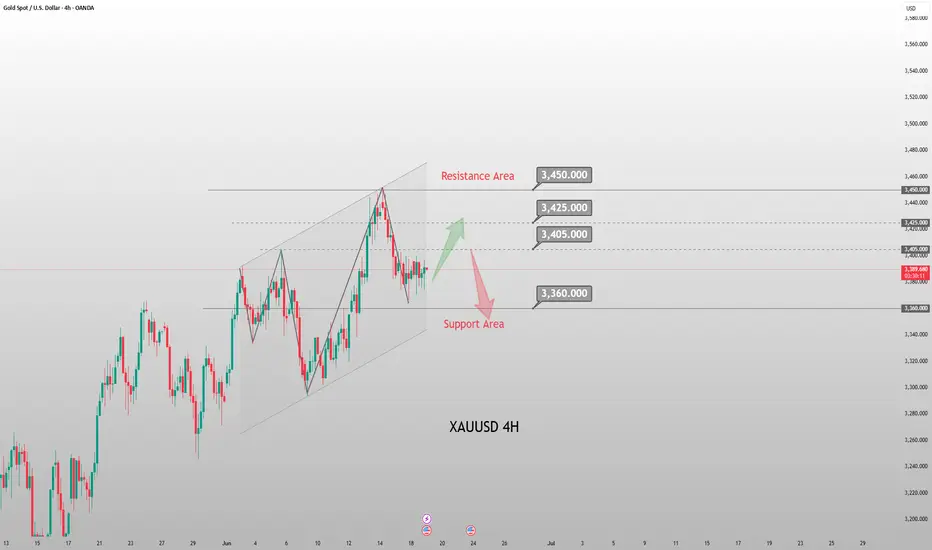
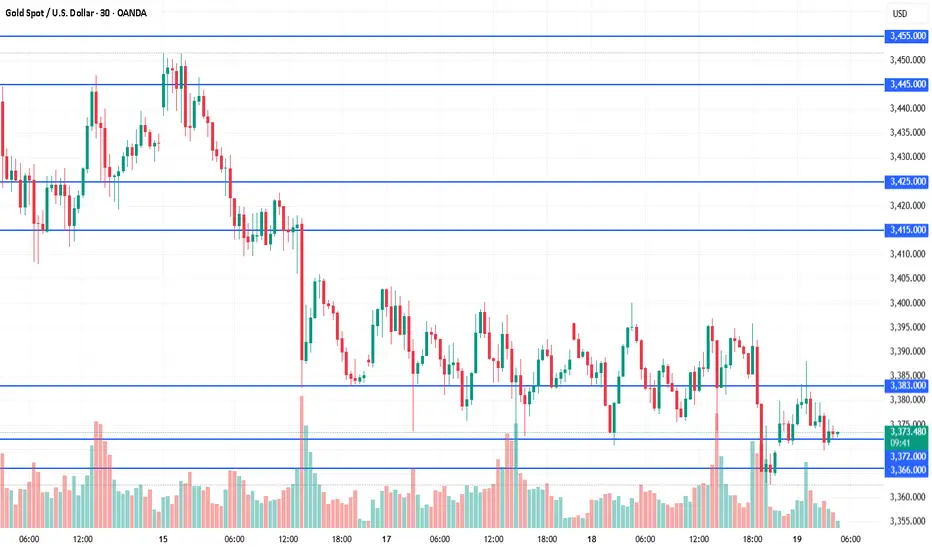
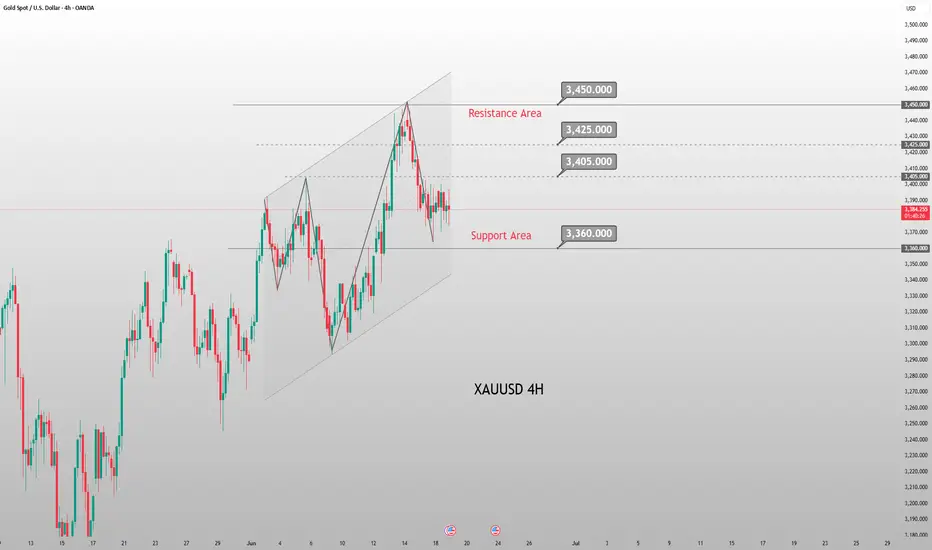
XAU/USD 4H Market Analysis- 19 June 2025XAU/USD 4H Market Analysis
Market Structure: Gold has been in a mild uptrend on the 4‑hour chart, making higher lows and highs since early June. The recent swing high was around ~$3,428 (mid-June), and price has pulled back toward the rising support line near ~$3,373.
A break above the recent high (around $3,404–$3,428) would continue the bull trend; conversely, a drop below the ~3,373 trendline/50% Fib level would signal a bearish turn.
In other words, bulls remain in control as long as ~$3,373 holds – breaking that would threaten lower support around ~$3,338.
Overall Bias: Moderately bullish on 4H. Gold is respecting its rising trendline and 50-period EMA, and analysts note that holding above ~$3,373 keeps the uptrend intact.
Momentum (MACD) is neutral to slightly bearish short-term, so we expect consolidations and range bounces more than a reversal.
In summary, assume an upward bias while price stays above key support near $3,370–$3,380; a firm break below would flip bearish.
Key SMC/Zones:
Price is currently in a range/consolidation roughly between $3,370 and $3,400.
Important zones include:
Demand (Support) Zone:
~ $3,368–$3,378 — this 50% Fib retracement area has been defended as a bullish order block.
Below that, stronger supports sit near ~ $3,354 and $3,333 .
Supply (Resistance) Zone:
~$3,395–$3,415 — a cluster of swing highs and Fib levels. Analysts highlight $3,395, $3,412, $3,435 and even $3,450 as major resistance barriers.
In particular, the $3,400 level is a known psychological and technical ceiling.
Trendlines/BOS: The rising 4H trendline (currently near $3,370–$3,380) is key support.
A break of structure (BOS) below that line would be a bearish Change-of-Character. Similarly, the prior swing low around $3,373 is a flip zone – bulls want to keep that hold.
Liquidity: Stop-loss/liquidation clusters may lie just above recent highs ($3,428–$3,450) and just below recent lows ($3,338–$3,354). For example, stops above $3,428 could fuel a rally if hit, and stops below $3,338 could accelerate a drop.
In short, high-probability zones on the 4H chart are around ~$3,370 (demand/support) and ~$3,400 (supply/resistance).
We’ll look for trades that align with that structure (see setups below).
1H Trade Setups (Aligned with 4H Bias)
Long around $3,370–3,375 (Buy Dip to Demand Zone) –
Entry: ~3,370–3,375 (green zone). Stop: ~$3,365 (≈$5 below zone). Take-Profit: $3,380 first, then $3,390–$3,400.
Reason: This zone is a 4H demand area (50% Fib + order block) and coincides with the rising 4H trendline.
Price has repeatedly bounced here, so a bullish reversal is likely.
Trigger: Look for a bullish 1H signal (e.g. engulfing or pin bar) at ~3,370–3,375, or a break of the short-term 1H down-structure.
Entry on such a signal would target a retest of the mid-range (~3,380) and beyond toward resistance.
Short around $3,395–3,400 (Sell Rally to Supply) –
Entry: ~3,395–3,400 (red zone). Stop: ~$3,405 (≈$5 above zone). Take-Profit: $3,375 first, then $3,365.
Reason: This area is a clear 4H supply zone (near multiple Fibonacci levels/resistance).
It’s just below the $3,400 psychological barrier. A failure or bearish reversal here would likely send price back toward the demand zone below.
Trigger: Watch for a bearish 1H candle or a break of the short-term 1H up-structure in the 3,395–3,400 range. A clear rejection (e.g. bearish engulfing or strong wick) would be the signal to enter short.
(Note: If price breaks cleanly above $3,405–3,410 instead, a bullish continuation trade would then be favored, targeting $3,415+.)
Takeaway: Trade gold with the 4H structure in mind. With price above the ~$3,370 trend support, favor longs on pullbacks into that demand zone and shorts only at proven supply near $3,400. Always use a tight ~$5 stop beyond each zone and scale out at logical pivot levels to manage risk.
Current Gold Trend Analysis and Trading RecommendationsOn Wednesday, the morning strategy suggested going long on gold at 3,375-3,365, perfectly seizing the pullback low and rebounding to the 3,400 level as expected. Today, there is also the Fed interest rate decision. Before the data release, short positions can be taken if the 3,400-3,405 level remains unbroken. If the 3,405-3,410 level is broken, we will continue to be bullish. Gold is in short-term oscillation, so try not to chase the market. Wait for a good entry opportunity. The upper level has also been repeatedly contested recently, and the Fed data is likely to break the range after its release.
For gold, continue to adopt an oscillating approach. In the 4H cycle, it is operating below the middle band. The short-term range is 3,405-3,365. If it breaks above 3,405, it can continue to target 3,420 and 3,450. Conversely, if it breaks below 3,365, it can fall to 3,350. In operation, prioritize long positions with short positions as a supplement, and adjust the strategy when a breakout occurs.
XAUUSD
buy@3370-3375
tp:3390-3400-3420
sell@3395-3400
tp:3380-3370
Investment itself is not the source of risk; it is only when investment behavior escapes rational control that risks lie in wait. In the trading process, always bear in mind that restraining impulsiveness is the primary criterion for success. I share trading signals daily, and all signals have been accurate without error for a full month. Regardless of your past profits or losses, with my assistance, you have the hope to achieve a breakthrough in your investment.
GOLD Made Inverted H&S Pattern , Long Scalping Ready !Here is my 15 mins chart on gold and we have a reversal pattern , ( inverted head & shoulders ) and we have a clear closure above our neckline so we can buy it to get the target and then wait for the news tonight and then decide the new direction after news effect .

XAUUSD:Go long
As can be seen from the chart, the decline of gold actually did not fall below 3380 each time, the actual close longer lower shadow, and from yesterday's trend can be seen 3400 is a certain pressure exists, so today to see whether this position can break through. After the break, we continue to look up, and then increase the trading range.
For now or first around the narrow range to trade.
Trading Strategy:
BUY@3378-84
TP:3395-3400
↓↓↓ More detailed strategies and trading will be notified here ↗↗↗
↓↓↓ Keep updated, come to "get" ↗↗↗

gold on bullish reverse#XAUUSD buy below 3375-3377, but firstly we wait for 3375 to touch before buying.
Target 3406, stop loss at 3365
Below the 3365 holds bearish flag which will continue falling till 3349.

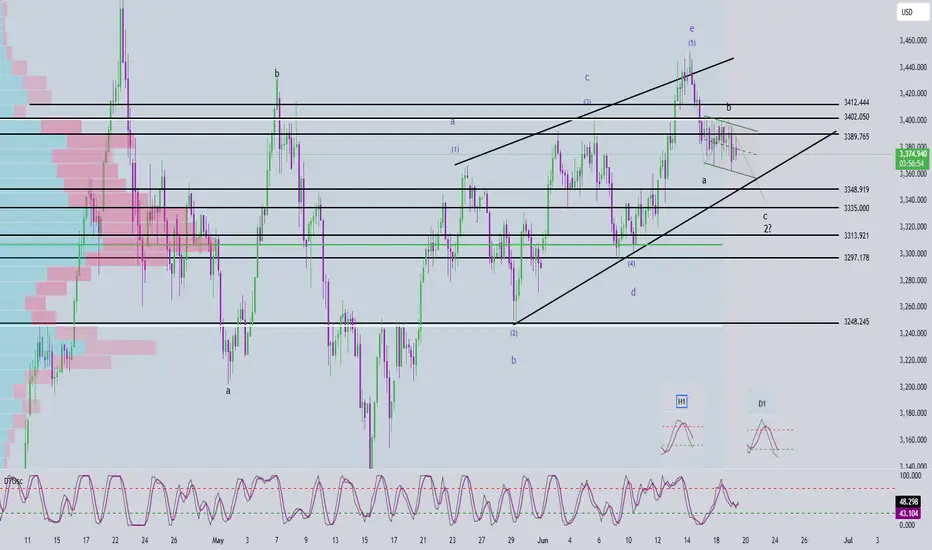
Elliott Wave Analysis – XAUUSD | June 18, 2025🌀 Current Wave Structure on H4
The recent drop has broken below the previously labeled wave 1 zone, requiring an adjustment to our wave count. Following the abc corrective move (black), a potential triangle formation is emerging.
At this point, we’re monitoring two possible scenarios:
🔹 Scenario 1 – Triangle as a Wave X Correction:
Price is forming an abcde triangle, potentially part of a larger WXY corrective structure. If this plays out, we may see a strong decline forming wave Y, targeting a break below 3297, and possibly extending to 3248.
🔹 Scenario 2 – Leading Diagonal Triangle as Wave 1:
If this is a leading diagonal triangle for wave 1, then wave 1 is likely completed, and we are currently in wave 2. In this scenario, price should hold above 3248, with likely support zones around 3335 or 3300.
🎯 Key Price Zones & Resistance Levels
Major Resistance: 3389 – 3402 (based on volume profile) – prime area for potential short setups.
Short-term Resistance Levels: 3389, 3402, 3412 – watch for reversal signals here.
🔻 Momentum Outlook
Daily (D1): Momentum is declining and expected to enter oversold territory within 2 candles – indicating a weakening downtrend and supporting the leading diagonal scenario.
H4: Momentum is preparing to turn bearish – supports short opportunities.
H1: Already turned bullish – suggests a possible corrective bounce before the next drop.
📌 Trade Plan
🔴 Sell Zone: 3400 – 3403
• SL: 3410
• TP1: 3365
• TP2: 3335
🟢 Buy Zone 1: 3335 – 3332
• SL: 3325
• TP1: 3365
• TP2: 3402
🟢 Buy Zone 2: 3302 – 3209
• SL: 3292
• TP1: 3335
• TP2: 3365
• TP3: 3402

XAUUSD:A long trading strategy
Yesterday was affected by the easing signal gold high continued to correction, fell back to 3400 again, the trend exceeded personal expectations. Gold received another boost after the president's news, and rebounded slightly in the Asian session. In this eventful autumn, the market is subject to frequent news factors, the trend is slightly turbulent, to be ready to sweep back and forward.
Today's overall volatility is expected to have a contraction, individual expectations of the final close of the small negative line is more likely
Trading Strategy:
BUY@3380-85
TP:3404-3410
↓↓↓ More detailed strategies and trading will be notified here ↗↗↗
↓↓↓ Keep updated, come to "get" ↗↗↗
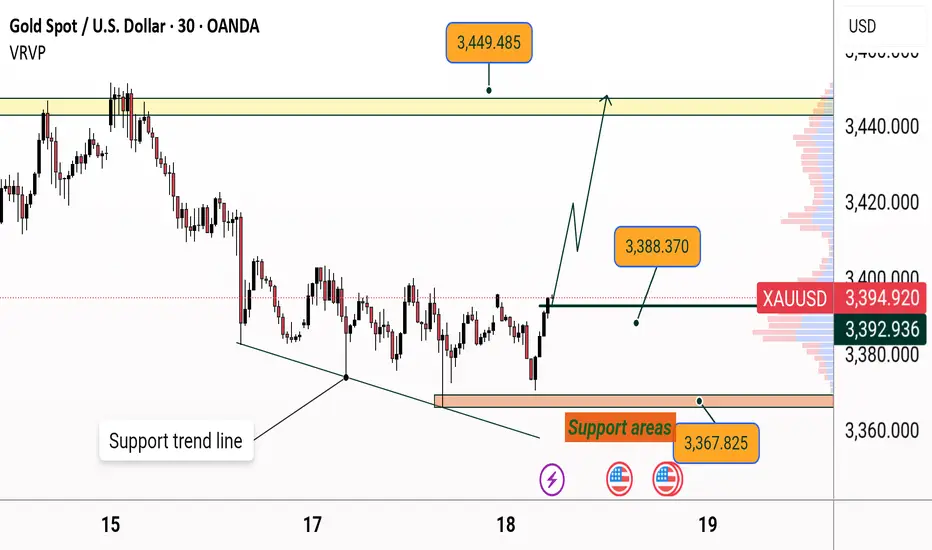
XAU/USD Bullish Reversal Toward 3,449XAU/USD Technical Analysis (30-Minute Chart)
This chart shows a bullish breakout setup for Gold (XAU/USD) based on recent price action and technical indicators:
---
🔻 Support Zone & Trend Line:
A descending support trend line has been drawn from earlier lows, showing a falling wedge structure.
The key support zone between 3,367.825 and 3,388.370 has held firmly, confirming demand in this range.
📈 Bullish Reversal Formation:
Price bounced off the support zone, suggesting a potential reversal.
A breakout above the horizontal resistance near 3,388.370 is projected, with bullish momentum forming.
🎯 Target Levels:
Immediate resistance: Around 3,388.370, which price is currently testing.
Primary target: The yellow resistance zone near 3,449.485—if broken, it may confirm a strong upward trend.
📊 Volume Profile:
Volume bars on the right show higher trading activity above 3,400, indicating potential resistance in that region.
📝 Summary: Gold is showing signs of a bullish reversal from the support trend line and key demand zone. A sustained move above 3,388.370 may lead to a rally toward the 3,449.485 resistance area.
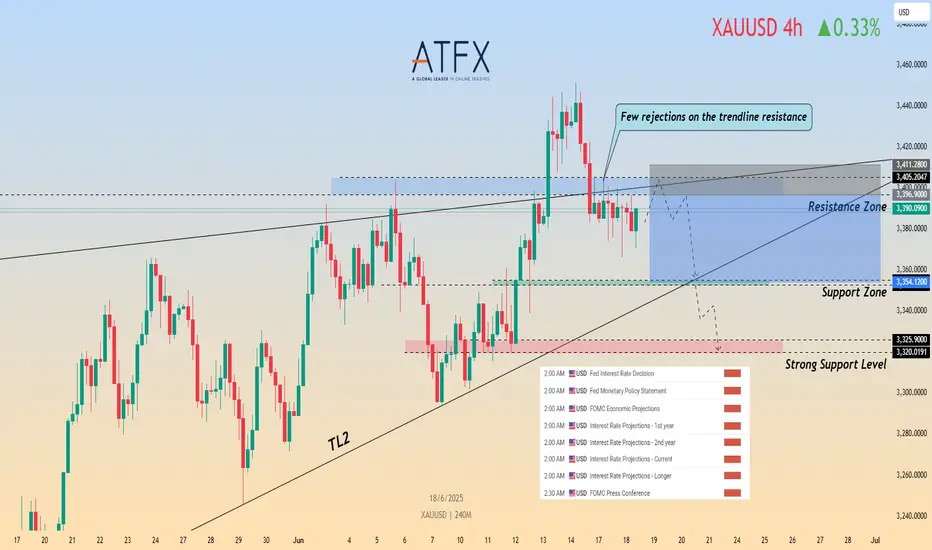
Short Opportunity on XAU/USD: Fed & Conflict Drive Next MoveTVC:GOLD OANDA:XAUUSD XAU/USD is showing multiple rejections at the key resistance confluence of the trendline (TL1) and the $3,396–$3,405 zone. Price remains capped below this level while supported by TL2, with downside potential toward $3,354 and $3,326 if bearish pressure persists. A short setup is in play: entry at $3,396, stop at $3,411, and targets at $3,354 and $3,326, offering a favorable 1:2.97 risk–reward. Invalidation occurs on a 4H close above $3,411, which could open the path to $3,450+. Geopolitical risk remains elevated as the Israel–Iran conflict enters day six, with airstrikes near Tehran and speculation of U.S. involvement following President Trump’s emergency security meeting. Meanwhile, the upcoming Fed decision is key; while no rate move is expected, markets are focused on the updated dot plot and Powell’s tone amid ongoing tariff uncertainty. Long-term support for gold is reinforced by a World Gold Council survey showing 95% of central banks expect global reserves to rise, with a record 43% planning to increase holdings. Short-term bias remains cautiously bearish while below resistance, but any dovish Fed surprise or escalation in conflict may reverse momentum.
Resistance : $3,396 , $3,405
Support : $3,354 , $3,325, $3,320
XAUUSD!UP!As I expected, the market remains volatile. It needs an opportunity to continue to rise.
I will update this kind of information in the swing trading center. If you don't want to miss such precise trading opportunities, remember to stay tuned.
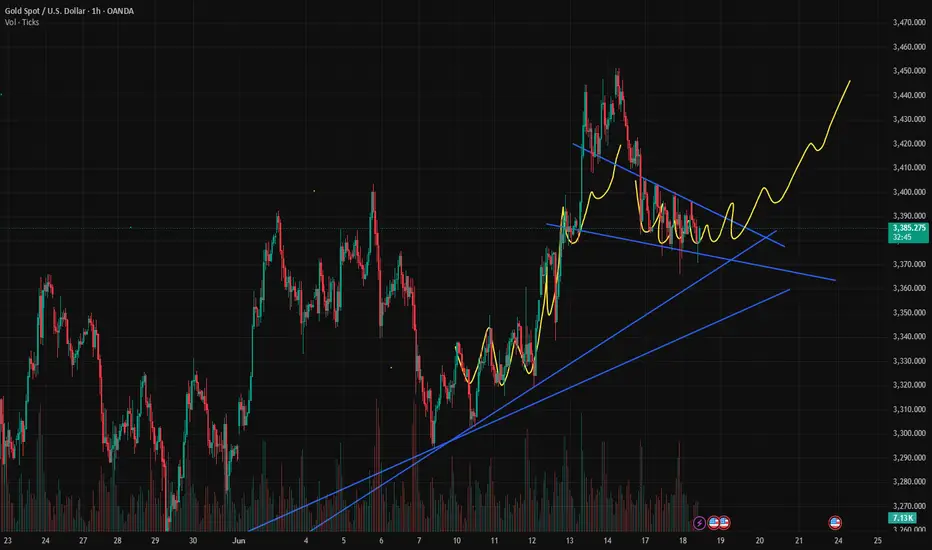
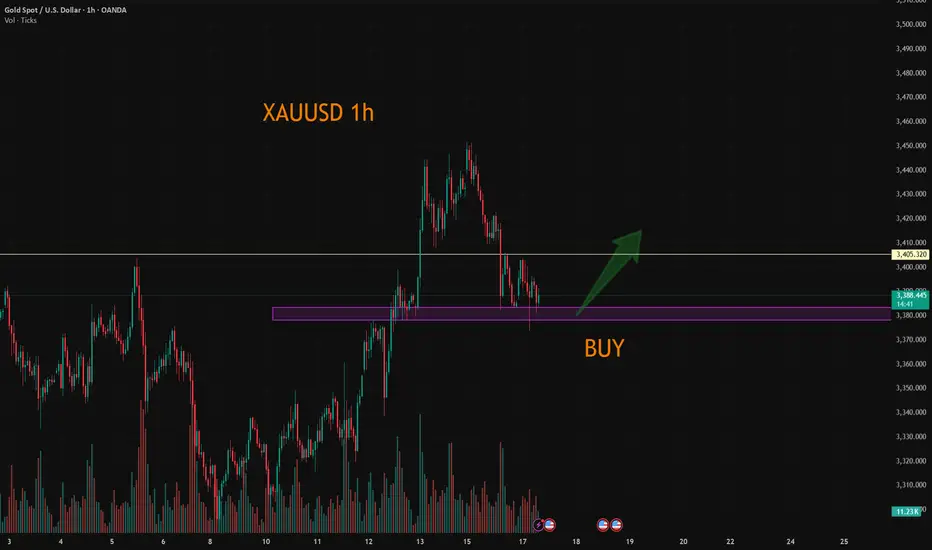
XAUUSD Long Setup – Retest of Broken Structure & Safe-Haven FlowGold has pulled back to retest a strong former resistance (now support) zone around $3,385–$3,390. This level aligns with a previous breakout and marks the neckline of an inverted head-and-shoulders pattern. The pair is now showing bullish structure with back-to-back continuation patterns (bull flags), suggesting further upside potential.
Given escalating geopolitical risk (Iran-Israel strikes, Trump-led evacuation urgency), slowing Fed cut expectations, and softening inflation-adjusted yields, gold remains in demand.
🔍 Technical Analysis:
Structure: Higher highs and higher lows maintained.
Support Zone: $3,385–$3,390 (retest zone) – bulls stepping back in.
Targets:
TP1: $3,451
TP2: $3,470
TP3: $3,495 (new local high)
Stop Loss: Below $3,369 (recent low)
Pattern Context: Bull flags continue to form and break bullish – reinforcing trend.
🧠 Fundamental Context (June 17):
Bullish Drivers:
Middle East escalation → safe haven bid surging (Iran missile launches, Israeli retaliation, US political chaos).
Fed on pause → real yields are subdued, favoring non-yielding assets like gold.
Convexity & bond volatility rising → investors hedging with hard assets (confirmed via CME sentiment reports).
Risks:
Sudden peace deal or ceasefire.
Unexpected US CPI spike → reawakens rate hike fears.
📅 Key Events to Watch:
Fed speeches (confirmation of dovish tone)
Any ceasefire or major diplomatic development
Oil movement (energy risk spillovers)
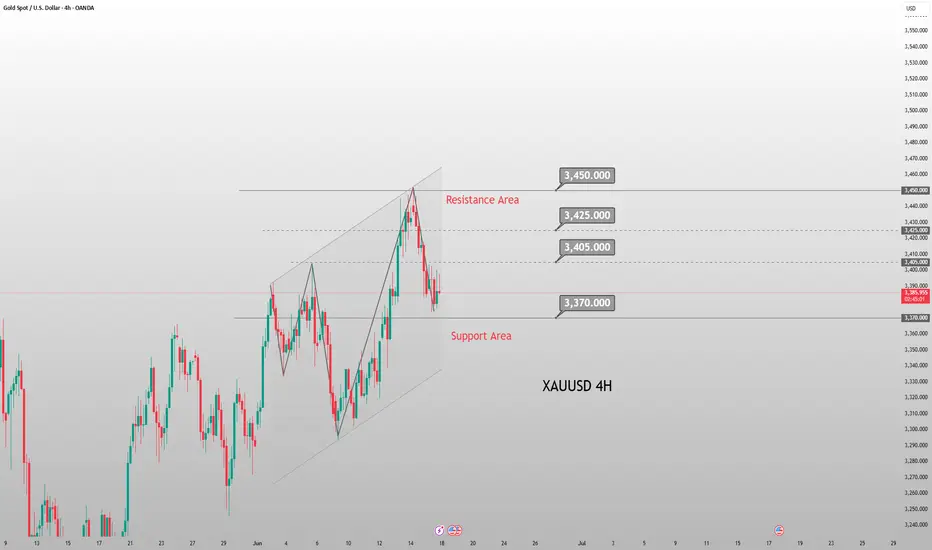
Current Gold Trend Analysis and Trading RecommendationsGold showed a pullback after hitting a high yesterday, with a daily decline of nearly 70 USD. The daily candlestick pattern completely engulfed the previous day's gains and closed bearish. Combined with the current signals of geopolitical tensions, today's market is expected to be dominated by broad-range consolidation. From the 4-hour cycle perspective, the price broke below the middle Bollinger Band with consecutive bearish candles last night and continued to decline after being suppressed in the early morning, with technicals pointing to a consolidative and bearish pattern.
The key pivot level today is at 3,405: if the market effectively stabilizes above this level, the upper resistance will test 3,420 and 3,430 in sequence; conversely, if the suppression at 3,405 holds, the price is likely to repeatedly test the support at 3,380 and further dip to the 3,370-3,360 zone. It is recommended to wait for the decline momentum to clarify before initiating long positions, maintaining an overall range-trading strategy.
XAUUSD
buy@3375-3380
tp:3390-3400-3420
Investment itself is not the source of risk; it is only when investment behavior escapes rational control that risks lie in wait. In the trading process, always bear in mind that restraining impulsiveness is the primary criterion for success. I share trading signals daily, and all signals have been accurate without error for a full month. Regardless of your past profits or losses, with my assistance, you have the hope to achieve a breakthrough in your investment.
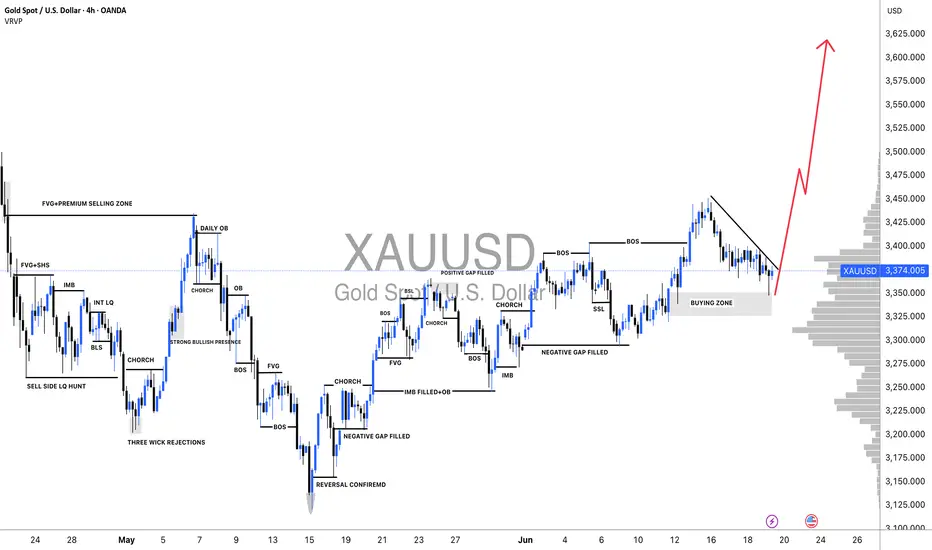
XAUUSD: Accumulation in process,Waiting for Bullish DistributionHello,
Today, we will analyse the key points of each significant move.
Following the price’s all-time high at $3500, it experienced a sharp decline and failed to maintain that level. A substantial 2400 pips would have resulted in significant losses for many accounts. Initially, it was perceived as a minor correction, with the expectation of further price appreciation. However, this assumption proved incorrect. After reaching an even higher peak, the price invariably undergoes a more substantial correction.
At 3260, substantial bullish volume surged into the market, necessitated by the presence of a fair value gap. Subsequently, the price experienced a decline, reflecting the prevailing bearish trend, which favoured the bears. However, at 3200, a pivotal level representing a discounted price point, bull volume surged. This powerful bullish impulse propelled the price to 3432, ultimately confirming the bullish trend. AB=CD there recurring pattern emerged weekly. When the price reached the 3432 level as a fair value gap, the CD pattern commenced.
AB=CDTheHeyIndeed, we have identified a recurring pattern. It appears to be an equal move in any direction, and it has manifested precisely as anticipated. We were aware that the price would reject at 3120, and it did so accordingly. Currently, the market is in our favour. Upon market opening, it exhibited a positive gap, propelling the price to 3450. However, it subsequently declined, reaching 3384.
Presently, we find ourselves in the accumulation phase, poised for distribution. This distribution is anticipated to be substantial, potentially leading to another record high, potentially reaching 3650.
Moving forward, the price could continue towards our target from its current position. Alternatively, there exists a possibility that it may drain the sell-side liquidity and reverse from 3360-3370.
Our take-profit levels are set at 3450, 3490, 3520, and finally, 3600. When entering the market, it is advisable to employ a short time frame. It is important to note that this analysis is merely our opinion, and market conditions may deviate from expectations.
We extend our best wishes for success and safe trading. If you wish to demonstrate your support, you may consider liking, commenting, or sharing this analysis with others.
Sincerely,
Team Setupsfx_