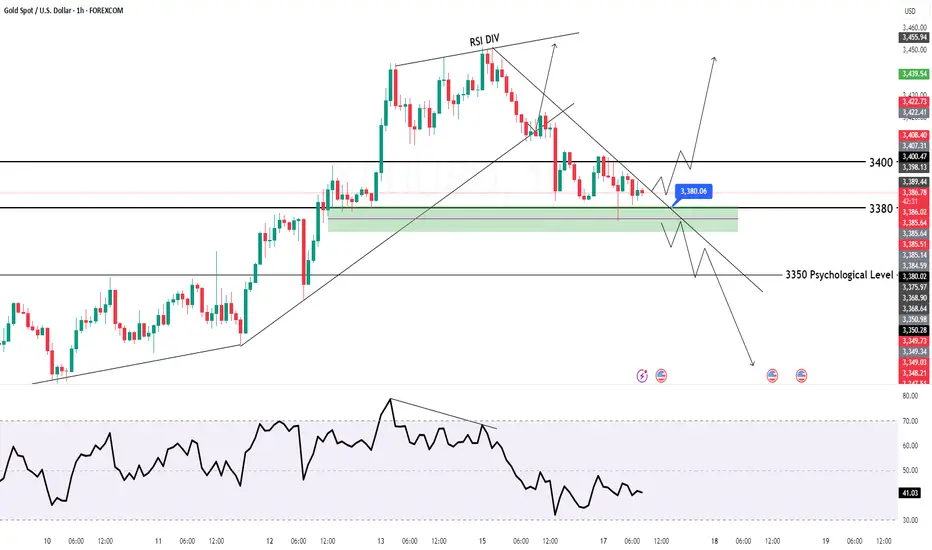
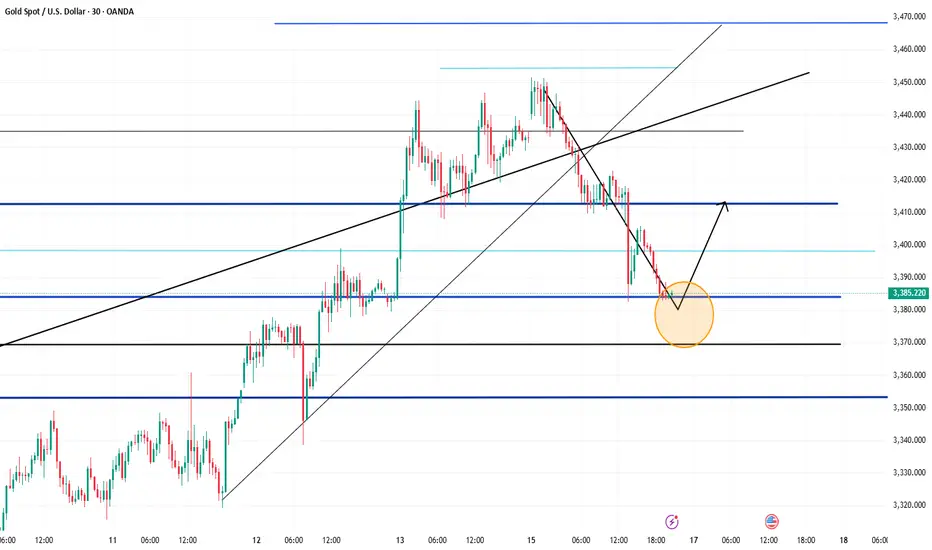
GOLD Intraday Chart for 17 June 25Hello Traders,
as you can see that market was going down very badly and it's actually stuck below 3400 Psychological Level
Definitely we are sellers now as long as market sustain below 3400 Psychological Level
below 3380 level GOLD will move towards 3360 or even 3350
Disclaimer: Forex is Risky
Xauusdidea
Have you seized the golden opportunity again and again?Today, the strength of gold is very weak. It only rushed up at the opening, and quickly fell below the 3400 mark. Keeping above the key point of 3400, gold continues to be bullish. Now that it has fallen below 3400, the short-term has gone out of the small-level top, and the market is no longer so strong. For our short-term operations, the short-term correction of gold prices focuses on the daily cycle MA5 support, and the weekly MA5 support is long. The rebound focuses on the 3403-3408 resistance card. The rebound can be followed by the short-term! Although gold has fallen below 3400, the short-term direction has changed, but the general direction has not changed. It is still bullish. In the future, we still have the opportunity to look at the high point of 3500, but we have to wait for the bottom to stabilize. Now we can only follow the trend. We will do what the market does.
From a technical point of view, the current macd high dead cross in 4 hours has a large volume, and the smart indicator sto is oversold, which represents the 4-hour shock trend. The current bollinger band three-track shrinkage in 4 hours also represents the range compression. At present, the upper pressure of 4 hours is located at the adhesion point of the middle rail and the moving average MA10 at 3404-3409, while the support corresponds to the moving average MA30 and MA10 near the 3380-3363 line. From the current 4 hours, if the price is to fall directly, the rebound will not exceed the 3420-3422.5 line. The current macd dead cross of the gold 1-hour line is shrinking and sticking, and the smart indicator sto is running downward, indicating that the hourly line continues to fluctuate weakly. What we need to pay attention to now is the adhesion pressure of the upper moving average MA60 and MA30 corresponding to the 3412 line. Pay attention to the resistance of 3403 in the short term. Today's short-term operation of gold recommends rebound shorting as the main, and callback long as the auxiliary, and pay attention to the support of 3380-3370 in the short term.

XAUUSD: The beginning of range trading.Last week, I perfectly predicted the sharp rise in the market. At the beginning of this week, XAUUSD reached a high of 3451, which is the front pressure position. Due to the cooling of risk aversion in the international market, the New York market fell back to 3373 on Monday.
XAUUSD did experience a typical "news-driven callback", and the analysis of technical and fundamental aspects is very critical. The following is a professional analysis and operation suggestions for the current market:
Key points and technical structure
1. Pressure level: 3450 area
- The previous high pressure is effective. This is the resonance resistance area of the upper track of the daily level channel + Fibonacci 61.8% retracement level, and the demand for long profit-taking is concentrated.
2. Support level: 3370-3380 area
- Currently falling back to 3373, here is:
- 50-day moving average dynamic support
- 4-hour chart previous low level support platform
- Fibonacci 38.2% retracement level
- If the daily closing is above 3380, the technical structure is still a healthy correction.
News-driven logic
- Negative factors:
Geopolitical situation and peace talks ➜ Risk aversion cools down ➜ Gold's attractiveness as a safe-haven asset decreases.
- Potential risks:
The progress of peace talks may be repeated (such as the situation between Israel and Hamas and Russia and Ukraine). If the negotiations fail, safe-haven buying will return quickly. Need to keep an eye on news sources.
Key signals for long-short game
Long signal: long lower shadow candlestick appears in 3370 area, US dollar index (DXY) falls below 105.0
Short signal: rebound fails to break through 3400 integer mark, US bond yield rises above 4.3%
Trading strategy suggestion
- *Long order opportunity*: 3370-3380 light position to try long, stop loss 3355 (below the previous low), target 3400/3420.
- *Short order opportunity*: 3415-3425 to arrange short orders in batches, stop loss 3440, target 3390.
2: Break down
- Trigger condition: daily closing price <3365
The callback is upgraded to a deep correction
- Target: 3340→ 3300 (psychological barrier + trend line support)
- Operation: Chasing short needs to wait for a rebound to around 3400, stop loss 3420.
3: Restart the rise (probability 10%)
- Trigger condition: Break through 3440 and stand firm for 1 hour
- Possible driving force: Geopolitical conflict escalates/Fed rate cut expectations rise
- Target: 3480 (historical high psychological resistance) → 3500
- Operation: After breaking through 3440, step back to 3425 to chase longs, stop loss 3405.
Key event risks this week
1. Wednesday: US May CPI data (core CPI expected to be 3.5%)
- If data > expectations: expectations of rate hikes rise → bearish for gold
- If data < expectations: expectations of rate cuts come earlier → bullish for gold
2. Thursday: Fed interest rate decision + Powell press conference
- Pay attention to the dot plot's hints on the number of rate cuts in 2024 (current market pricing is about 2 times)
3. Geopolitical headlines: progress in the Iran nuclear agreement, black swan risks in the French election
Position management principles
1. Total risk exposure ≤ 5% of account net value
2. Reduce positions by 50% 3 hours before key events (avoid instantaneous fluctuations in CPI/FOMC)
3. Breakout strategy stop loss setting: 15 points outside the previous high/low to prevent burrs
Conclusion: The effectiveness of the current 3373 support needs to be verified by Wednesday's CPI data. It is recommended that the London market operate in the 3370-3420 range and reduce positions before the US market to wait for data guidance. If you hold long positions, 3380 is the last line of defense; if you hold short positions, consider taking profits in batches above 3400. The medium-term bullish trend of gold has not been broken, but the risk aversion premium needs to be digested in the short term.
If you need a more detailed entry point analysis or position management to solve your long-term loss problem, please feel free to tell me your trading cycle and risk preference, and I will provide you with a customized strategy.
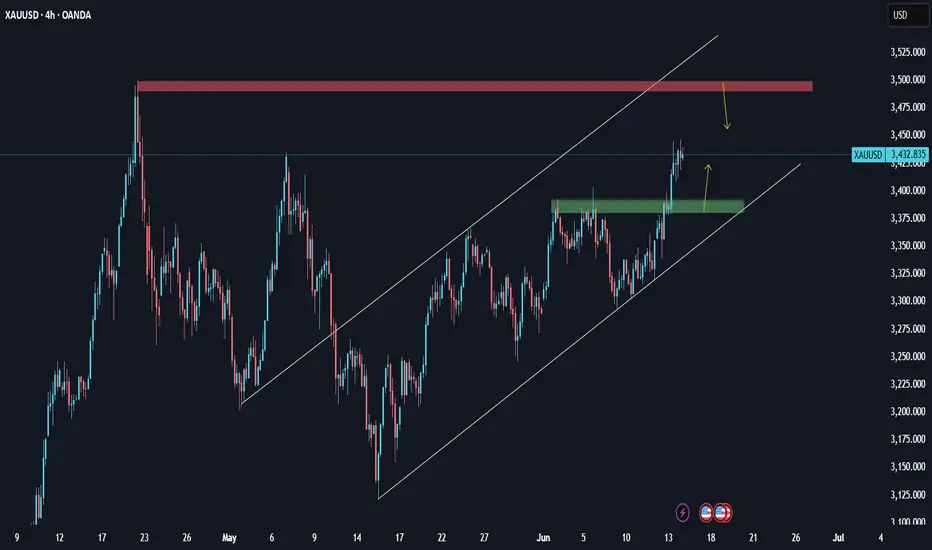
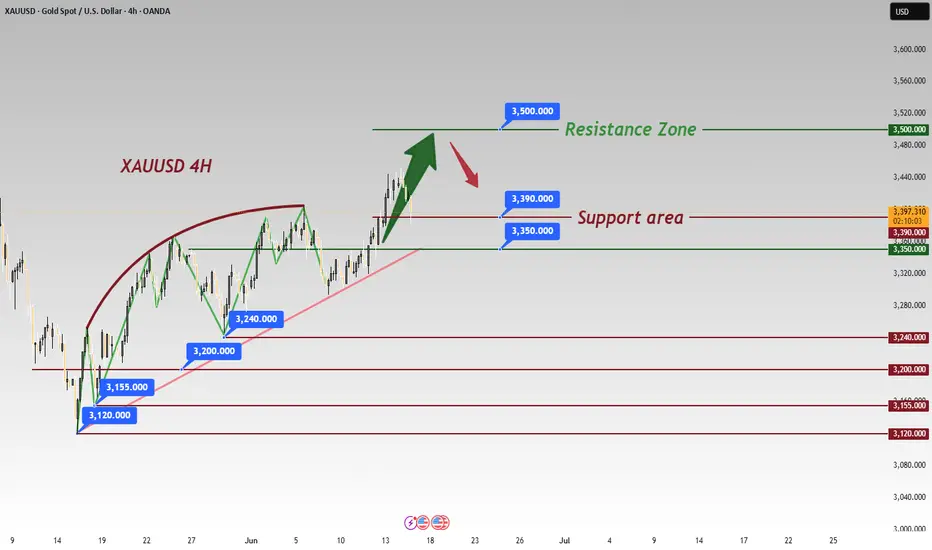
XAUUSD: Analysis H4 next weekThe continued tension in the Middle East (Israel–Iran) has led to a flight to safe havens, a key driver for gold.
Reduced pressure from the USD due to expectations that the Fed will slow down its rate cut (~September), coupled with inflationary pressures, could support gold prices
If tensions in the Middle East do not ease next week, gold's rally could extend and we could see 3500. But be careful, as if tensions ease and some good news from the USD comes, the rally could be halted.
Fed Rate Decision May Trigger a Decline in Gold PricesDespite heightened tensions in the Middle East providing safe-haven support, gold failed to break through the 3450–3455 resistance zone today and instead pulled back to the 3400–3386 support area.
This decline was mainly driven by two factors:
Iran expressed willingness to resume nuclear talks, easing geopolitical tensions and weakening safe-haven demand.
Growing expectations that the Fed will keep rates unchanged this week strengthened the DXY, reducing gold's appeal.
That said, inflation concerns persist, offering medium-term support to gold. On the technical front, the 3378–3340 consolidation zone may serve as secondary support, while stronger trend support lies in the 3310–3289 range—a level that may only be tested under extreme bearish conditions.
For now, the primary support to watch is 3386–3373, with short-term rebound resistance around 3400–3420.
Trading Suggestion:
Ahead of the Fed’s rate decision tomorrow, consider buying on dips, as today’s decline may lead to a technical rebound. Then reassess the market’s response to key support and resistance levels to determine further action.
Iran seeks peace, Israel strikes – Gold dip, buy opportunity🌍 Iran's peace overtures sent gold prices plummeting to 3382, but Israel is unlikely to accept the olive branch lightly. With no clear signs of de-escalation in the Middle East situation, it's advisable to continue going long at lower levels 📉→📈
Israeli PM Benjamin Netanyahu vows military strikes will continue until Iran's nuclear program and ballistic missile capabilities are fully dismantled—showing no signs of halting ⚡. While he claims regime change is not the objective, he notes that given the weakness of Iran's leadership, political upheaval could emerge as a collateral outcome of the operations 🌪️
🌍 Currently, only Iran is seeking peace, but Israel won't simply end the war🌍 Currently, only Iran is seeking peace, but Israel won't simply end the war
⚡️⚡️⚡️ XAUUSD ⚡️⚡️⚡️
🚀 Buy@ 3385 - 3390
🚀 TP 3410 - 3420
Accurate signals are updated every day 📈 If you encounter any problems during trading, these signals can serve as your reliable guide 🧭 Feel free to refer to them! I sincerely hope they'll be of great help to you 🌟 👇
opportunity for selling GOLDI see that gold has confirmed strong resistance, so I took a sell trade with it.
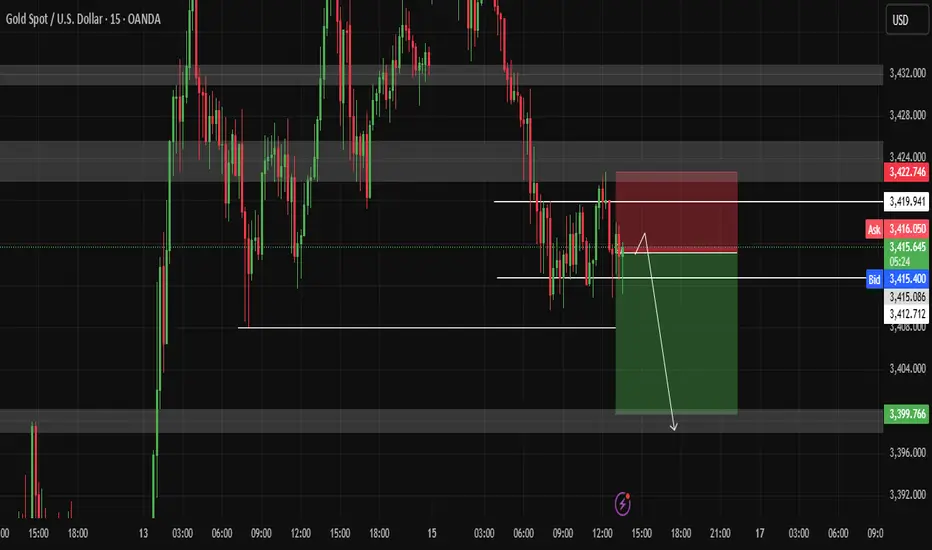
gold on sell reverse#XAUUSD multiple 2 times breakout below 3408 will drop the price till 3400-3376.
Price holds bearish reversal below 3408, target 3400-3376. SL 3419.
Bullish range and reverse is at 3403.6 price can reverse from here but if drop happens first below 3399 its invalid.
H1 closure above 3425 holds longer bullish.
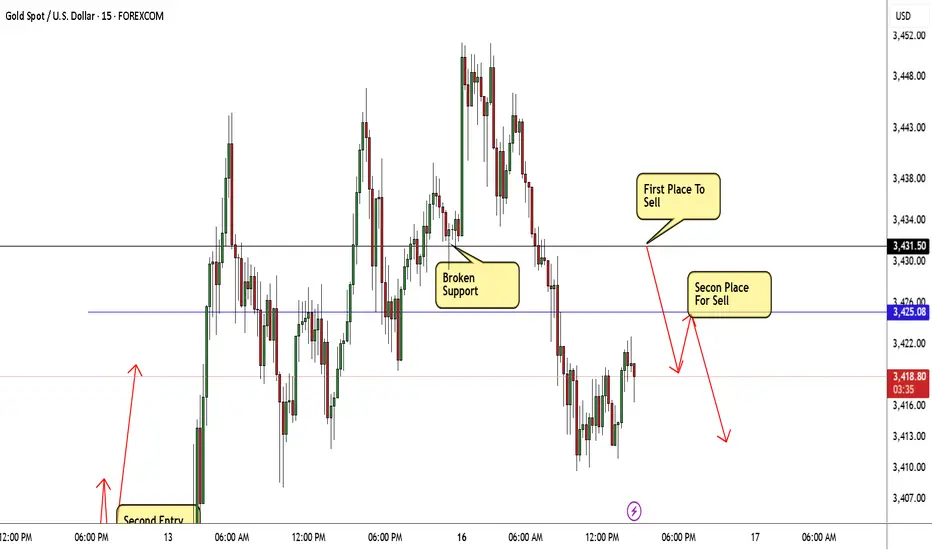
GOLD Best 2 Places For Sell Very Clear To Get 500 Pips !Here is my 15Mins T.F Chart On Gold and here is my fav 2 places to sell this pair , if we take a look on the chart we will see that we have avery good support @ 3431.50 and the price broke it and close below it and now i`m waiting for retest to this broken support and new res , and if i have a good bearish price action i will enter a sell trade and targeting the first support @ 3425.00 and if i have a good closure below it at least with 30 Mins Candle then i can add another contract and targeting the second support , if we have a closure above 3431.50 this idea will not be valid .
Safe-Haven Demand Drives Gold Higher – 3500 Within ReachWishing everyone a peaceful weekend—despite turbulent times.
This weekend has been anything but calm. The escalating conflict in the Middle East continues to widen, with rising casualties. As always, war is often a pursuit of power by those at the top, while the real cost is borne by innocent civilians. Though we are mere observers from afar, it’s hard not to feel the weight of the situation.
From a geopolitical perspective, this conflict coincides with U.S.–Iran nuclear negotiations. Could this be a calculated move by certain powers to shift the balance in their favor? While it remains speculative, what’s certain is that the intensifying conflict is already shaking global financial markets.
In such a climate, safe-haven assets are clearly benefiting. Gold’s upward momentum appears firmly established, and oil’s direction hinges on the situation at the Strait of Hormuz. If the strait is closed, a surge in USOIL prices toward $100 would no longer seem unlikely.
Under the influence of such impactful news, traditional technical analysis plays a lesser role. The market direction is largely determined by sentiment, and chart patterns now serve more as entry point references rather than decisive indicators.
My trading outlook for Monday:
If gold opens with a bullish gap and rallies toward the 3480–3500 zone, this area could present a short-term selling opportunity—ideally executed with a quick in-and-out strategy;
If a pullback follows, look to build intraday long positions: aggressive traders may consider entries near 3430, while conservative ones can wait for a potential retest of the 3418 level.
One crucial reminder: News-driven markets are highly uncertain. Eventually, every war comes to an end, and when the demand for safe havens fades, so too will prices. Stay rational in your decisions, and always manage your risk appropriately.
XAUUSD:Waiting to go long
For gold I am still bullish, do long, rather than blindly chase long.
Today's lowest reretreat to around 3408, from the short-term level or long willingness is stronger, the hourly level is a little pressure, trading can wait for the pullback before buying long, the important support below 3404. Short-term support looks at 3407-12
Trading Strategy:
BUY@3407-12
TP:3427-30
↓↓↓ More detailed strategies and trading will be notified here ↗↗↗
↓↓↓ Keep updated, come to "get" ↗↗↗
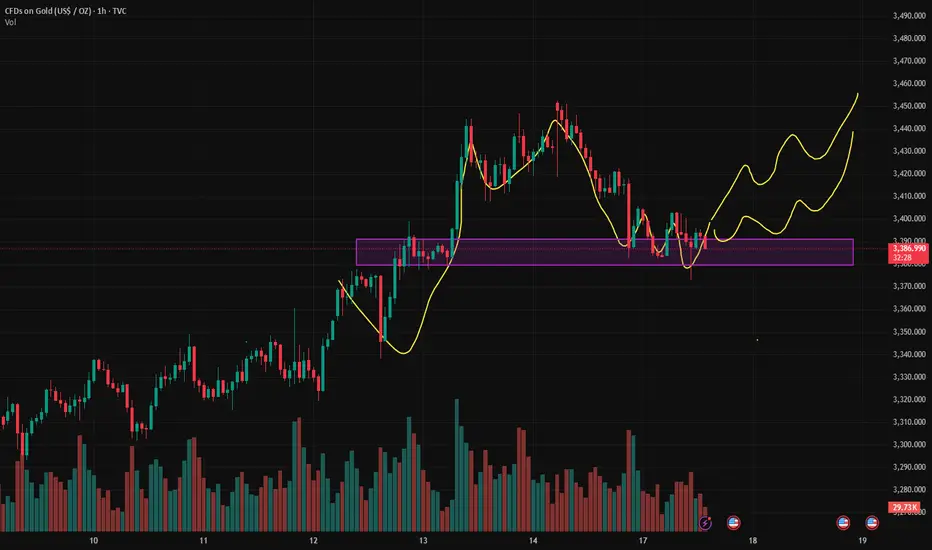
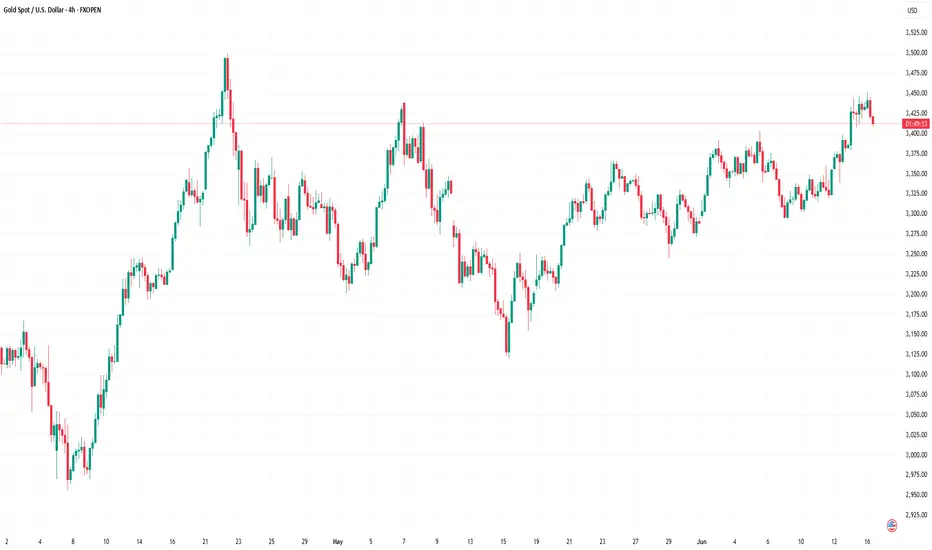
Gold Regains Bullish MomentumGold Regains Bullish Momentum
Gold price started a fresh surge above the $3,375 resistance level.
Important Takeaways for Gold Price Analysis Today
- Gold price started a fresh surge and traded above $3,420 against the US Dollar.
- A key bullish trend line is forming with support at $3,415 on the hourly chart of gold at FXOpen.
Gold Price Technical Analysis
On the hourly chart of Gold at FXOpen, the price formed a base near the $3,300 zone. The price started a steady increase above the $3,350 and $3,375 resistance levels.
There was a decent move above the 50-hour simple moving average and $3,400. The bulls pushed the price above the $3,420 resistance zone. A high was formed near $3,450 and the price is now consolidating gains.
On the downside, immediate support is near the $3,415 level and the 23.6% Fib retracement level of the upward move from the $3,301 swing low to the $3,451 high.
Besides, there is a key bullish trend line forming with support at $3,415. The next major support sits at $3,375 and the 50% Fib retracement level of the upward move from the $3,301 swing low to the $3,451 high.
A downside break below the $3,375 support might send the price toward the $3,335 support. Any more losses might send the price toward the $3,300 support zone.
Immediate resistance is near the $3,450 level. The next major resistance is near the $3,460 level. An upside break above the $3,460 resistance could send Gold price toward $3,480. Any more gains may perhaps set the pace for an increase toward the $3,500 level.
This article represents the opinion of the Companies operating under the FXOpen brand only. It is not to be construed as an offer, solicitation, or recommendation with respect to products and services provided by the Companies operating under the FXOpen brand, nor is it to be considered financial advice.
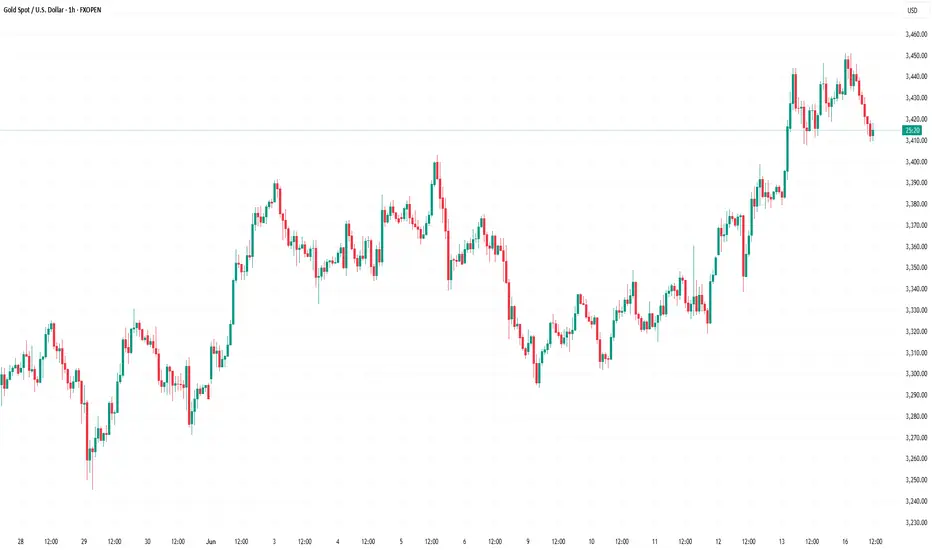
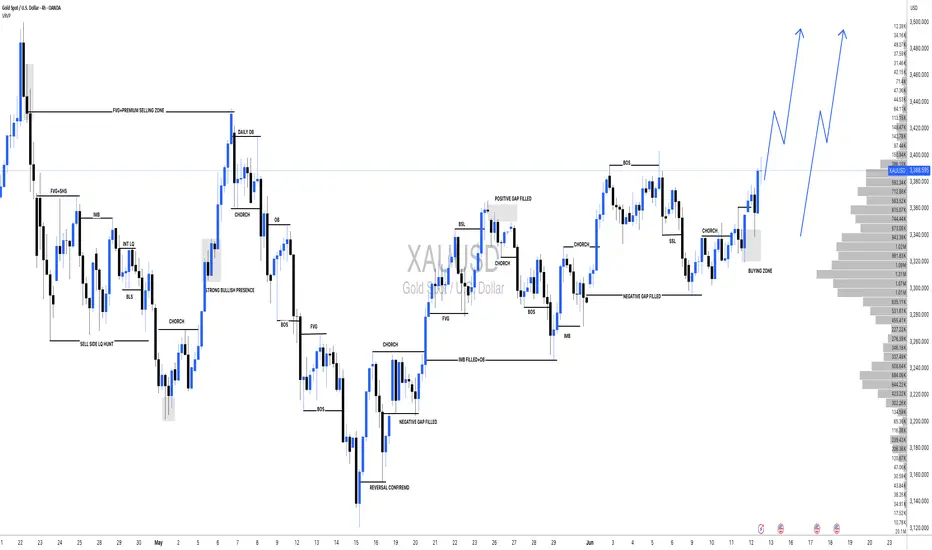
XAU/USD Chart Analysis Following Israel-Iran StrikesXAU/USD Chart Analysis Following Israel-Iran Strikes
In 2025, the price of gold continues to form a long-term upward trend, highlighted by the black line. The red line previously acted as resistance, resulting in the formation of a contracting triangle on the XAU/USD chart – a typical sign of market equilibrium.
However, this red line was breached (as indicated by the arrow) amid news of the exchange of strikes between Israel and Iran. In response, gold price movements have more clearly outlined the rising blue channel, which began to take shape in the second half of May.
Over the weekend, the strikes continued, and on Monday morning, trading opened with a modest bullish gap. This indicates that geopolitical risk concerns are helping to keep gold prices anchored above the red line.
What could happen to the price of gold next?
Much will depend on how the situation in the Middle East develops. Should the exchange of strikes between Iran and Israel subside and official statements offer hope for de-escalation, a pullback from the upper boundary of the blue channel is likely.
If such a scenario plays out, technical analysts may focus on the support zone around $3,390–3,400 on the XAU/USD chart, formed by:
→ the psychological level of $3,400;
→ the red line, which previously acted as resistance;
→ the median of the blue channel.
This article represents the opinion of the Companies operating under the FXOpen brand only. It is not to be construed as an offer, solicitation, or recommendation with respect to products and services provided by the Companies operating under the FXOpen brand, nor is it to be considered financial advice.
Safe-Haven Demand Expected to Push Gold Prices Toward 3500Last week, intensifying conflict between Israel and Iran triggered a strong wave of risk-off sentiment in the markets.
As a result, we saw sharp rallies across major safe-haven assets and crude oil.
Over the weekend, tensions continued to escalate and even showed signs of further expansion.
Under such circumstances, it's clear that heightened geopolitical risk will continue to support gold prices.
However, 📍$3500 remains a major resistance zone at the moment.
If gold spikes to this level intraday, it’s very likely we’ll see a short-term pullback —
Whether due to profit-taking, cautious positioning by sideline capital, or selling pressure from trapped shorts above 3490,
⚠️ this kind of correction is a natural market reaction — driven by human nature.
Even with strong risk-off demand in place, after a $200 rally,
the market is still subject to volatility from profit-taking behaviors.
🔑 Trading Strategy for This Week
As long as tensions in the Middle East persist,
🎯 the primary bias remains bullish.
However, the entry point is crucial.
💡 Important notes:
Avoid chasing price after sudden spikes caused by breaking news.
Those spikes are not ideal buy zones — instead, look for short-term selling opportunities at those highs.
Once the price pulls back, assess the retracement level and key supports before looking to buy the dip.
We are now within a historically high price range,
which means any rally could trigger profit-taking from earlier longs.
While the overall trend may still head higher,
⚠️ you need to carefully evaluate the size of potential pullbacks and whether your account can withstand the associated risks.
📊 Technical Levels to Watch:
Resistance: 3450-3455 (minor), 3468-3474 (previous high), and 3487-3499 (major historical high)
Support: 3420–3410 zone, and the deeper 3400–3386 range
Stay alert, trade wisely, and remember — in volatile geopolitical environments,
timing and discipline are more important than ever.
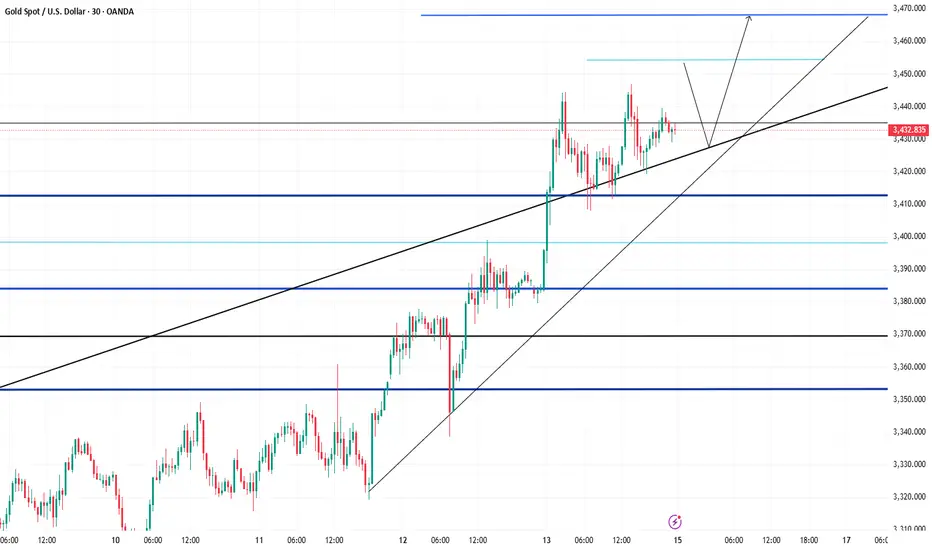
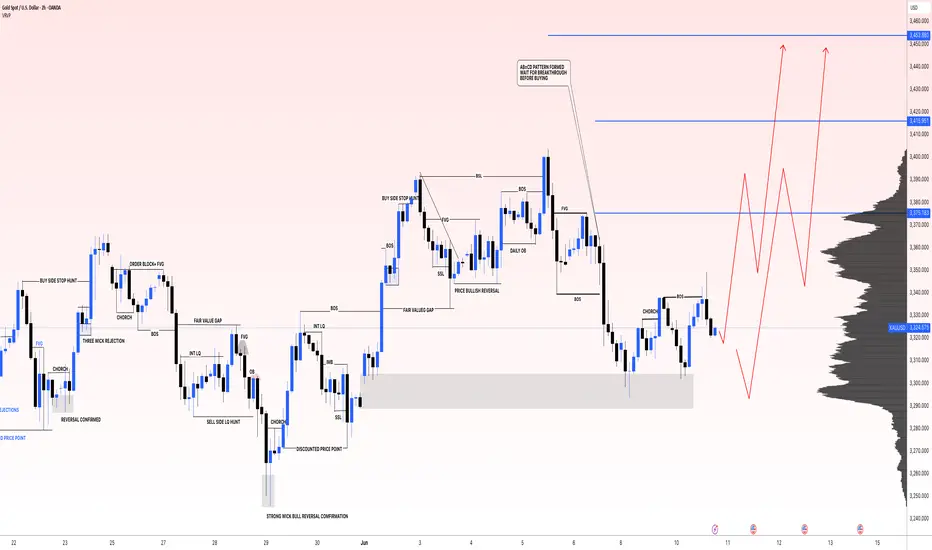
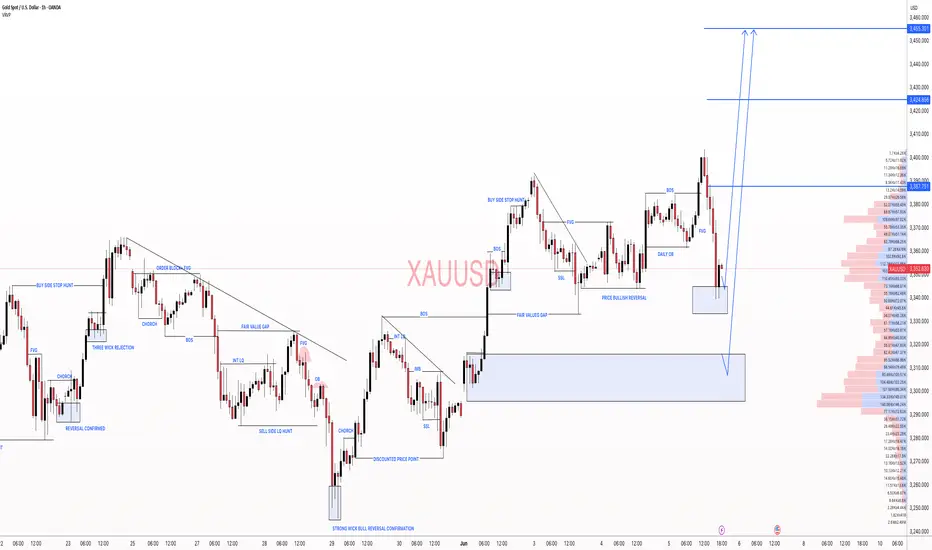
Gold (XAUUSD) Trading Setup – Mid-June 2025 Analysis🔰 Gold (XAUUSD) Trading Setup – Mid-June 2025 Analysis
This chart represents a strategic price action-based setup on Gold (CFDs on Gold – US$/Oz) using a 15-minute timeframe. It includes clearly defined entry zone, support/resistance levels, and profit-taking targets (TP1, TP2) for both bullish and bearish scenarios.
🔍 Current Market Context
Current Price: ~$3431.77
Structure: The price has been in an upward trend with a consolidation phase forming near the key mid-zone.
Highlighted Zone: A decision zone is marked in red (between ~$3422 and ~$3418), acting as the key liquidity zone or breakout area.
📈 Bullish Bias
If price breaks and holds above the red zone:
✅ TP1: $3480
✅ TP2: $3580
These levels act as short- to mid-term bullish targets based on projected extensions of recent upward momentum.
📉 Bearish Bias
If price breaks and holds below the red zone:
✅ TP1: $3320
✅ TP2: $3260
This indicates a possible reversal or correction phase, with targets derived from recent swing lows and support areas.
📌 Trading Notes
The blue shaded areas represent target zones for partial or full exits.
Red zone is the critical breakout decision point.
Ideal for breakout or pullback traders.
Can be combined with volume/confirmation indicators (e.g., RSI, MACD, or price action candles) for entry timing.

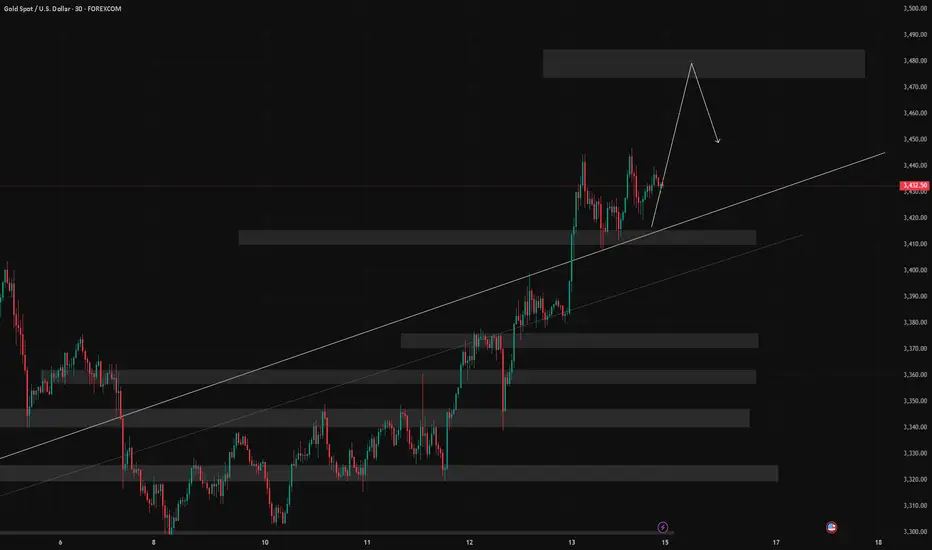
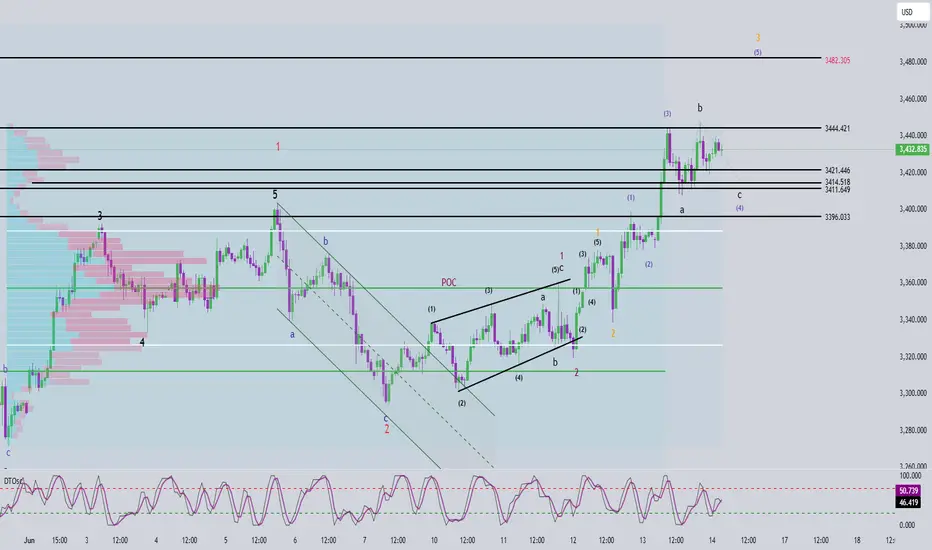
Elliott Wave Analysis – XAUUSD June 16, 2025
🌀 Elliott Wave Structure
On the H1 timeframe, price is forming a 5-wave structure (1) (2) (3) (4) (5) in green, with the market currently in wave 4.
Last Friday, after breaking above the 3444 high, price failed to continue toward 3482 and instead reversed lower. This behavior suggests that wave 4 is developing as a Flat correction in black abc structure.
👉 Based on this outlook, wave c is expected to complete around 3314, marking the end of wave 4 in green. From there, a bullish impulse is anticipated to complete wave 5.
🔎 Momentum Overview
D1 timeframe: Momentum is rising → indicating the dominant trend for early this week is likely bullish.
H4 timeframe: Momentum is declining → supporting the scenario that wave c of wave 4 may still have one more leg down.
H1 timeframe: Momentum is about to turn downward → suggesting a potential drop during the Asian session on Monday.
🚨 However, ongoing geopolitical tensions in the Middle East could trigger unexpected price spikes, especially during the Asian session.
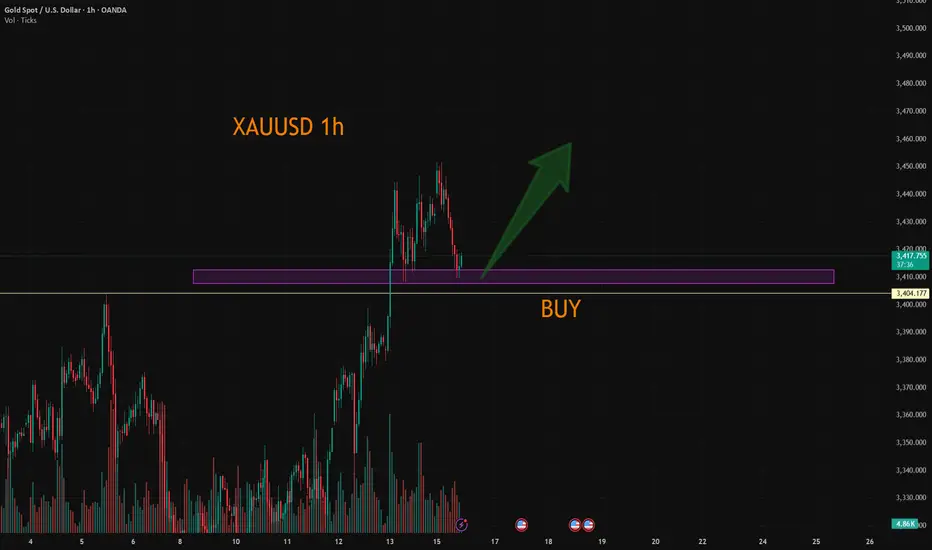
📈 Trade Plan
Buy Zone: 3415 – 3412
Stop Loss: 3405
Take Profit 1: 3444
Take Profit 2: 3482
XAUUSD:Touching $3500 One More Time Gold is currently extremely bullish and we expect price to touch 3500$ region one more time before it may reverse. you can set your own target based on your risk. Gold will remain volatile in coming weeks and we want all of you to trade safe.
Good luck and trade safe.
Team Setupsfx_
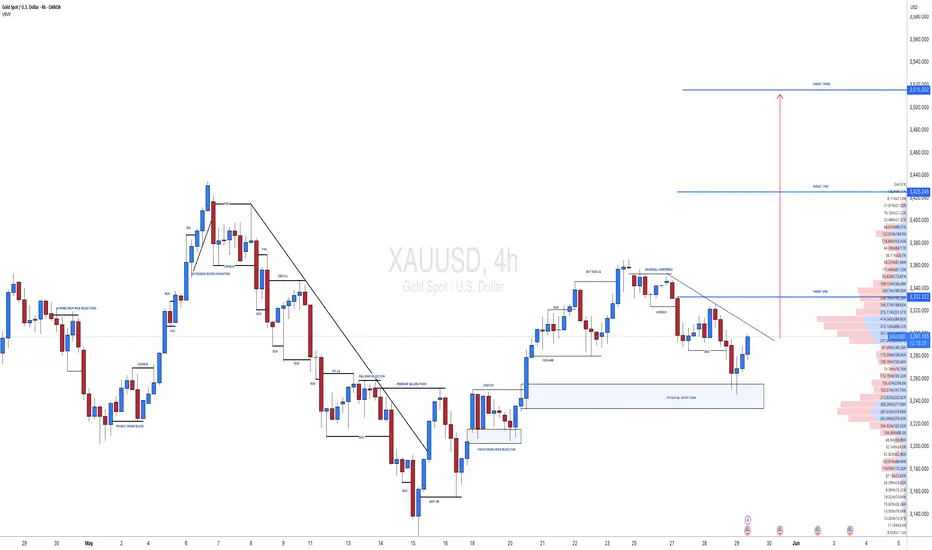
#XAUUSD[GOLD]: Massive Boost For Buyers, Incoming More Volume! Gold has been moving as expected in our previous chart. We anticipate a smooth bull market in the coming days, with a target price region of 3400$. There are three specific targets you can aim for.
If you’d like to contribute, here are a few ways you can help us:
- Like our ideas
- Comment on our ideas
- Share our ideas
Team Setupsfx_🚀❤️
#XAUUSD[GOLD]:At Critical Level, Bullish Swing Is Very LikelyHey There Everyone,
So, gold prices took a bit of a dip, hitting 3250 gold. But guess what? They bounced back like a rubber ball and reached 3332! And here’s the exciting part: they broke through that pesky bearish trend line. This means they’re probably going to retest that line to confirm the trend.
Right now, it looks like they’re at a potential retest point, and that’s where things could get really interesting. If strong bullish volume comes in, the price could skyrocket! There are three possible targets here: 3332, 3362, and 3420.
Now, here’s something important to keep in mind: next week, there are some big news and events coming up that could totally shake things up in the gold market. And let’s not forget about price manipulation. If someone tries to mess with the price, it could drop back to 3250 and then reverse course. So, it’s crucial to have backup plans in case of any unexpected twists.
The US dollar is also going to be all over the place due to upcoming news, which could disrupt the gold market and other currencies. So, it’s best to trade cautiously today and next week. The price can be a bit unpredictable, so take your time to do your own analysis and assess your risk before making any moves.
Good luck and trade safely! We wish you all the best in your trading journey!
Cheers,
Team Setupsfx_
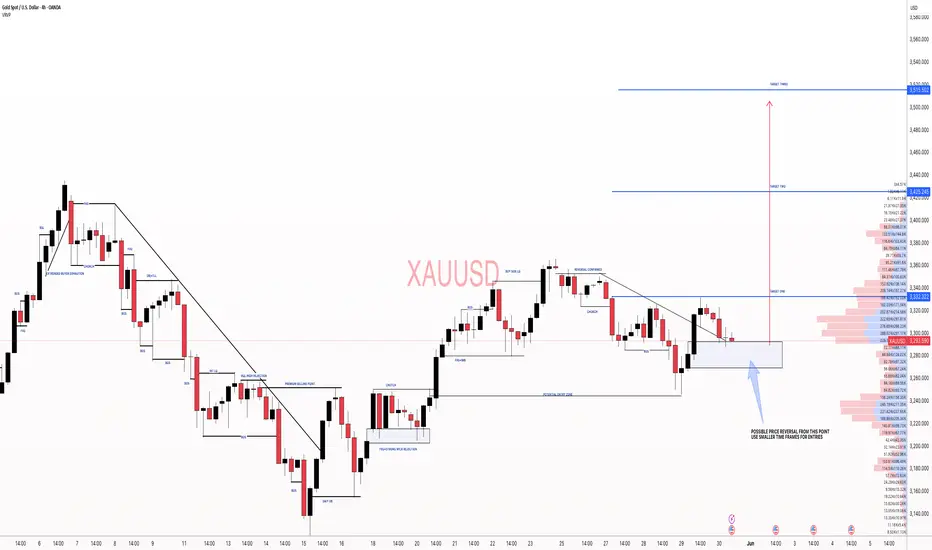
XAUUSD: Still Bullish with improved entry zones! Gold experienced a sudden drop today, falling to 3335 after briefly reaching 3391. This unexpected decline was not anticipated given the bullish price momentum. However, it has provided clarity for buyers, particularly swing traders. The price could drop to 3340 once more before reversing and hitting our first target, followed by a second target later.
Another possible scenario arises if the price continues to drop further. In this case, the second entry scenario becomes more secure, as Asian session volatility could cause the price to go sideways.
Please use accurate risk management and consider liking and commenting on this idea.
Good luck and trade safely.
Team Setupsfx_
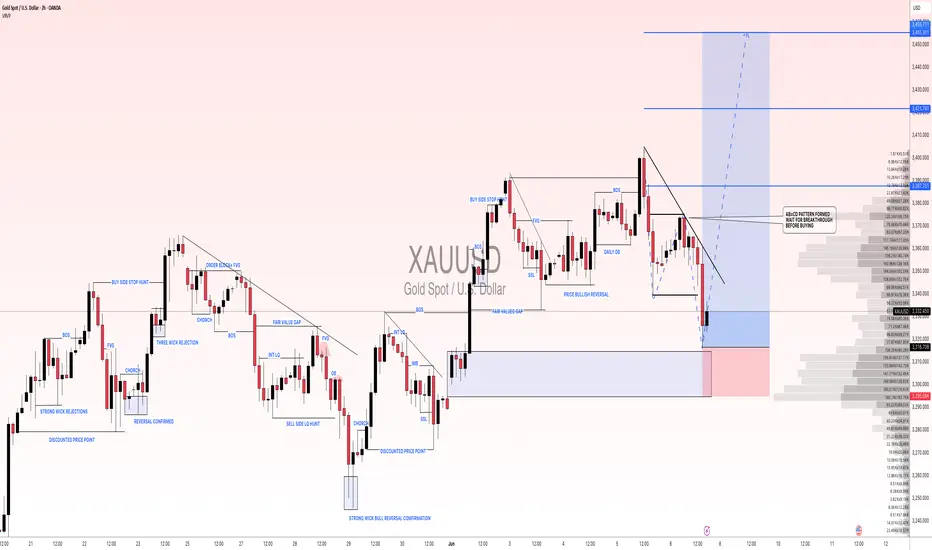
XAUUSD:06/06/2025 Update! Gold experienced a decline to 3314 following the release of unexpectedly strong NFP data. However, this decline is unlikely to lead to further price drops below 3314. This is primarily due to the ongoing turmoil within the president’s own political party, which is only just beginning to unfold and will likely intensify in the coming weeks.
Before making any trading decisions, it is advisable to conduct your own analysis. Additionally, the current price action has established an AB=CD pattern, where the price has successfully reversed from point ‘d’. This pattern suggests that waiting for the price to break out could be a prudent strategy for a safe entry.
Three targets have been reasonably set, with the potential to reach target two. However, the target three remains uncertain. The total potential profit from this idea is approximately 1300 pips.
It is also important to monitor the DXY closely. We recommend waiting for the price to complete its bullish correction before taking an entry on gold.
We sincerely hope that this analysis proves beneficial. Please consider liking, commenting, and sharing this post to encourage us to provide more such insights.
Best regards,
Team Setupsfx_
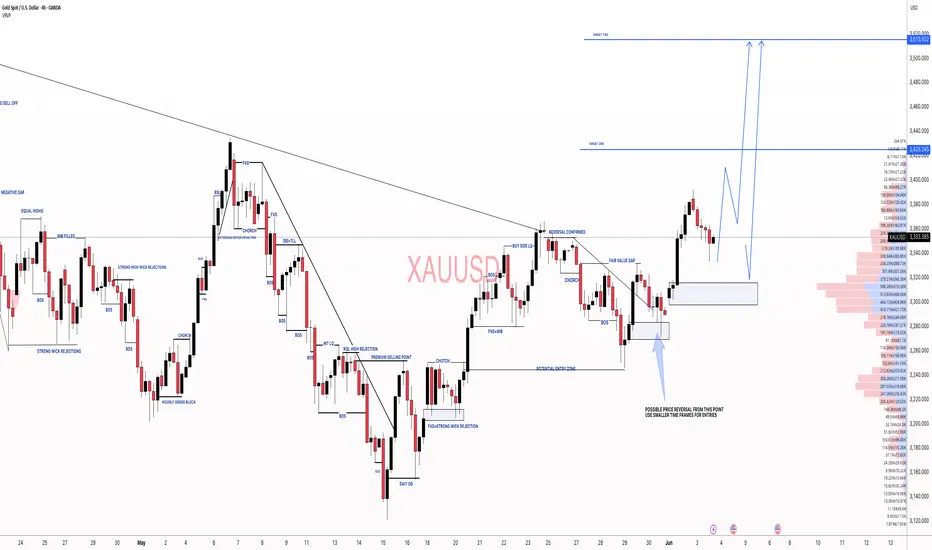
XAUUSD: Another Important Update On Gold Prices! We recently posted an idea analysis on Gold, but our first entry was invalidated due to the heavy sell-off. We expect a smooth move from the current price point. However, please remember that the market conditions will remain volatile and uncertain due to important economic data being published tomorrow.
Good luck, trade safely!
Team Setupsfx_
#XAUUSD[GOLD]:+2200 Pips Big Move! | Setupsfx_|Gold is currently accumulating in smaller timeframes, which suggests it’s in the early stages of a significant move. It’s possible that the price will reverse from either of the entry zones. There are three take-profit areas you can target, but only if they align with your view. This is an educational post, so please don’t blindly follow it – do your own analysis.
Like and comment for more!
Team Setupsfx_