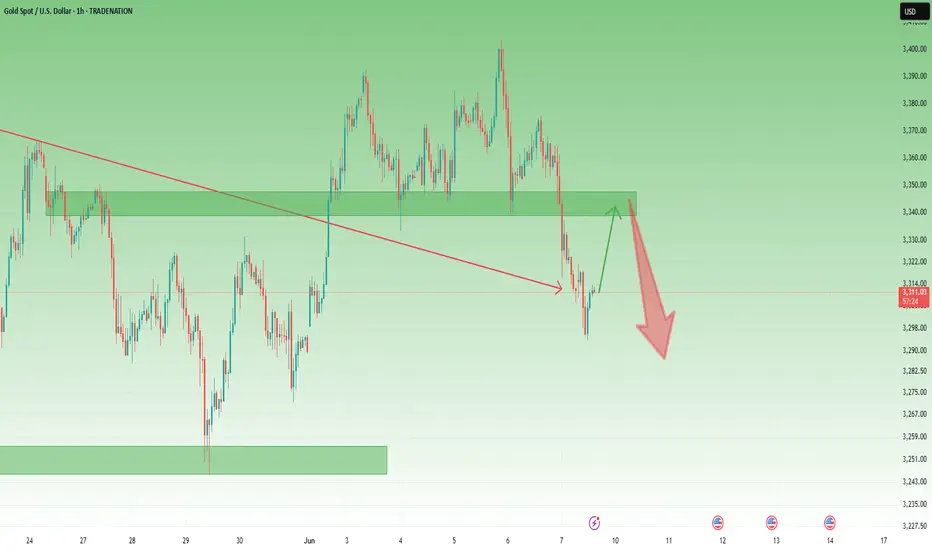
GOLD M30 intraday chart update for 11 June 25Hello Trader, Welcome to the US CPI Day
AS you can see that market is still below 3350 Psychological level with given rewards multi-time from that level
now all eyes on US CPI if market successfully breaks 3350-60 zone today the it will move towards 3370/80 or even 3400 psychological level
below 3350 psychological level market remains bearish for shorter term
Disclaimer: Forex is Risky
Xauusdidea

XAUUSD Bearish Rejection Setup Unfolding – June 11, 2025XAUUSD Bearish Rejection Setup Unfolding – June 11, 2025 🧠🔍
📊 Technical Breakdown:
🔴 Resistance Rejection Zone (Supply Area)
Price recently tested the $3,440 - $3,460 resistance zone, marked with red arrows. This zone previously acted as a strong supply area, leading to aggressive sell-offs.
📉 Bearish Rejection Candle
A rejection occurred near the same supply zone again, hinting at a potential double top or failure to break structure. Sellers seem to defend this area aggressively.
📍 Current Price: $3,338.6
Price is hovering below mid-range resistance at $3,396.5, indicating weakness after a failed breakout.
📉 Bearish Plan in Motion:
🔁 Scenario Highlighted:
Price might retest the $3,396.5 level (purple line) before resuming the downward move (illustrated by the blue and black arrows).
A breakdown below the $3,290.3 support zone will likely trigger further downside.
🎯 Target Levels:
1st Target: $3,290.3 – Key structural support. A close below this level will confirm the bearish momentum.
2nd Target: $3,207.0 – Final support area aligned with previous accumulation zone.
🛑 Invalidation Point:
A sustained breakout above $3,460 would invalidate the bearish bias and suggest continuation to the upside.
✅ Summary:
Bias: Bearish 📉
Strategy: Sell on pullback to $3,396.5 with stops above $3,460.
Targets: 🎯 $3,290.3 ➡️ $3,207.0
Watch for a strong bearish confirmation candle below $3,290.3 to load in shorts.
🔔 Stay alert for volume spikes and lower time-frame breakdowns to fine-tune entries! 💼📊

Analysis of Today's Gold Market Trend and Trading IdeasYesterday, gold prices rose to $3,338 before pulling back, closing the daily chart with a doji star. Weekly and monthly charts suggest an adjustment is needed, but short-term momentum is lacking, keeping the market in consolidation. During today's Asian session, gold prices fell to $3,302 under pressure and stabilized.
In the 4-hour timeframe, the rebound to $3,338 confirmed the previous support-turned-resistance level, which also coincides with the resistance of the broken low and the middle band of the Bollinger Bands. The current range-bound pattern remains unchanged. Today's strategy is to stay bearish but avoid chasing short positions—enter short trades when the price rebounds and meets resistance. Focus on the $3,340 resistance level, with support at the $3,300-$3,290 range.
XAUUSD
sell@3335-3340
tp:3310-3290
Investment itself is not the source of risk; it is only when investment behavior escapes rational control that risks lie in wait. In the trading process, always bear in mind that restraining impulsiveness is the primary criterion for success. I share trading signals daily, and all signals have been accurate without error for a full month. Regardless of your past profits or losses, with my assistance, you have the hope to achieve a breakthrough in your investment.

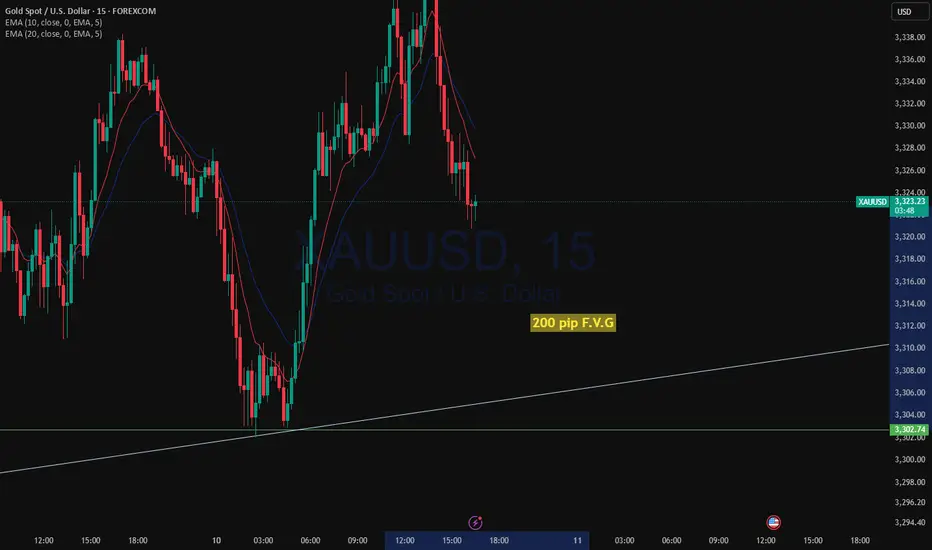
XAUUSD 200 pip FVG drop?XAUUSD Finally started to break below to the major direction of the trend. After crossing the daily high, price started to break below upon retest of the neck line of the 4H head and shoulder.
As the market has got rejected from daily resistance we see possible drop back to daily low or even test of the strong liquidity zone on the monthly support level.
Upon price action confirmation, a sell trade is high probable
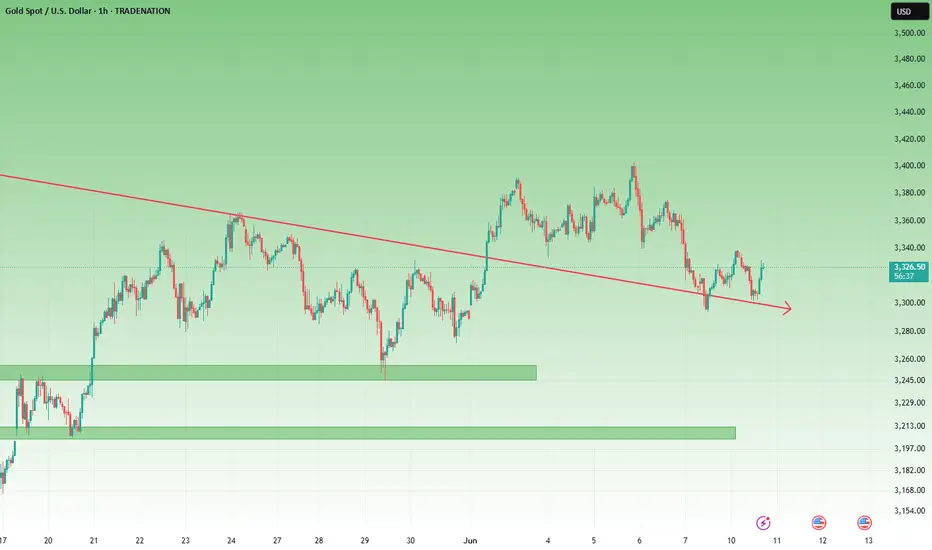
Gold Outlook: From Resistance Rejection to Bullish Revival1. Recap of Yesterday's Expectations
In my previous analysis, I highlighted the 3340–3350 zone as key resistance and suggested that any rise into that area could give sellers a better entry.
✅ Indeed, price rallied into that zone and was rejected, validating the plan.
2. What Happened Next?
After rejecting the resistance, gold touched 3300 again, but again, the bulls stepped in:
🔹 A higher low formed compared to the previous day.
🔹 This suggests the market is now shifting its structure from down to potential up.
3. Why 3300 Looks Like the New Floor
Several bullish clues:
- The quick bounce back to 3330 shows buying power.
- Price structure is developing a series of higher lows.
- This suggests growing confidence from buyers.
4. Trading Plan
🔸 A break above 3340 would confirm bullish momentum and open the door toward 3400 again.
🔸 Any dives toward 3300 should now be viewed as potential buying opportunities.
5. Final Thoughts
The market is telling a story of bullish pressure building under 3340 and potential break back above.
Disclosure: I am part of TradeNation's Influencer program and receive a monthly fee for using their TradingView charts in my analyses and educational articles.
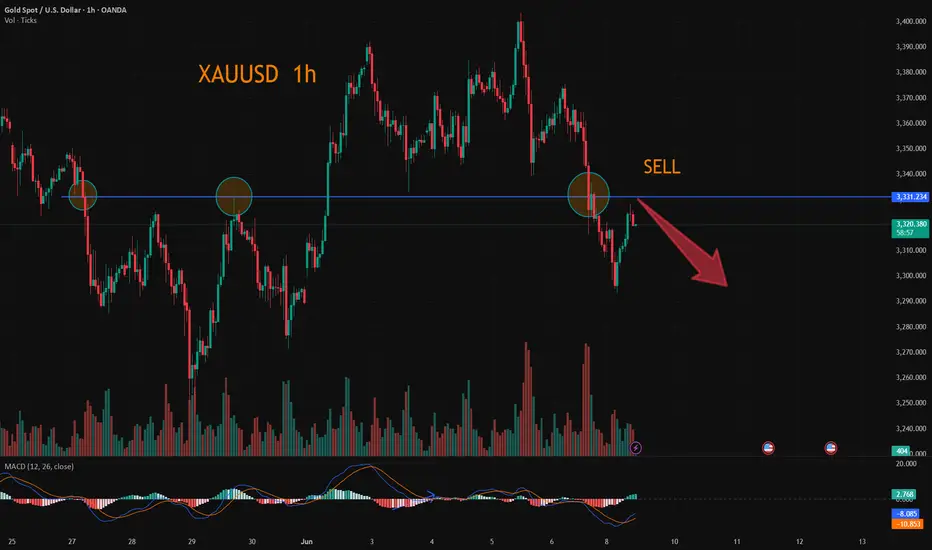
XAUUSD:Wait for a short near 3330
Last week's data was negative for gold and silver. However, it should be noted that the actual announced value is lower than the previous value, in essence, the economic end did not release good, but the contraction speed is lower than the market expectation.
In terms of the large cycle, June is the continuation of May's wide shock, long rest storage stage, but also up and down back and forth pull, the main trend is still more, pay attention to seize the next wave of unilateral rise opportunities.
Now the fluctuation is still large, need to be patient and wait for the right position, short-term attention to 3330 resistance near to short, back to step near 3300 and then consider more.
Trading Strategy:
SELL@3330
TP:3310
↓↓↓ More detailed strategies and trading will be notified here ↗↗↗
↓↓↓ Keep updated, come to "get" ↗↗↗
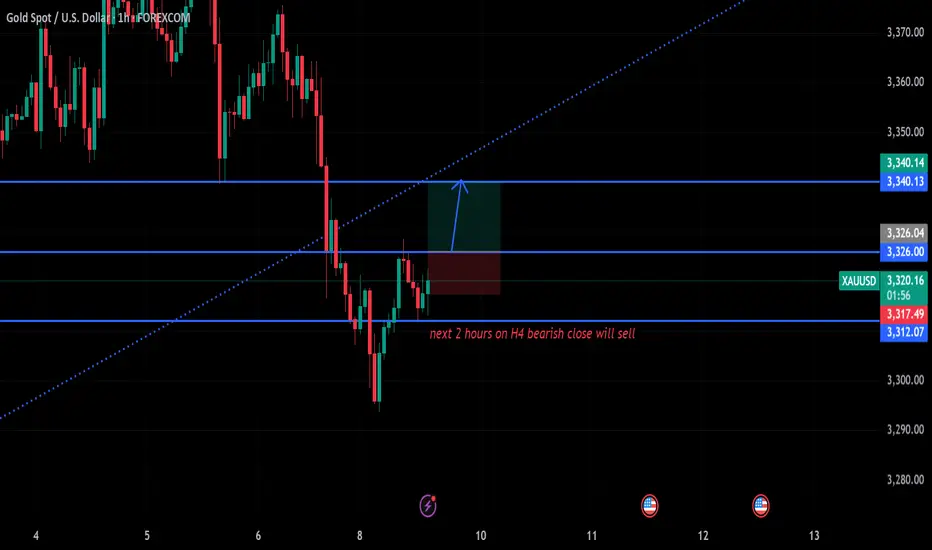
gold on short bullish till 3340#XAUUSD price aiming 3340 for reverse, possible 3340 price close on D1 or middle close to continue bearish.
#Gold buy at 3326 breakout, target 3340, SL 3317.
We aim at H4 price close in next 2 hours, if possible it closes below bearish 3313 then bearish is possible to continue but buy at 3323-26 will take above 3340.
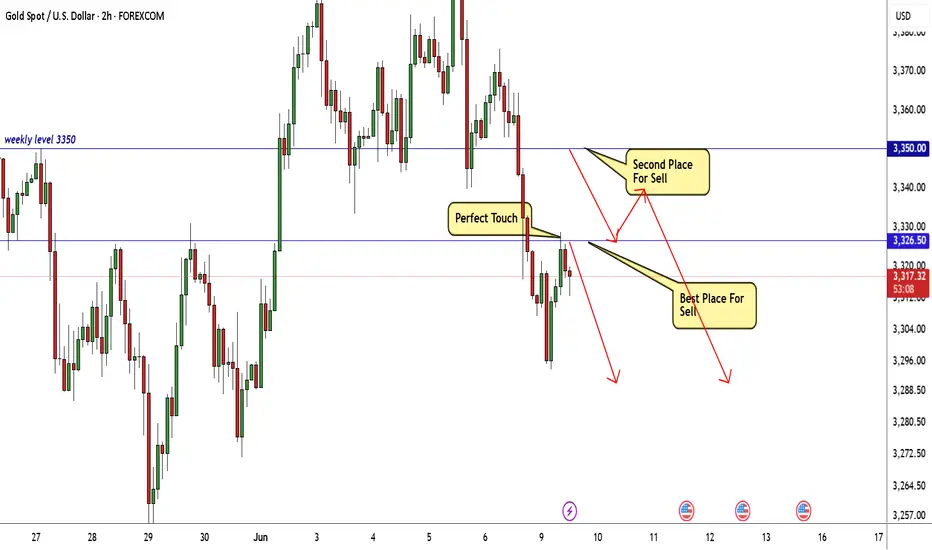
GOLD Best 2 Places For Sell Very Clear , Ready For 500 Pips ?Here is my opinion on gold on 2H T.F , we have a very good bearish price action and we have a very good retest for broken support and new res , so i think 3326.00 will be a very good place to sell and targeting 250 pips at least , also if the price go up a little 3350.00 will be the last place we can sell from it and targeting 500 pips .
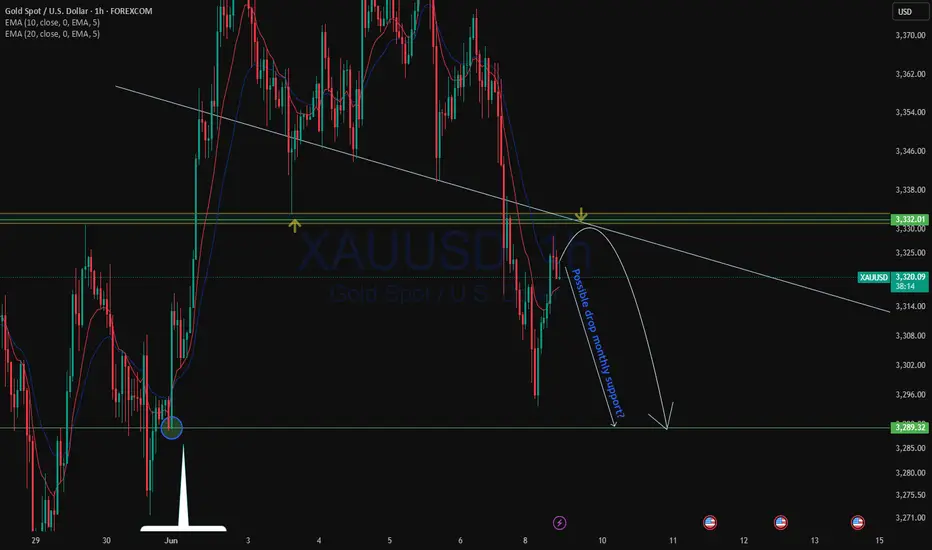
XAUUSD Analysis today : Drop to monthly support?XAUUSD with NFP breakdown from significant daily support price has dropped nearly to monthly support and may continue to drop to retest the monthly support? As there is a rejection from the monthly high and the market is almost nearly to monthly gap open, it is highly likely price may retest the monthly support.
As with new monthly open, we see price has retraced to the significant intra day resistance to retest the level 3328.00
As the market started to reject back to the major direction of the trend, it is mostly probable that the price may continue to drop to this long term support level
3289.32
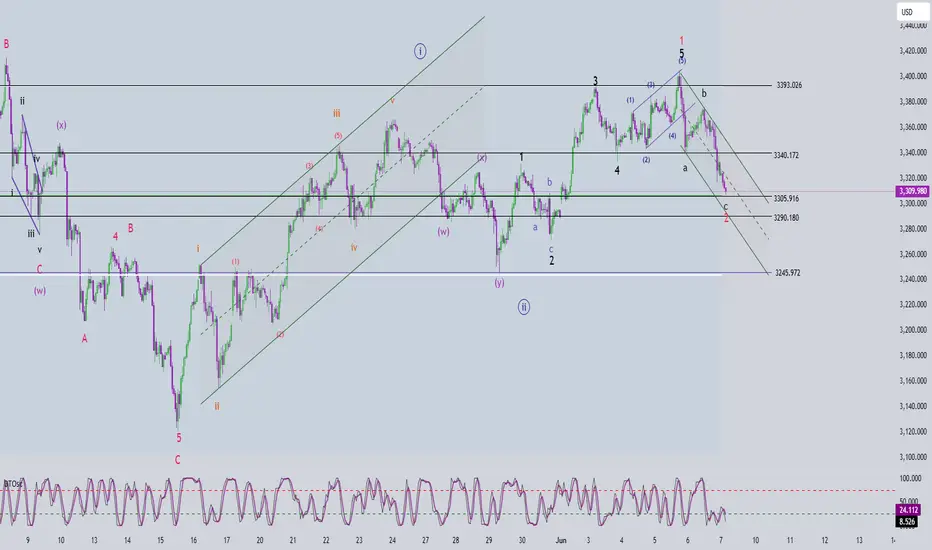
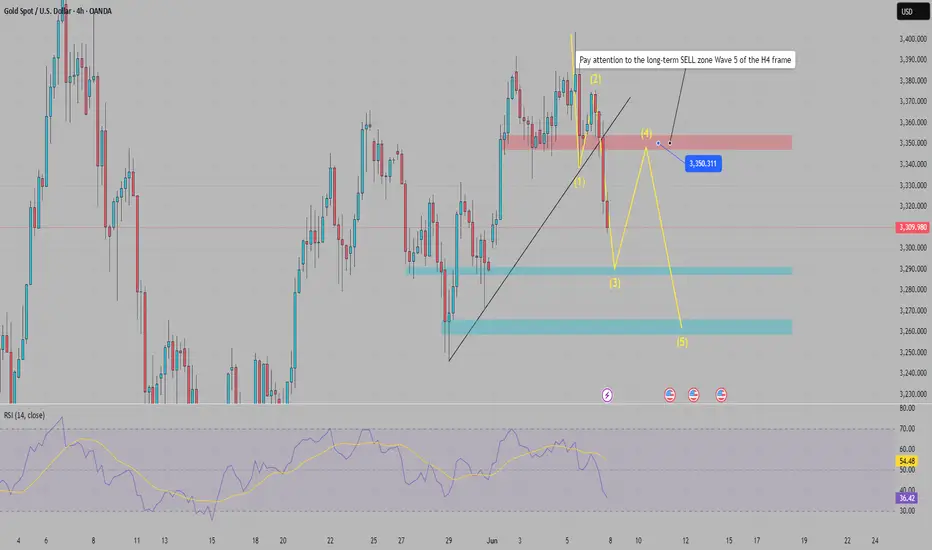
Elliott Wave Pattern – XAUUSD Trading Plan for June 8. 2025Elliott Wave Analysis
After Friday’s deep decline, price touched the level of wave 1 (black), invalidating the flat wave 4 scenario. Currently, the structure of wave 5 (black) appears to be a terminal triangle, and the sharp and steep drop afterward is consistent with post-terminal triangle behavior.
Post wave 5 completion, two possible bearish scenarios emerge:
Scenario 1: Price is forming a zigzag (abc in black). Wave c may have completed at 3305 — the first target. However, 3290 remains a significant lower target. A recovery that breaks above 3340 would help invalidate Scenario 2.
Scenario 2: Price is in a 5-wave bearish impulse. To confirm this, price must not break above 3340, as that would overlap with wave 1 and invalidate the structure. If this holds, the next key target lies below 3245.
Momentum Analysis
Daily (D1): When the market opens this week, momentum is expected to enter oversold territory — suggesting a weakening downtrend. Confirmation is needed.
H4: Momentum is already in oversold territory, indicating a potential bullish move early in the week.
H1: Also oversold. A reversal is likely during the Asian or European session, favoring Scenario 1 and a buy setup near wave c = wave a.
Trading Plan
Buy 3305 – 3302
SL: 3295
TP1: 3340
TP2: 3393
Buy 3292 – 3289
SL: 3282
TP1: 3305
TP2: 3340
TP3: 3393
Gold is vulnerable under 3340-3350 zone1. What happened last week?
As expected, Gold broke below the key 3340–3350 support zone and even slipped under 3300 during the Asian session this Monday, briefly reaching new short-term lows. The bearish pressure continues to dominate.
2. Key question now:
Is the drop over?
3. Why I expect the correction to end soon:
- The recent decline totaled nearly 1100 pips – a strong impulse move.
- Price is now undergoing a typical retracement after a steep sell-off.
- The previous support zone at 3340–3350 is now acting as resistance – a textbook role reversal.
- I expect this zone to attract sellers again.
4. My trading plan:
I remain bearish and plan to sell rallies, especially if the price shows rejection signs in the 3340–3350 area. This correction could offer an ideal re-entry for shorts at better risk/reward levels.
5. Final thoughts 🚀
The trend is still bearish. I’m waiting for the market to confirm resistance around 3340–3350 before executing my next move.
GOLD Intraday Chart Update For 9 June 2025Good Morning Traders,
As you can see that market try to fill the previous week opening gap and in that situation we may wait for a while to fill the gap and buying zone is located at 3265-3285, once market gives us a bounce back it will may move back to 3330-3340 SBR Zone
however market try to sustain above 3300 Psychological Level but keep in mind US China Tariff Deal which is due in this week
also if market sustains below 3300 psychological level successfully then it will move towards 3245-55 zone and final destination maybe 3200 Psychological
Disclaimer: Forex is Risky

H4 swing order analysis for traders, Trade Swing H4 GoldH4 swing order analysis for traders, pay attention to wave 5 to confirm Long-term Sell
James Stanley, senior strategist at Forex.com, said: "I remain bullish on gold and will look for new support for the broader trend to continue.
Gold has made a new short-term high, with the price rising above $3,350/oz. Therefore, I do not rule out the possibility of this uptrend continuing and will look for new support, especially at $3,300/oz and $3,280/oz," he said.
Rich Checkan, Chairman and CEO of Asset Strategies International, said: "The current momentum favors gold and silver. While there may be some profit-taking, I expect gold to continue to rise next week thanks to the weakness of the US dollar, political tensions in the Middle East and Ukraine, the impact of tariffs and the passage of a major bill in the US that will increase public debt, leading to consumer inflation. These factors will continue to drive demand for gold as a safe-haven asset."
Adrian Day, Chairman of Adrian Day Asset Management, shared: "There are signs that North American investors are increasing their purchases of gold, although not a strong wave, but I believe this trend is gradually changing. This is a positive signal for the gold market in the future."
Best Regards StarrOne !!!
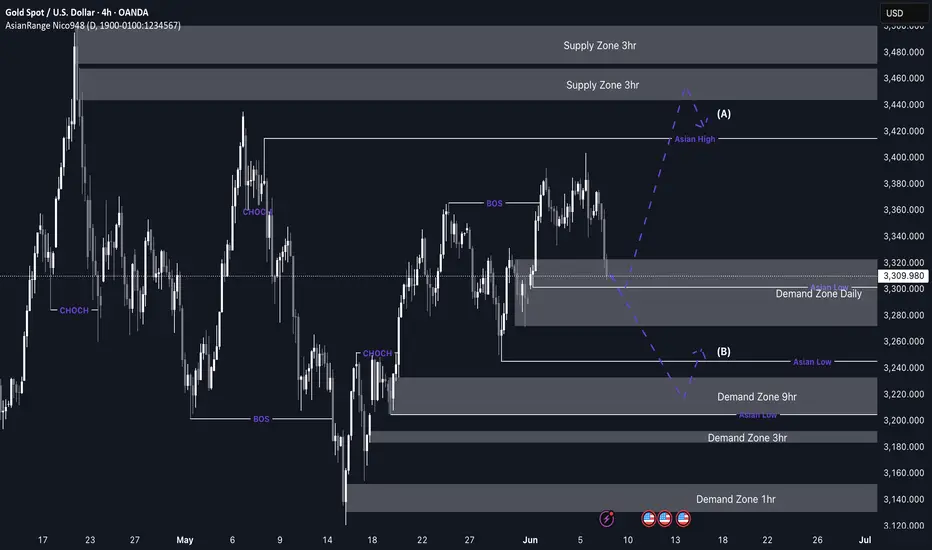
GOLD (XAU/USD) Imminent long opportunitiesThis week, my focus for GOLD is on potential long opportunities around the current price level. Price is sitting within a strong area of demand, so my plan is to wait for signs of accumulation and a clear slowdown in bearish momentum before considering any entries.
Ideally, I’d like to see the Asia low swept, which currently lies in the middle of the zone — that would offer even stronger confirmation for a buy setup.
If this current zone doesn’t hold, I have a well-defined 9H demand zone around the 3,220 level, which sits in a more discounted area and aligns well with the overall bullish trend on the higher timeframes.
Confluences for GOLD Buys:
- Clean major daily demand that caused a change of character to the upside
- Plenty of liquidity above and an unmitigated supply higher up
- This is a pro-trend trade, aligning with overall higher timeframe bullishness
- DXY has been bearish over the past few weeks, supporting gold upside
P.S. If price respects this current demand and moves higher, we may see a short-term reaction from the 3H supply zones above — but we’ll monitor price action and adjust accordingly.
Have a great trading week
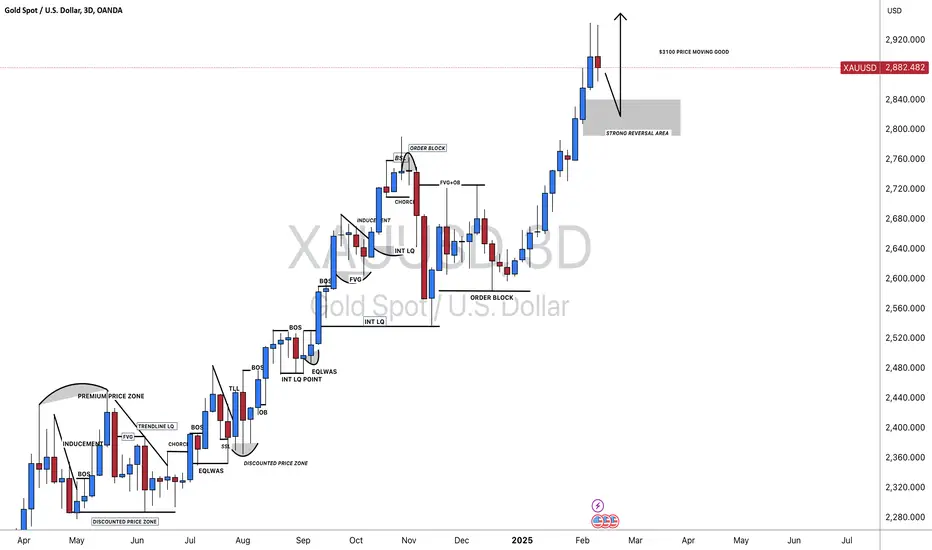
XAUUSD: $3100 is the next target, Get Ready For the Big Move!Gold is currently making a small correction and looking at how the price is behaved. We are expecting how the price is likely to develop next. Use accurate risk management.
Geopolitical Undercurrents Support Gold as NFP LoomsTVC:GOLD OANDA:XAUUSD Gold hovers near $3,370 after failing to hold above $3,374, where previous support has turned into resistance. Price remains trapped between TL2 and TL3, with short-term direction hinging on tonight’s U.S. NFP data (130K jobs expected, 3.7% YoY wage growth). A strong report may trigger a drop toward the $3,342–$3,325 support zone, while weaker data could spark a bullish breakout toward $3,402.
Although Trump and Xi agreed to restart trade talks, deep fractures remain over export controls, Taiwan, and rare earth supply. These unresolved issues suggest geopolitical risk is far from over, offering medium-term support for CAPITALCOM:GOLD gold despite recent risk-on flows.
Resistance : 3,374 , 3,402
Support : 3,342 , 3,325

Gold falls below key support, short-term bearish approachAt present, the hourly level has fallen below the key support level of 3330, which is effectively broken as the short-term long-short watershed, which means that the market is weak and volatile in the short term. However, it does not constitute a short trend for the time being. The short-term trend in the future may still fluctuate downward, but there is no basis for a deep decline. Short-term short orders can be participated in, but the general direction remains bullish.
This week is coming to an end. If there are still operation plans, you can wait for a small rebound and then participate in a wave of short-term short operations. The target is controlled at 10-30 points. Enter and exit quickly, and don't be greedy.
Looking ahead to next week, it is expected that the market will fluctuate around 3,300 and then bottom out and then resume its upward trend. The thinking will continue to be mainly "short-term short and long-term long".
The current gold 1-hour moving average system has begun to turn downward. If a dead cross structure is further formed in the future, the downward space will be opened. After gold fell under pressure from a high level yesterday, it continued to be weak today. Combined with the bearish non-agricultural data, there is a lack of support for risk aversion. There is still room for short-term downward movement, and the overall rebound is still the main focus.
Operation suggestions:
Aggressive investors may consider shorting in the 3333-3335 range;
Conservative investors may wait for a rebound to the 3345-3350 area and enter the short position at an appropriate time.
The target is 10-30 points. It is not recommended to hold more than the target.

Gold Is Likely to Break Below 3300 SoonYesterday, gold rallied up to near 3400 before pulling back, just as we had anticipated. We've repeatedly emphasized that 3400 is a strong resistance level, and those who followed through with short positions likely saw impressive profits.
Today, after a sharp drop, gold has rebounded again and is fluctuating near resistance. Support lies at 3352, and if that breaks, the next downside target is around 3333, followed by a possible move to fill the gap between 3300–3289.
🔍 Trading Logic:
There's still significant selling pressure above 3300, with the gap remaining unfilled.
Once the gap is filled, bulls may regain confidence to push higher — though they still face dense resistance above.
📌 Clear Profit Opportunities:
✅ Short toward the 3289 gap fill
✅ After the gap is filled, consider buying into the bullish rebound
The setup is clear — the key now is timing your entries and managing your positions wisely.
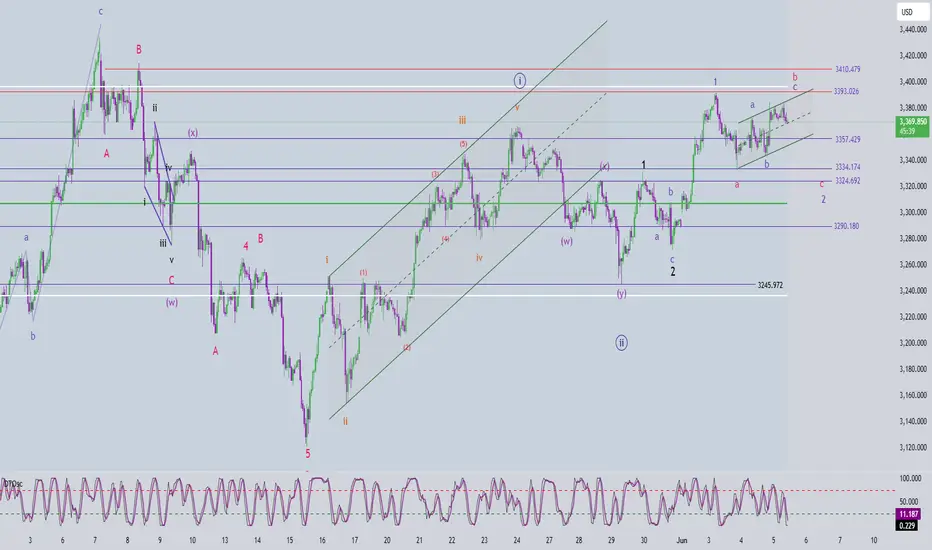
Elliott Wave Analysis – Trade Plan for June 6, 2025
🔍 Current Wave Structure
Yesterday's sharp and impulsive drop suggests a completed 5-wave structure for wave c (red) within a larger flat correction (abc red).
However, this morning's bullish move lacks momentum — candles are overlapping and price has failed to break above the 3383 level. This casts doubt on the current wave being the beginning of a new impulsive trend.
🌀 Scenario 1 – Beginning of a New Impulsive Wave
The current bullish leg may be wave 1, forming as a leading diagonal due to overlapping candles.
Projected target for wave 1: 3380. A pullback from this level could form wave 2, offering a potential long entry around 3347–3344.
⚠️ Scenario 2 – Continuation of a Larger Wave 2 Correction
If price drops back toward 3324, this would invalidate the current impulsive wave count as wave 4 would overlap wave 1 (black) → A larger corrective structure is still unfolding.
The current bounce may then be interpreted as wave a of a larger abc corrective move, suggesting a further decline to come.
🎯 Trading Strategy (Confluence of Both Scenarios)
Sell Zone: 3380–3383 → short-term selling opportunity based on potential wave 1 peak or wave b top.
Buy Zone: 3347–3344 → potential entry if wave 2 completes here (Scenario 1) or wave b ends here (Scenario 2).
📈 Momentum Outlook
Daily (D1): Momentum is fading but a confirmed bearish close today is needed. If confirmed, at least 4 more bearish daily candles may follow.
H4: Momentum is rising, suggesting more upside or sideways consolidation in the short term.
H1: Momentum is about to turn bearish. Ideally, we wait for it to dip into oversold territory and reverse upward — that would be our signal to go long.
🛒 Trade Setup
BUY ZONE: 3347 – 3344
🎯 SL: 3337
🎯 TP1: 3365
🎯 TP2: 3380
🎯 TP3: 3404 (if bullish scenario plays out)
SELL ZONE: 3383 – 3386
🎯 SL: 3393
🎯 TP1: 3365
🎯 TP2: 3347
With bulls and bears in a stalemate, where will gold go?Gold fell under pressure around 3384 in the early trading on Thursday, and then rebounded after falling to 3361. The highest in the European session reached around 3403, and then fell back due to resistance. The US session accelerated its decline, reaching a minimum of 3339, and then rebounded in the late trading, closing in the negative on the daily line. The daily trend continued to fluctuate in a positive and negative cycle. On Thursday, it rose and fell, closed in the negative and fell below the 5-day moving average.
Today, we will focus on the resistance position of 3405. Whether it can break through will determine the strength of the bulls in the future market. The risk of continuous negative daily lines cannot be ruled out. The support below is the key points of 3330 and 3300. The 4-hour fluctuation range is locked at 3385-3335. The fluctuation space in the Asian and European sessions is limited. It is recommended to sell high and buy low. For stable trading, it is recommended to go long in the 3340-3350 area. The overall bullish trend has not changed, and the impact of non-agricultural data is limited. It is expected that gold will most likely rise and fall. Remember not to chase the rise and sell the fall, and wait patiently for opportunities.
Steady trading, precise attack!

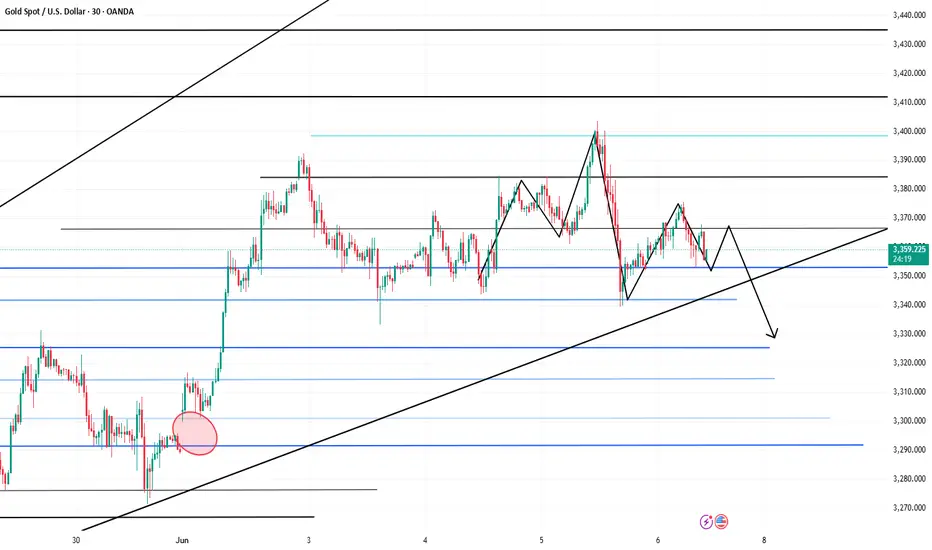
GOLD Intraday M30 Chart For 6 June 25As you can see that Market still is in strong range and we are still waiting for clear breakout
NFP main event of the day and remains watchable
If Market break 3335 successfully today then it will move towards 3310
above 3345-50 market remain slightly Bullish
Disclaimer: Forex is Risky

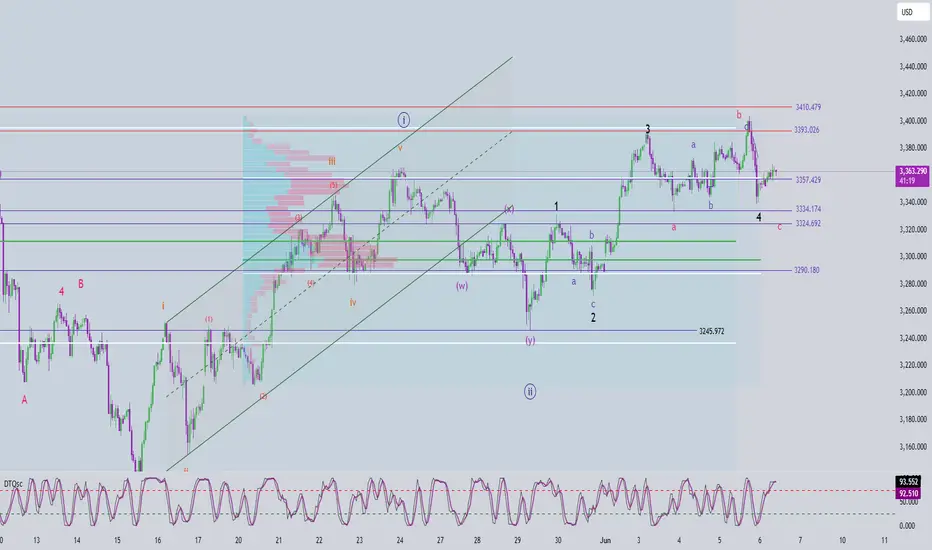
Elliott Wave Analysis – XAUUSD Trading Plan 5/6/2025
🌀 Current Wave Structure
On the H1 timeframe, price action is currently overlapping — a sign that the corrective phase may not be over yet. If the correction had indeed ended at 3334, we would expect a sharper and more impulsive rally typical of wave 3 (green) within wave 3 (black). The lack of that strong momentum suggests the correction could still be unfolding.
Both wave a and wave b (red) are showing 3-wave structures, which points to the development of a Flat correction in the red abc pattern.
Within wave b (red), we’re currently seeing a smaller abc structure (green), with price likely forming wave c (green) right now.
🎯 Target Zones
Wave c (green) target zone: 3390–3393, which is our ideal Sell zone.
If price reverses from this zone, we expect wave c (red) to complete somewhere between 3334–3324.
⚡️ Momentum Outlook
D1 timeframe: Momentum is starting to turn bearish. A confirmation will depend on how today’s daily candle closes. Until then, short-term upside is still possible.
H4 timeframe: Momentum has already turned bearish, supporting the case for a potential wave C (red) to unfold.
H1 timeframe: Currently oversold, which opens the door for a minor push up or some sideways action to finish wave c (green).
📌 Trade Setup
🔻 SELL Zone:
Entry: 3390 – 3393
Stop Loss (SL): 3400
Take Profit (TP1): 3370
Take Profit (TP2): 3357
🔺 BUY Zone:
Entry: 3334 – 3331
Stop Loss (SL): 3322
Take Profit (TP1): 3357
Take Profit (TP2): 3393
Take Profit (TP3): 3410
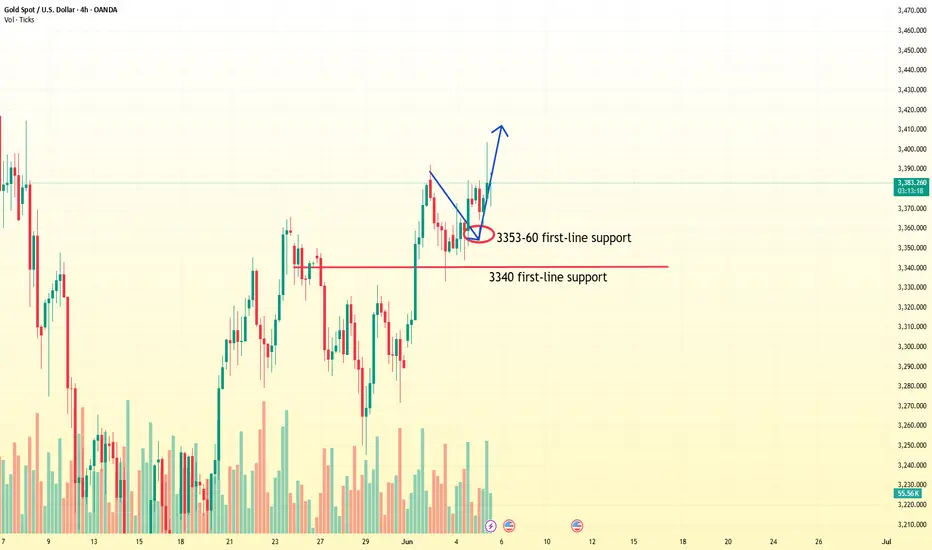
As long as gold falls, you can continue to buyNow we continue to pay attention to the short-term support of 3353-60. Today, we focus on the important support position of 3338-45. The trend is still mainly to do more after stepping back. We must operate under the premise of following the general trend. Only in this way can we achieve stable operation. If your current gold operation is not ideal, I hope I can help you avoid detours in your investment. You are welcome to communicate with me!
From the 4-hour analysis, the short-term support below focuses on the 3354-62 line. The daily level stabilizes at this position and continues to see the strong upward rhythm of bulls. Focus on the support of 3338-45. Pay attention to the suppression of 3395-3400. Keep the main tone of low-multiple participation around this range during the day. In the middle position, watch more and move less and be cautious in chasing orders, and wait patiently for key points to enter the market. I will remind you of the specific operation strategy during the trading session, and pay attention to it in time.
Gold operation strategy:
1. Buy when gold falls back to 3353-3362, and buy when it falls back to 3340-45, stop loss at 3336, target at 3395-3400;