GOLD Intraday Chart Update for 23 July 25Hello Traders
First of all i hope you were enjoying yesterday move with 400 Pips Reward
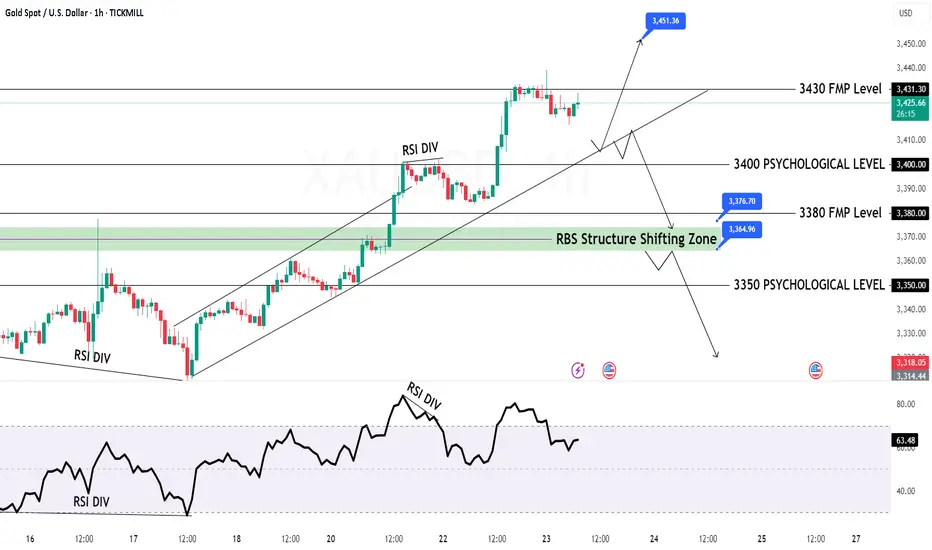
For today we have 3400 Psychological remains in focus if market breaks below 3400 then it will move towards 3364-76 zone otherwise we are remain buyers above 3400 Level
Strong Resistance zone for intraday is at 3445-3465 if market cross 3465 the it will move towards ATH test which is around 3500
Disclaimer: Forex is Risky
Xauusdidea
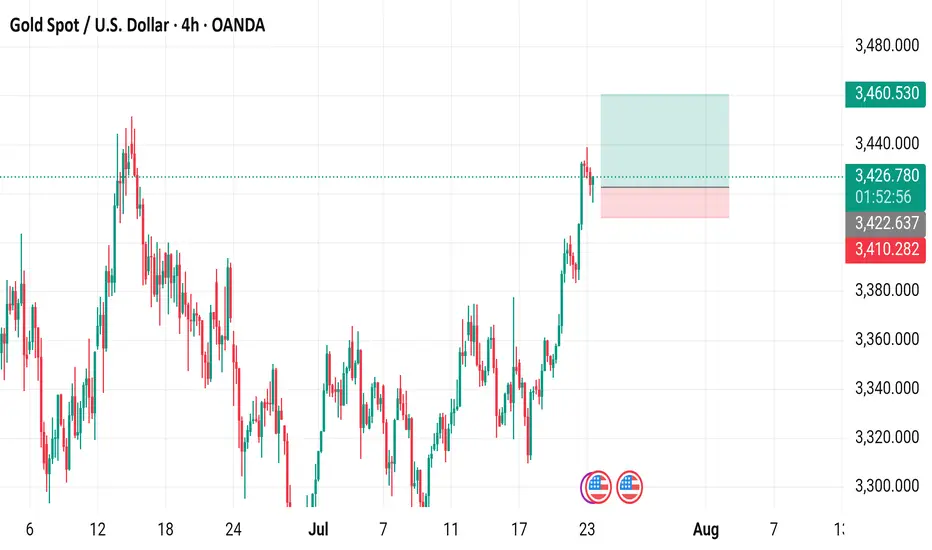
Gold Spot / U.S. Dollar (XAUUSD) - 4 Hour Chart (OANDA)4-hour chart from OANDA displays the price movement of Gold Spot (XAUUSD) from late July to early August 2025. The current price is 3,426.260, with a recent decrease of 5.185 (-0.15%). The chart shows a buy price of 3,426.580 and a sell price of 3,425.950, with a resistance level around 3,460.530 and support near 3,410.282. The data reflects trading activity as of 01:54:22 on July 23, 2025.
Elliott Wave Analysis – XAUUSD July 23, 2025________________________________________
🔍 Momentum Analysis:
• D1 Timeframe: Daily momentum is showing signs of a potential bearish reversal. We need to wait for today’s daily candle to close to confirm this. It signals that the bullish momentum is weakening.
• H4 Timeframe: Momentum is turning down. It may take around 2 more bearish H4 candles to push momentum into the oversold zone → suggesting continued downside movement today.
• H1 Timeframe: Momentum is already in the oversold zone and the indicators are “clinging” together → implying possible continued minor declines or sideways movement.
________________________________________
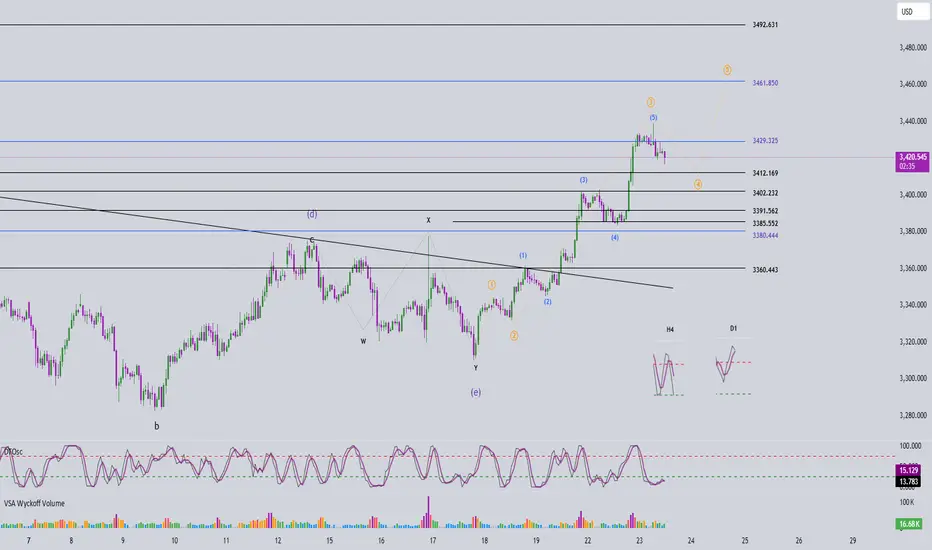
🌀 Elliott Wave Structure Update:
• On the H1 chart, a 5-wave structure (yellow) is unfolding.
o Wave 3 (yellow) appears completed, supported by a clear 5-wave internal structure in blue.
o The market is currently in Wave 4 (yellow) – a corrective move.
🔸 Potential Wave 4 (yellow) targets:
• Target zone 1: Around 3412
• Target zone 2: Around 3402
📌 Once Wave 4 (yellow) completes, we anticipate the market will form Wave 5 (yellow).
🔸 Projected Wave 5 (yellow) targets:
• TP1: 3461
• TP2: 3492 (in case of an extension)
________________________________________
🔄 Combining Momentum & Wave Structure:
• The potential bearish reversal in D1 momentum suggests the current bullish trend may be nearing its end – consistent with Wave 5 being the final push before a broader correction.
• H4 and H1 momentum support the ongoing correction in Wave 4.
✅ Wave 4 typically takes the form of a zigzag, flat, or triangle → Wait for a strong bullish H1 candle to confirm the end of Wave 4 and initiate a buy entry.
________________________________________
📊 Trade Plan:
🟩 Buy Zone 1:
• BUY ZONE: 3414 – 3412
• SL: 3407
• TP1: 3439
• TP2: 3461
• TP3: 3492
🟩 Buy Zone 2:
• BUY ZONE: 3403 – 3401
• SL: 3393
• TP1: 3439
• TP2: 3461
• TP3: 3492
xauusd:3450-3500?Combined with the trend of the US dollar index, the probability of continuing to fall in the short term is high. Today, the manufacturing industry is significantly bullish for gold prices, which is expected. Powell's speech in an hour will be the key factor in today's New York market.
The pressure of interest rate cuts is imminent. Will Powell continue to insist on not cutting despite all objections? This is what we need to pay attention to. Make two plans. First, continue not to cut interest rates, the US dollar will be supported, and gold will retreat. If there is a retracement of 3400-3410 points, it needs to be paid attention to. Second, it is not discussed. Or interest rate cuts are beneficial to gold prices. This is the driving force for gold prices to hit 3500-3450.
To be honest, the conclusion of the Band Trading Center Research Institute tends to the latter. So if you buy, you need to set TP/SL strictly.
Gold (XAU/USD) 4‑Hour Technical Analysis: July 23, 2025Gold continues to trade in a bullish structure on the 4‑hour timeframe, holding above $3,420 after a steady advance from early July lows. At the time of writing, XAU/USD stands at $3,423.8, confirmed by Investing.com. This analysis employs a comprehensive blend of globally‑recognized technical tools — ranging from price action and classical indicators to institutional concepts — to identify the most probable trading zones and a high‑conviction setup.
Current Price Structure and Trend
On the 4‑hour chart, gold maintains a clear bullish market structure, consistently printing higher highs and higher lows since early July. The current price action unfolds within a well‑defined rising channel, bounded approximately between $3,400 on the lower side and $3,450 on the upper. Twice in the past week, price has tested and respected the channel’s lower boundary, confirming its validity.
Support and resistance levels are evident: immediate support lies at $3,410, coinciding with the 50% Fibonacci retracement of the July impulse wave. Below that, $3,390–$3,395 offers secondary support at the channel’s base and a longer‑term Fibonacci cluster. Resistance is concentrated at $3,445–$3,450, aligning with the channel top, upper Bollinger Band, and prior swing highs, while a secondary ceiling may emerge near $3,468–$3,470, corresponding to an Elliott Wave 3 extension target.
Candlestick, Volume, and Momentum
Recent price action has been supported by bullish candlestick formations. Notably, a strong bullish engulfing bar formed at $3,410 earlier this week, affirming institutional demand at that level. Volume profile analysis shows the heaviest transaction cluster between $3,410–$3,420, confirming this area as a smart money accumulation zone.
Volume‑weighted average price (VWAP ) currently runs near $3,418, with price holding above it, reflecting institutional positioning in favor of the bulls. Momentum indicators support the trend: MACD on the 4‑hour has just crossed bullish, RSI prints at 60 — strong but not overbought — and ADX climbs to 24, indicating a trend strengthening phase.
Indicators, Patterns, and Institutional Concepts
Trend indicators reinforce the bullish view. The 50‑ and 100‑period exponential moving averages converge around $3,415–$3,420, providing dynamic support. Ichimoku analysis shows price well above the Kumo (cloud), with a bullish Tenkan‑Kijun configuration. Bollinger Bands are widening, and price is leaning toward the upper band — a classic signal of volatility expansion in trend direction.
Classical and harmonic patterns offer further evidence. The current consolidation resembles a bull flag, suggesting continuation. Elliott Wave analysis points to a third wave in progress, with an upside projection into the $3,448–$3,468 area. Smart money concepts confirm that the recent break above $3,420 constituted a bullish break of structure (BOS), with price now retracing into a favorable gap (FVG) and a 4‑hour bullish order block anchored around $3,410–$3,415.
Liquidity and stop‑clusters likely sit above $3,445 and $3,468, making these logical targets for bullish campaigns.
Market Context and Sentiment
Gold is benefiting from a softening US dollar and a drop in volatility indexes. Seasonal tendencies also lean bullish into late summer. Sentiment on professional platforms aligns with this view: TradingView top authors and FXStreet analysts favor buying pullbacks into $3,410–$3,415 and targeting $3,450–$3,468, which harmonizes with this analysis. No major divergence from consensus is noted, adding to confidence.
Identified Trading Zones
Two strong buy zones emerge on the 4‑hour chart. The most immediate and highest‑confidence zone is $3,410–$3,415, supported by channel support, Fibonacci retracement, VWAP, moving averages, and an order block. Below this lies a secondary buy zone at $3,390–$3,395, tied to deeper Fibonacci support and the rising channel’s lower boundary.
On the other hand, clear sell zones are defined at $3,445–$3,450, where upper channel resistance, Bollinger bands, and prior highs converge, and a secondary zone at $3,468–$3,470, aligned with wave targets and round‑number psychological resistance. These areas are likely to attract profit‑taking and potential reversals.
The Golden Setup
Among the findings, one trade stands out as the highest‑conviction setup:
A long position at $3,415, with a stop loss at $3,405 and a take profit at $3,450.
This trade is backed by strong confluence: price pulling back into a well‑defined demand zone ($3,410–$3,415) that features order block support, Fibonacci retracement, VWAP alignment, EMA cluster support, and a rising channel boundary. The target sits just below the first significant resistance band ($3,445–$3,450), offering a favorable risk‑to‑reward ratio. The confidence level on this setup is rated at 8/10, given the multi‑method alignment and consistent sentiment from professional sources.
Summary Table
Category Levels / Details
Buy Zones $3,410–$3,415, $3,390–$3,395
Sell Zones $3,445–$3,450, $3,468–$3,470
Golden Setup Long @ $3,415 / SL $3,405 / TP $3,450 (Confidence: 8/10)
In conclusion, gold maintains a constructive technical outlook on the 4‑hour timeframe. The prevailing bullish structure, reinforced by classical and institutional methodologies, supports a continuation toward the $3,450–$3,468 region. The suggested Golden Setup provides a disciplined, high‑probability entry at a key inflection zone, consistent with both technical evidence and prevailing market sentiment.

GOLD: Price Made A New HHLooking to buy gold, market structure is bullish on the H1 and H4. I went over 2 different scenarios in the video...
1. Pullback Entry (Preferred)
🟢Entry Zone: 3365–3380
TP1: 3432
TP2: 3450
TP3: 3475–3500 (extended target if momentum holds)
2. Breakout Buy (Aggressive)
Trigger: M15 breaks and closes above 3405–3410 with strong displacement.
Entry: Retest of breakout zone at 3402–3405
Same Targets
Don't forget to set those price alerts!

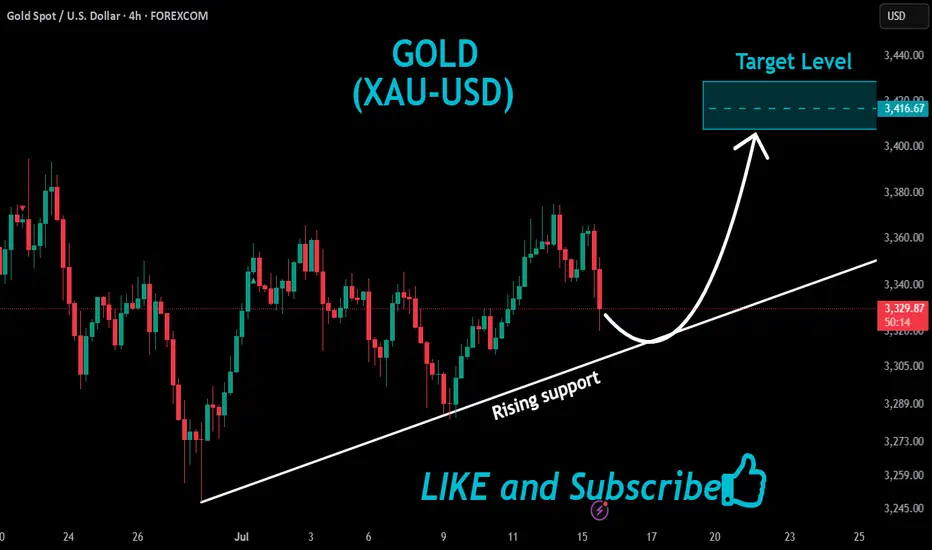
GOLD Will Keep Growing!
HI,Traders !
#GOLD keep trading in
An uptrend along the rising support
So as the pair is approaching
A the support we will be
Expecting a bullish rebound !
Comment and subscribe to help us grow !
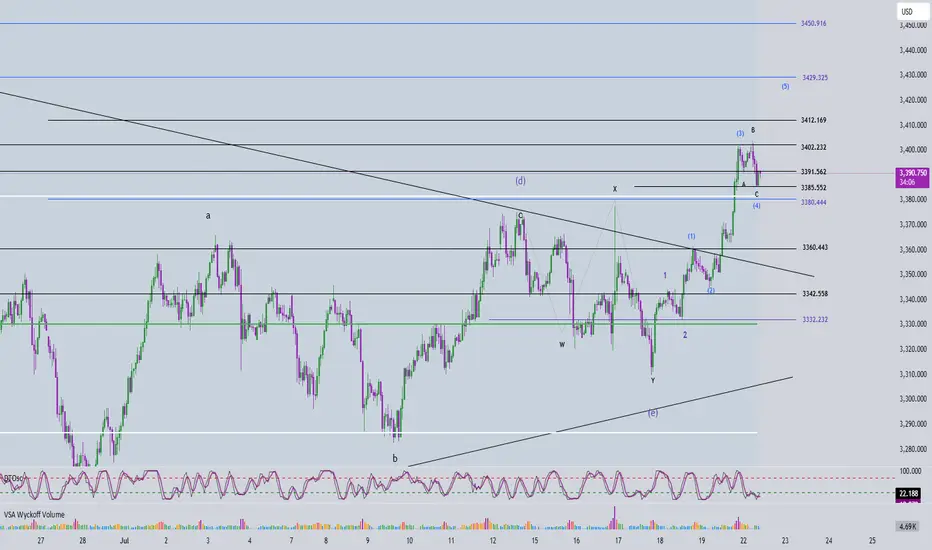
Elliott Wave Analysis – XAUUSD | July 22, 2025
🔍 Momentum Overview
• D1 timeframe: Momentum has entered the overbought zone, signaling a potential reversal within the next 1–2 sessions. That said, the current bullish leg may still extend — it’s important to wait for tomorrow’s D1 candle close for confirmation. Entering overbought territory is a warning that upside momentum is weakening.
• H4 timeframe: Momentum is currently declining. Unless a strong bullish candle closes above 3391 to trigger a reversal, the price is likely to continue moving sideways or downward today.
• H1 timeframe: There are signs of a bullish reversal. If the price holds above 3385 and posts a strong breakout candle above 3391, it could present a short-term buying opportunity.
🌀 Elliott Wave Structure Update
• Price is consolidating within the 3390 – 3402 range — a key zone to monitor closely.
• The 3380 level is a critical threshold, aligned with the 0.382 Fibonacci retracement of Wave (3). A daily close below this level would raise the possibility that the move is part of a correction rather than Wave 4.
• A flat ABC correction is currently unfolding, with the 1.618 extension of Wave A already reached at 3385.
• If price breaks below 3360, it would overlap with the previous Wave 1, invalidating the current impulsive wave count. In that case, we should consider the potential continuation of a larger abcde triangle correction.
🔗 Momentum & Wave Structure Combined
• H1 is showing early signs of a bullish reversal, but H4 momentum remains bearish. Without a strong breakout candle above 3391, price is likely to drift sideways or lower until H4 reaches the oversold zone.
• Conservative approach: Wait for H4 to enter oversold territory before considering any long positions.
• The ideal buy setup would be a bullish reaction from the 3382 – 3380 zone.
📈 Trade Setup
• Buy Zone: 3382 – 3380
• Stop Loss: 3372
• Take Profit 1: 3402
• Take Profit 2: 3412
• Take Profit 3: 3428
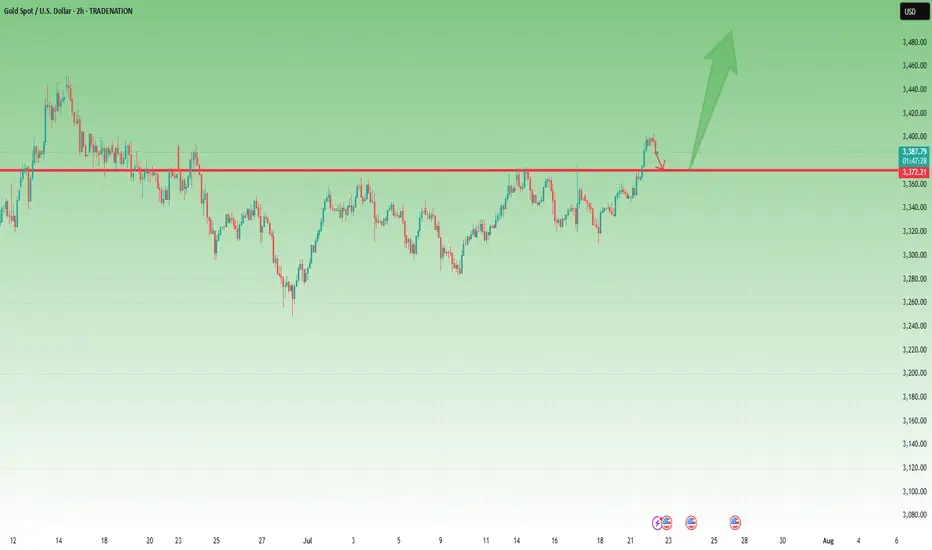
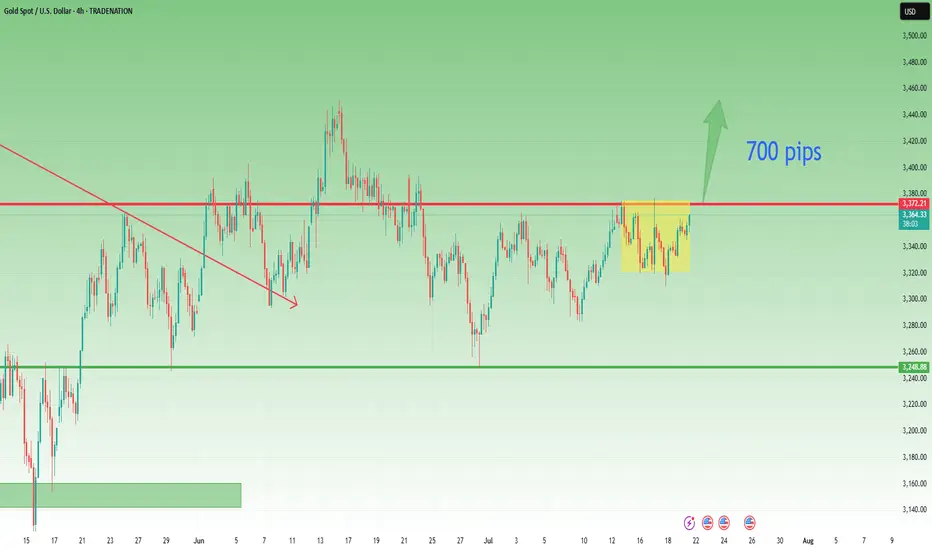
Gold - Above 3370 Is Bullish Territory – But 3360 Must Hold📆 What happened yesterday?
After more than a week of frustrating, sideways price action, Gold finally broke out above the key 3370 resistance zone.
The breakout was clean and impulsive, with TRADENATION:XAUUSD pushing to an intraday high around 3400.
Following that move, price printed a small double top near the high and began a modest correction — perfectly normal after such a breakout. At the time of writing, Gold trades at 3385, still holding above former resistance.
📈 Why this breakout matters:
The daily close at 3396 came in strong and near the top, leaving behind a clear Marubozu candle
This kind of price action signals conviction and momentum
The breakout confirms what I’ve been anticipating for days — the range is resolved, and the market is choosing the bullish path
🎯 What to expect next:
If price stabilizes above 3400, the road to 3450 opens — which is the target mentioned in my previous analyses
That area represents the next major resistance and likely magnet for price if bulls stay in control
🧭 Trading Plan:
For me, the plan is now simple:
✅ Buy the dips — especially on a potential retest of the 3370–3375 broken resistance, which now turns into support
❌ Negation comes only with a daily close below 3360, which would invalidate this breakout and raise questions
📌 Conclusion:
The breakout has finally come. After days of coiling, Gold chose the upside.
Momentum is building, structure is clean, and bulls are back in control — unless 3360 fails.
Until then, I remain bullish, looking to buy dips into strength. 🚀
Disclosure: I am part of TradeNation's Influencer program and receive a monthly fee for using their TradingView charts in my analyses and educational articles.
GOLD Still Bullish , Are You Ready For New Wave ? 200 Pips ValidHere is My 15Mins Gold Chart , and here is my opinion , we finally above 3400.00 and we have a 30 Mins Candle closure above this strong res , so i`m waiting the price to go back and retest this res and new support and give me a good bullish price action to can enter a buy trade and we can targeting 200 pips , and if we have a 4H Closure Above This res this will increase the reasons for buyers , just wait the price to back a little to retest it and then we can buy it . if we have a daily closure below it this idea will not be valid anymore .

Absolutely! Here's a Scalping Analysis in English markdown forma## 🪙 Gold (XAU/USD) Scalping Plan – July 22, 2025
**Chart: 15-Minute (Heikin Ashi) – OANDA**
---
### 🔍 Market Structure:
- **Current Price**: 3,389.30 USD
- **Recent BOS (Break of Structure)** confirms bullish momentum up to the **3,402 level (Premium Zone)**.
- We’ve seen **CHOCHs** (Change of Character) confirming early exhaustion.
---
### 📐 Fibonacci Zones:
| Level | Price (USD) | Significance |
|--------------|---------------|------------------------|
| 0.236 | 3,382.93 | First minor support |
| 0.382 | 3,371.00 | Equilibrium zone |
| 0.5 | 3,361.36 | Institutional entry |
| 0.618 | 3,351.72 | Deep retracement zone |
| 0.786 | 3,338.80 | High-probability reversal |
| 1.0 | 3,320.52 | Final OB/Support base |
| 1.3 (forecast)| 3,296.01 | Extended target zone |
---
### 🧠 Scalping Setup:
- **Short-term Shorts** from the **Premium zone (3,402 → 3,382)** are already in play.
- Targeting the **0.382 retracement** initially, with continuation to 0.5 and **Order Block (OB)** near **3,351**.
- If price reaches 0.618 or 0.786, we enter **Buy Setup Zone** for intraday bullish bounce.
- Strong OB visible between **3,320–3,338**; ideal for scalping longs with tight SL.
---
### 🎯 Scalping Strategy:
#### ✅ Sell Setup:
- Entry: 3,398–3,402
- TP1: 3,382
- TP2: 3,371
- SL: 3,407
#### ✅ Buy Setup:
- Entry: 3,351–3,338
- TP1: 3,366
- TP2: 3,389
- SL: 3,329
---
### 🧭 Notes:
- Watch USD news events marked on the chart (🟦).
- Avoid entering trades near high-impact data drops.
- Focus on **reaction at OB zones + confluence with Fib** for sniper entries.
---
> ⚠️ **Reminder**: Scalping is all about precision & discipline. Stick to your SL and plan!

GOLD Intraday H1 Chart Update For 22 July 2025Hello Traders,
Today we have FED Chair Powell Speech ahead
all eyes on 3400 Psychological Level Break for now, if market successfully breaks 3400 then it will move towards 3435
below 3400 it will move back towards 3350 level
Disclaimer: Forex is Risky

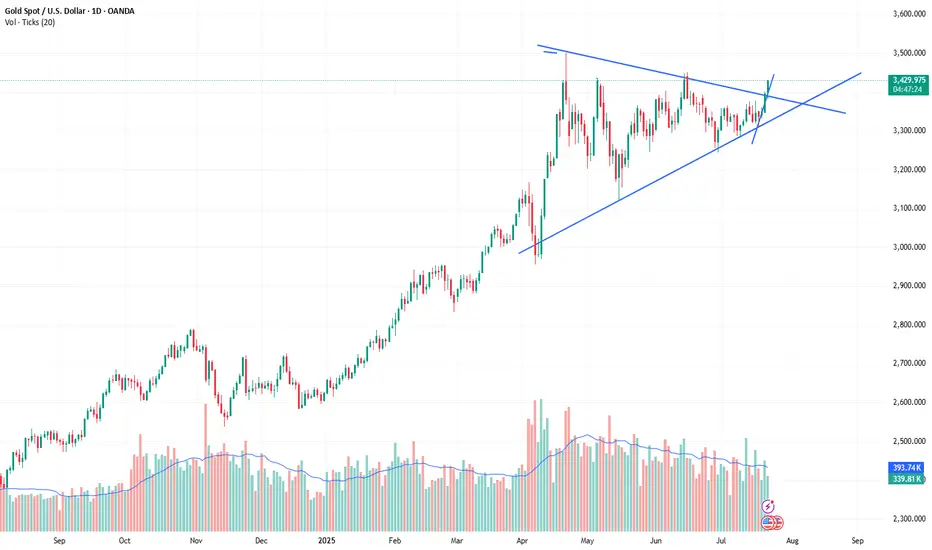
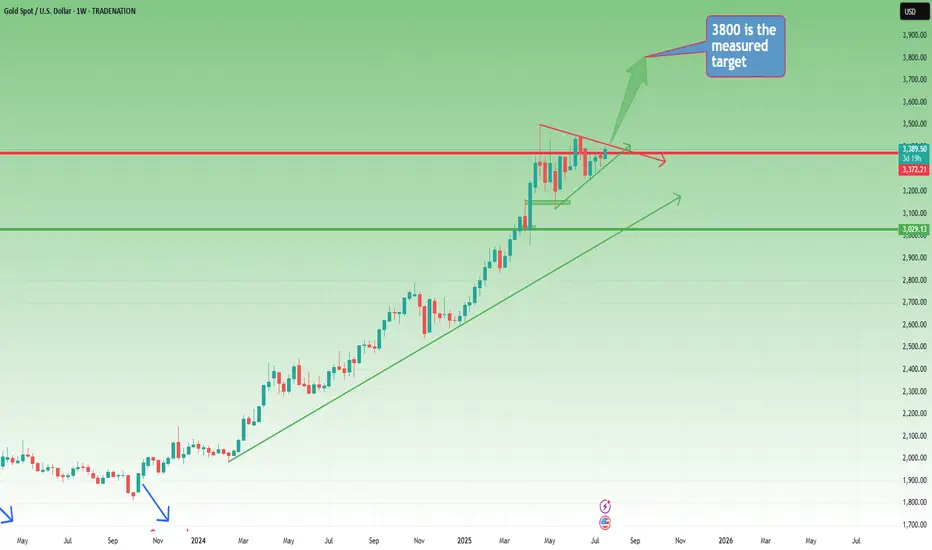
Weekly Outlook: Gold Builds Pressure – Is the Big Move Coming?📆 Big Picture View
Since the start of 2024, Gold has been moving in a well-defined long-term bullish trend.
Yes, there were meaningful pullbacks along the way — but the direction was never in doubt. Step by step, Gold climbed over 15,000 pips in just over a year, reaching a new all-time high in late April.
📉 Post-ATH: A Period of Stabilization
After peaking, Gold shifted into consolidation mode, with price gravitating around the 3300 zone.
This sideways movement has been ongoing for the past three months, but it’s not a sign of weakness — it’s the market catching its breath.
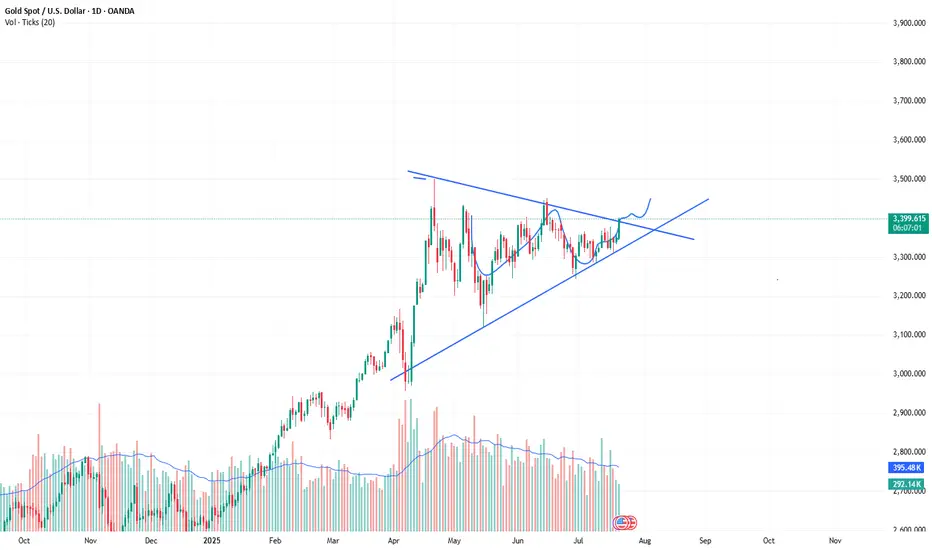
On the weekly chart, this consolidation is now forming a symmetrical triangle, a classic continuation pattern that often appears mid-trend.
📐 The Technical Setup
- The symmetrical triangle shows compression of volatility
- Buyers and sellers are slowly converging toward a decision point
- A breakout is approaching, and when it comes, it could be explosive
🎯 What’s the Trigger?
- A confirmed break above 3450 would validate the triangle breakout
- That opens the door to quickly test the 3500 round figure
- The measured target for the triangle sits at 3800
Given the time Gold has spent consolidating (3+ months), this target could realistically be reached by year’s end
🧭 Strategic Takeaway
- As long as Gold holds above 3300, the bullish structure remains valid
- Breakout above 3450 is the green light for the next leg up
- Until then, the consolidation continues, and smart money prepares
📌 Conclusion:
Gold is building pressure. The weekly triangle is maturing.
This isn’t the end — it’s the pause before the next move.
Stay patient. Stay focused.
Because if 3450 breaks… 3800 is not a dream — it’s a destination. 🚀
Disclosure: I am part of TradeNation's Influencer program and receive a monthly fee for using their TradingView charts in my analyses and educational articles.
P.S: Here you have a short term analysis on Gold
July 21: Key Resistance at 3358–3366, Breakout Targets 3378–3388Good morning, everyone!
Last Friday, gold tested the support around 3332 but did not break below it. The price then rebounded to the 3358 zone, where it encountered selling pressure and pulled back. At today's open, the price retraced to the 3343 level, where support held well, prompting another rally back toward 3358.
It’s important to note that since the 3358 resistance was already tested on Friday, some of the selling pressure has likely been absorbed. As a result, there is a higher probability of a breakout today. If a breakout occurs, the next key resistance lies at 3366/3372–3378. In the case of strong bullish momentum, the price may extend further toward the 3386–3392 resistance zone.
However, if the price continues to be capped below 3358–3366, we may see a consolidation or short-term pullback. In this case, watch support at 3348–3343. Should the price successfully break above 3378, then support on pullbacks will shift higher to 3363 and 3358–3352.
🔺 Key Warning: The 3358 resistance zone is technically crucial. If the price repeatedly fails to break through, watch out for a potential double-top pattern on the 30-minute chart, which could signal a near-term bearish reversal.
7/ 22: Focus on Selling at Highs, Key Support at 3378–3372Good morning, everyone!
I’ve unfortunately injured my lower back and will need to rest in bed for a while, so I’ll keep today’s market commentary brief.
Yesterday, gold rallied to test the 3400 level, a key psychological and technical resistance area that naturally triggered notable selling pressure. Given this, chasing long positions at current levels is not recommended.
On the downside, support is seen near 3378. If this level holds, the price may attempt another rebound. On the upside, key resistance levels to watch are:
3407 as the initial resistance
3416–3423 as the stronger resistance zone
For today’s trading strategy, consider focusing on selling into strength near resistance levels. Once the selling pressure is absorbed, there may be an opportunity to re-enter on the long side at lower levels, allowing for better risk management and entry conditions.

XAUUSD:The next target is 3430.The market is developing completely in accordance with the expectations of the band trading center. Today is a day of sharp rise. As Monday, this increase is quite considerable.
The three reminders to buy are all at a lower position. The post clearly points out that the market has reached 3400. 3400 is a controversial position. It needs to fluctuate in the New York market, and then there will be some breakthroughs. If it is stronger, it will directly break through the New York market. In the short term, you can pay a little attention to the retracement position of 3390-3395. Then continue to buy. The next target is 3430.
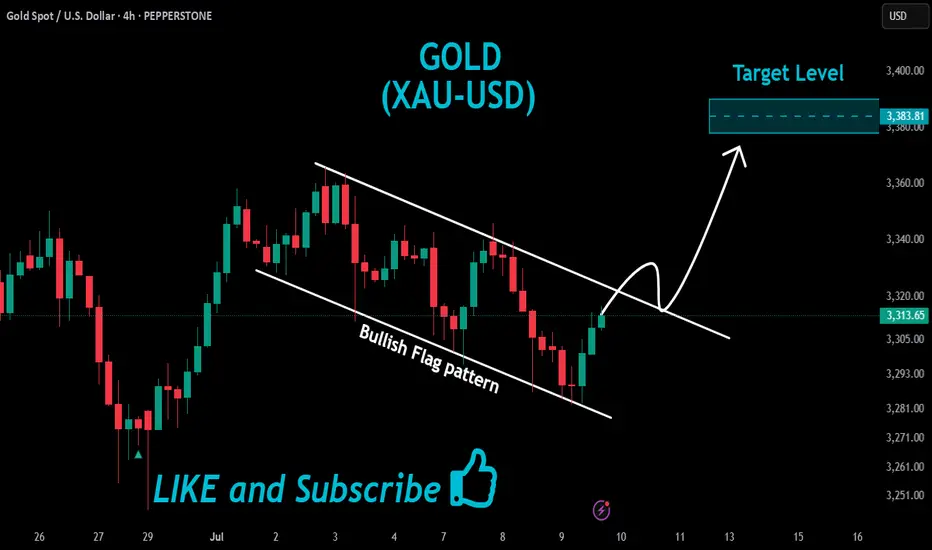
GOLD Wait For Breakout!
HI,Traders !
#GOLD has formed a Bullish Flag pattern
While trading in an uptrend As
we mentioned in a previous analysis
So we are bullish biased and
IF we see a bullish breakout
We will be expecting a
Further bullish move up !
Comment and subscribe to help us grow !
GOLD Breakout Done , Long Setup Valid To Get 200 Pips !Here is My 30 Mins Gold Chart , and here is my opinion , we finally above 3377.00 and we have a 30 Mins Candle closure above this strong res , so i`m waiting the price to go back and retest this res and new support and give me a good bullish price action to can enter a buy trade and we can targeting 200 pips , and if we have a 4H Closure Above This res this will increase the reasons for buyers , just wait the price to back a little to retest it and then we can buy it . if we have a daily closure below it this idea will not be valid anymore .

Elliott Wave Analysis – XAUUSD July 17, 2025
🔍 Momentum Analysis
D1 timeframe: Momentum is still trending downward, but we’re starting to see signs of convergence between the indicator lines. Normally, we would expect another two daily candles to reach the oversold zone and trigger a potential reversal. However, with the current narrowing pattern, we cannot rule out the possibility of an earlier reversal. Today’s daily close will be crucial for confirmation.
H4 timeframe: Momentum is clearly declining, suggesting that the market may either continue downwards or consolidate sideways throughout the day.
🌀 Elliott Wave Structure
On the H4 chart, price action is compressing tightly at the end of a symmetrical triangle pattern – a classic setup in Elliott Wave theory. Notably, this final point of compression coincides with the POC (Point of Control), indicating a key price level where high volume has accumulated.
Wave W (in black) follows a 3-wave structure. Yesterday, price surged to the beginning of wave W and then sharply reversed, forming the basis for two potential scenarios:
Scenario 1 – WXY structure with current price completing wave Y within wave e (green):
+ Target 1: 3327
+ Target 2: 3303
Scenario 2 – Wave e (green) evolves into a triangle:
+ In this case, price may consolidate sideways above the 3327 zone.
🔗 Combining Wave and Momentum Analysis
Both D1 and H4 momentum indicators are still pointing downward. However, the price candles appear overlapping and lack clear directional strength – a common trait of compression near the triangle’s apex. With price sitting right on the POC, there’s a high chance of continued tightening before a breakout. At this stage, the recommended strategy is to wait for a strong bullish candle at one of the target zones before entering a BUY position.
📈 Trade Setup
✅ Scenario 1 – BUY at 3327 – 3326
+ Stop Loss: 3317
+ Take Profit 1: 3342
+ Take Profit 2: 3358
+ Take Profit 3: 3402
✅ Scenario 2 – BUY at 3305 – 3302
+ Stop Loss: 3295
+ Take Profit 1: 3327
+ Take Profit 2: 3358
+ Take Profit 3: 3402

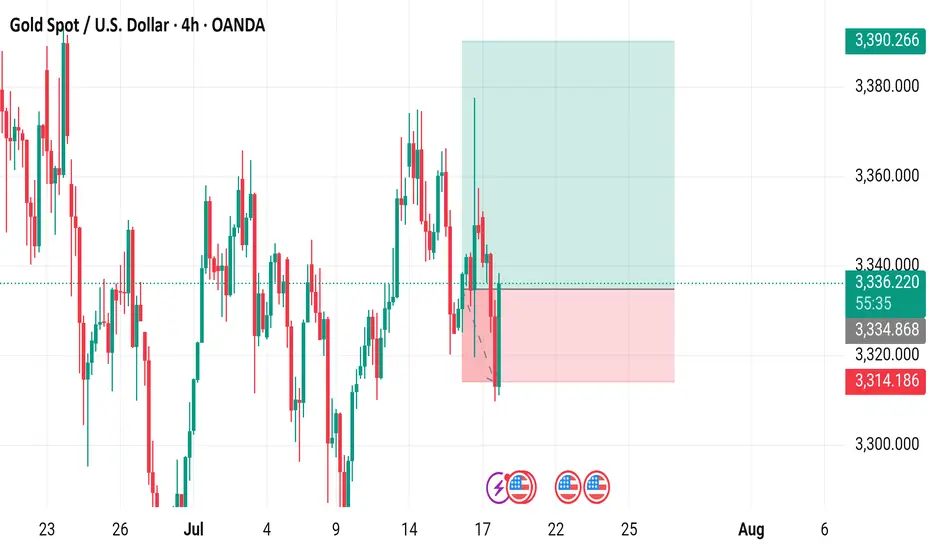
Gold Spot / U.S. Dollar (XAU/USD) 4-Hour Chart - OANDA4-hour chart displays the price movement of Gold Spot (XAU) against the U.S. Dollar (USD) from late July to early August 2025. The current price is 3,390.266, with a recent decrease of 10.870 (-0.32%). Key levels include a sell price of 3,336.420 and a buy price of 3,337.020, with a resistance zone highlighted between 3,340.720 and 3,380.000, and a support zone around 3,314.186. The chart includes candlestick patterns and trading indicators.
Gold Outlook – The Range Holds, Direction Still Pending📆 What happened recently?
Since the middle of last week, I’ve been repeating the same core idea like a broken record:
👉 “Gold needs to break out of the range to define its next real move.”
And once again, on Friday, TRADENATION:XAUUSD respected the structure, fluctuating quietly and closing the week right in the middle of the range — no breakout, no confirmation.
📈 Current status:
The new week opened with some bullish interest, and at the time of writing, Gold trades around 3363. Still inside the box.
So far, no technical change, and certainly no resolution.
❓ What am I watching for?
A clear break above 3375 → confirms bullish continuation
A decisive break below 3320 → confirms reversal potential
Until then, everything in between is noise and chop.
🧭 Trading plan:
My stance remains unchanged:
⏳ No position. No bias. Just waiting.
Once we get confirmation in either direction, I’ll take action.
📌 Conclusion:
Gold is still locked inside the range. The market is coiling, but no side is winning yet.
Patience here is a weapon — and I’m keeping it loaded. 🚀
Disclosure: I am part of TradeNation's Influencer program and receive a monthly fee for using their TradingView charts in my analyses and educational articles.
gold on sell#XAUUSD sell at 3362, the candle is rejecting on bullish which will make retracment on the price.
Entry below 3362 on H1 or M15 closure. Target 3344, stop loss 3372.
Bullish can break following longer candle closure on H1.

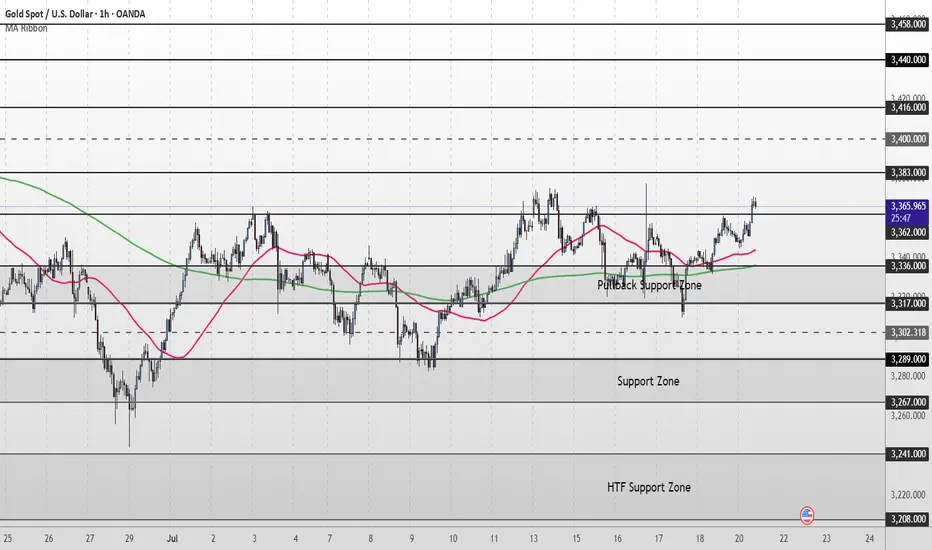
XAU/USD Intraday Plan | Support & Resistance to WatchGold has extended its recovery and is now trading around 3,366, pushing into the next resistance cluster.
Price is holding firmly above both the 50MA and 200MA, which are now flattening and beginning to turn upward, acting as dynamic support.
A confirmed break and hold above 3,362 would open the path toward the next upside targets at 3,383 and 3,400, with 3,416 and 3,440 as higher‑timeframe resistance levels if momentum continues.
If price rejects the 3,362 resistance zone and fades lower, watch the Pullback Support Zone (3,336–3,317) closely. A break back below that area would shift focus to the broader Support Zone (3,289-3,267).
Failure to hold there could expose price to the deeper HTF Support Zone.
📌 Key Levels to Watch
Resistance:
3,362 ‣ 3,383 ‣ 3,400 ‣ 3,416
Support:
3,336 ‣ 3,317 ‣ 3,302 ‣ 3,289 ‣ 3,267
🔎 Fundamental Focus – Week of July 21–25
📌 Tuesday, Jul 22
Fed Chair Powell Speaks
📌 Thursday, Jul 24
Unemployment Claims
Flash Manufacturing PMI & Flash Services PMI