Gold Spot (XAU/USD) $3400 Incoming again??Gold Spot (XAU/USD) – 1H Chart:
Chart Overview:
Overall Market Context:
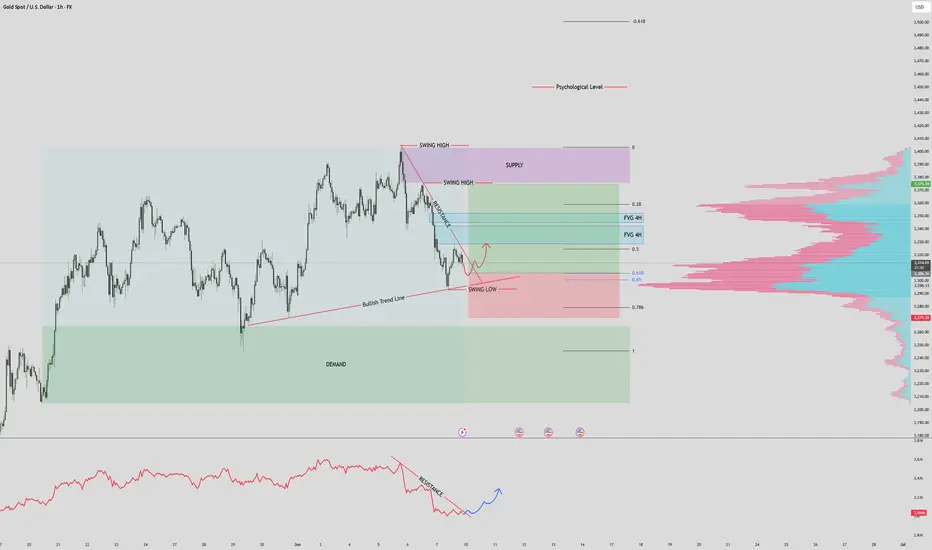
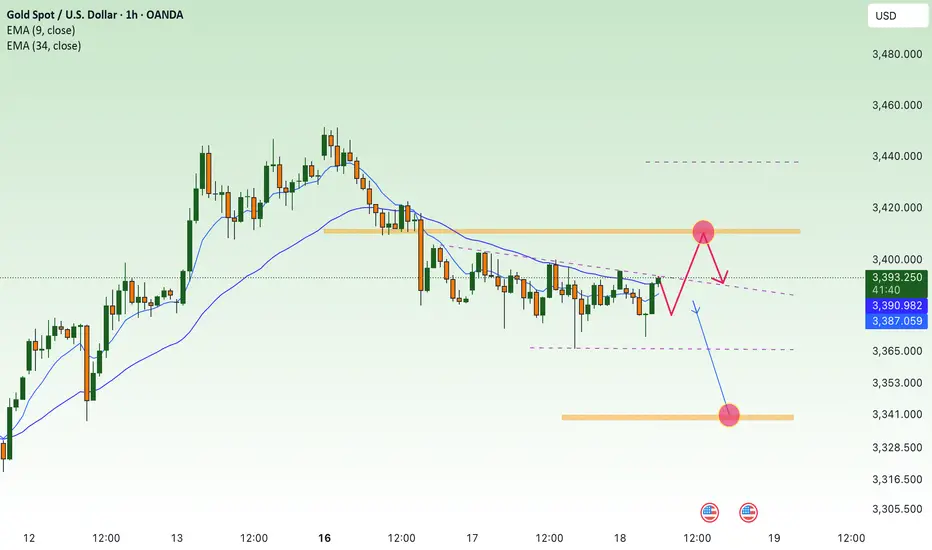
Gold is currently retracing after a strong downtrend from a swing high near the supply zone. Price is reacting near a key bullish trend line and a local swing low.
Key Technical Elements:
OBV (On-Balance Volume):
The OBV has broken out of its downtrend resistance, suggesting a potential reversal in volume flow.
This shift implies bullish momentum could be building.
Trendline & Structure:
Price is respecting a bullish trend line, which has acted as dynamic support across multiple touches.
The current swing low sits right on this trend line, suggesting a possible bounce scenario.
Fair Value Gaps (FVGs) – 4H:
Two FVGs are located above current price around the 0.28–0.5 Fibonacci zone, indicating a likely magnet area if price starts to retrace upward.
These FVGs may act as short-term targets or resistance zones.
Fibonacci Retracement:
Price is currently near the 0.618–0.65 retracement zone, a classic golden pocket reversal area.
If price holds this level, a bounce toward the FVGs and supply zone is likely.
Supply Zone:
The major resistance sits above at the supply zone formed around the previous swing highs.
A rejection here could signal a return to range or continuation lower if not broken.
Demand Zone :
Below current price, a strong demand zone is marked, which historically triggered a large upward move.
If price fails to hold the trendline/swing low, this would be the next key support area to watch.
Scenarios:
🔼 Bullish Case:
OBV breakout holds and price bounces from the trendline/swing low.
Price moves up into the FVG zones and attempts to reclaim the previous swing high.
If it breaks above the supply zone, the next logical targets would be the psychological levels (e.g., $3,400+).
🔽 Bearish Case:
Failure to hold the current trendline and swing low.
Break below could lead to a move toward the demand zone, possibly sweeping lows and filling deeper FVGs.
If volume remains weak on bounce attempts, continuation of the downtrend is likely.
Summary:
Gold is at a critical inflection point. The bullish trendline and swing low offer a potential reversal area, supported by a breakout in OBV. A recovery into the FVGs above looks likely if price can maintain this level. However, failure here would lead to a drop toward the demand zone. Traders should monitor volume, OBV continuation, and price action near FVGs for confirmation.
Xauusdlong
XAUUSD Hello traders,
There is a great opportunity for a buy trade on the XAUUSD pair, and I wanted to share it with you as well.
🔍 Trade Details
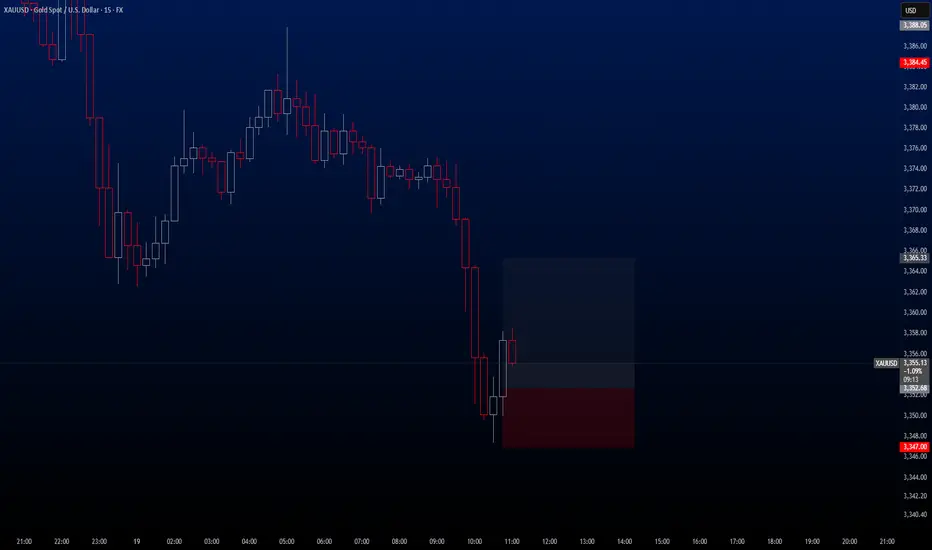
✔️ Timeframe: 15-Minute
✔️ Risk-to-Reward Ratio: 1:2
✔️ Trade Direction: Buy
✔️ Entry Price: 3352.68
✔️ Take Profit: 3365.33 / TP 2 / 3369.93
✔️ Stop Loss: 3347.00
🔔 Disclaimer: This is not financial advice. I’m simply sharing a trade I’ve taken based on my personal trading system, strictly for educational and illustrative purposes.
📌 Interested in a systematic, data-driven trading approach?
💡 Follow the page and turn on notifications to stay updated on future trade setups and advanced market insights.
GOLD H1 Intraday Chart Update For 19 June 2025Hello Traders,
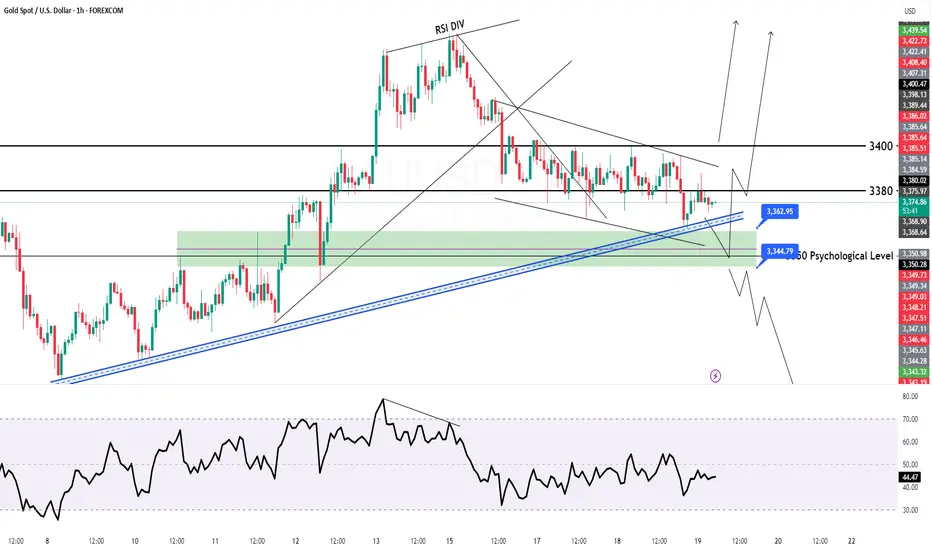
For today market still stuck in between 3350 to 3400 Psychological levels we still need to wait for clear breakout of 3400 level
Today scalping range is 3360-90 but remember must placing SL
if market goes below 3350 clearly then it will move towards 3321 Major Support level
Reminder: There is Bank Holiday in US
Disclaimer: Forex is Risky
6/19 Gold Analysis and Trading SignalsGood morning!
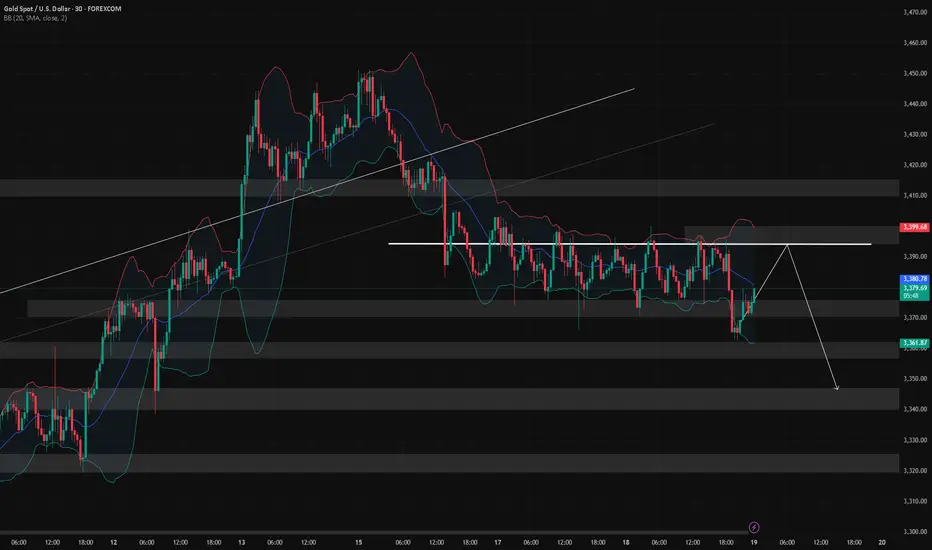
Yesterday, the Federal Reserve's interest rate decision aligned with market expectations, bringing no major surprises. The market had already priced in bearish sentiment in advance, which led gold to trade within the Bollinger Bands' upper, middle, and lower bounds, with all three bands trending sideways, indicating limited intraday volatility.
🔍 Technical Overview:
On the 30-minute chart, the Bollinger Bands began to tilt downward near the close, with price currently pressured by the middle band;
However, MACD structure suggests the middle band may be broken, with potential for price to challenge the upper band resistance near 3392–3400;
More importantly, on the 1D chart, the MACD is showing signs of a bearish crossover (death cross). If confirmed, it may break the bullish structure, weakening support from the weekly MA5;
If gold sustains below the weekly MA10 at 3317, it could open the door for a broader correction, with a drop toward 3200 becoming increasingly likely.
📊 Fundamental Factors:
Today’s U.S. market holiday means fewer economic data releases. As such, gold will likely be driven by technical structure and geopolitical headlines, especially those related to the Middle East. If no new developments emerge, selling on rallies remains the preferred strategy.
📌 Trading Plan (VIP-Focused):
✅ Sell Zone: 3392–3409
✅ Buy Zone: 3338–3321
✅ Scalp/Flexible Zones: 3387 / 3373 / 3364 / 3356 / 3345
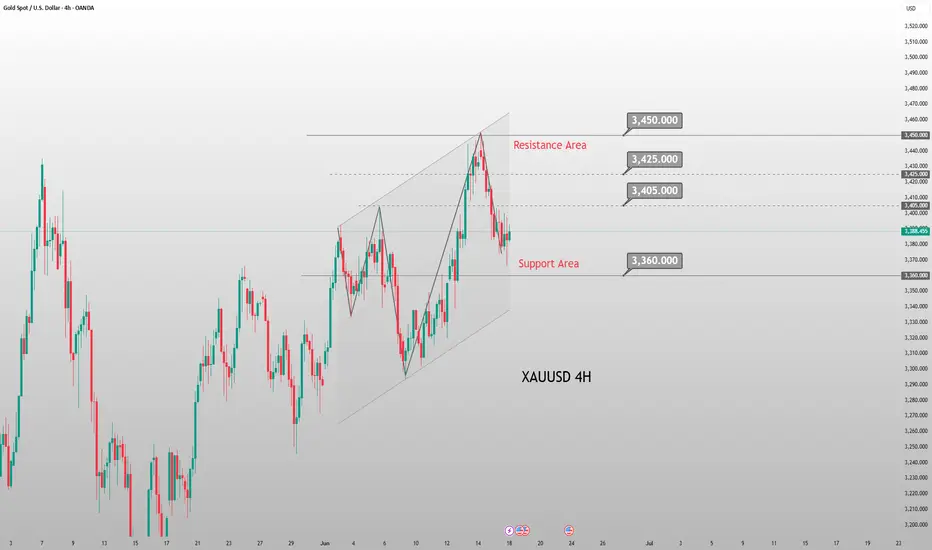
Current Gold Trend Analysis and Trading RecommendationsOn Wednesday, the morning strategy suggested going long on gold at 3,375-3,365, perfectly seizing the pullback low and rebounding to the 3,400 level as expected. Today, there is also the Fed interest rate decision. Before the data release, short positions can be taken if the 3,400-3,405 level remains unbroken. If the 3,405-3,410 level is broken, we will continue to be bullish. Gold is in short-term oscillation, so try not to chase the market. Wait for a good entry opportunity. The upper level has also been repeatedly contested recently, and the Fed data is likely to break the range after its release.
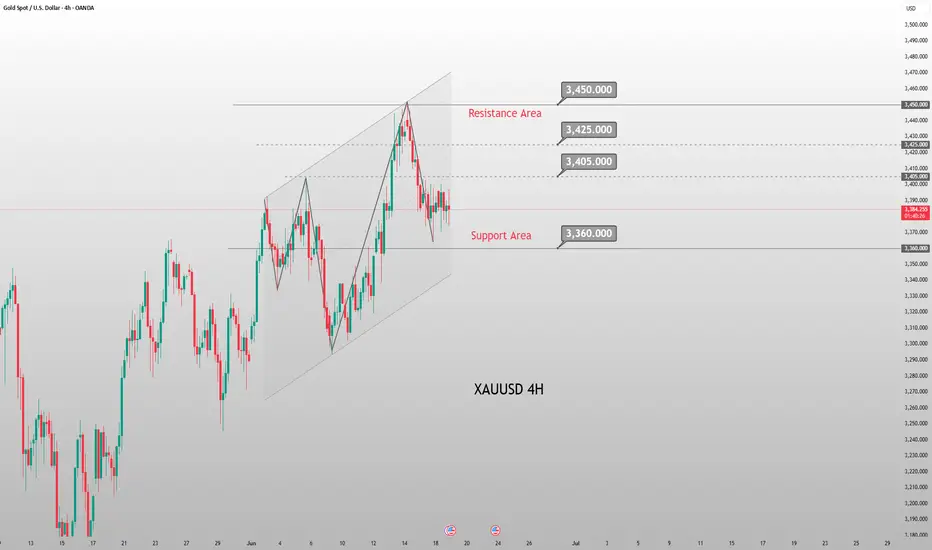
For gold, continue to adopt an oscillating approach. In the 4H cycle, it is operating below the middle band. The short-term range is 3,405-3,365. If it breaks above 3,405, it can continue to target 3,420 and 3,450. Conversely, if it breaks below 3,365, it can fall to 3,350. In operation, prioritize long positions with short positions as a supplement, and adjust the strategy when a breakout occurs.
XAUUSD
buy@3370-3375
tp:3390-3400-3420
sell@3395-3400
tp:3380-3370
Investment itself is not the source of risk; it is only when investment behavior escapes rational control that risks lie in wait. In the trading process, always bear in mind that restraining impulsiveness is the primary criterion for success. I share trading signals daily, and all signals have been accurate without error for a full month. Regardless of your past profits or losses, with my assistance, you have the hope to achieve a breakthrough in your investment.
Expect gold to break 3400 for 3430 post-FedIn recent years, after the U.S. economy was hit by a round of high inflation, inflation data has gradually shown signs of easing 📉. Logically, the weakening inflation pressure should have paved the way for the Federal Reserve (Fed) to cut interest rates, but surprisingly, the Fed has chosen to remain on the sidelines and maintain its high-interest-rate policy ⚖️. The Fed's decision to keep rates high has had a significant impact on gold prices and the U.S. dollar 💱. First, high interest rates typically push up the U.S. dollar exchange rate, thereby dampening gold demand 💰↓.
Gold's price movement this week deviated from market news or expectations 📉≠📢. Driven by geopolitical conflicts, gold rallied on Friday 📈, and the momentum continued to simmer over the weekend, leading to a gap-up opening on Monday followed by a steady decline 📉. On the hourly timeframe, the low points are gradually shifting downward, with 3,400 becoming a short-term resistance level 📊. Although gold fell from 3,452, it is clearly oscillating around 3,380 🔄
I think the Fed's interest rate decision this time may cause gold to directly break through 3400 and reach around 3430 🌟📈
⚡️⚡️⚡️ XAUUSD ⚡️⚡️⚡️
🚀 Buy@ 3380 - 3385
🚀 TP 3400 - 3430
Accurate signals are updated every day 📈 If you encounter any problems during trading, these signals can serve as your reliable guide 🧭 Feel free to refer to them! I sincerely hope they'll be of great help to you 🌟 👇

Long Trade Setup: XAUUSD 🟡 Trade Setup: XAUUSD (Gold Spot / U.S. Dollar)
Timeframe: 1H
Bias: Bullish Reversal
Type: Liquidity Trap Breakout
Instrument: Gold / USD
---
🧠 Step 1: Market Context
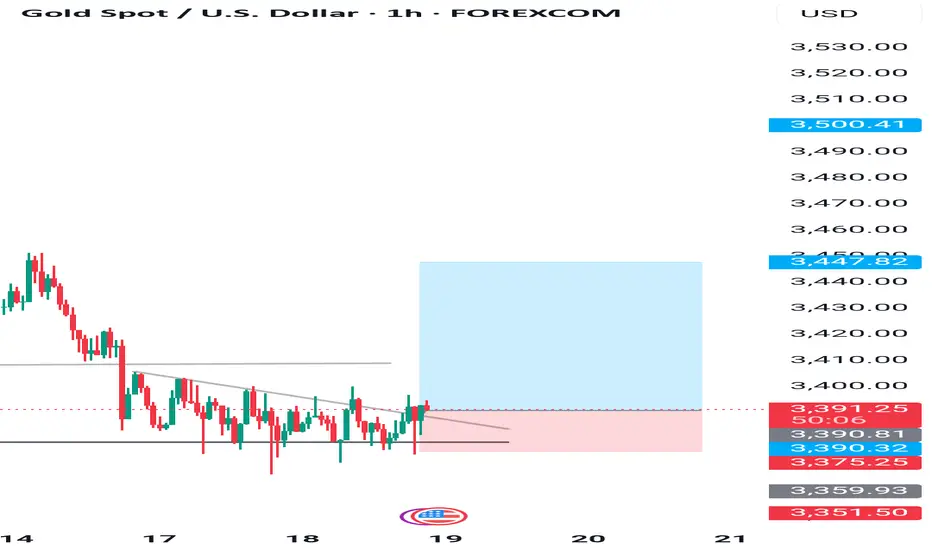
Gold has been in a downtrend, forming consistent lower lows. Recently, it broke below a key support level, making it appear like further downside is coming. However, price has since moved sideways, suggesting loss of bearish momentum.
---
🎯 Step 2: Liquidity Trap Detected
This breakdown below support seems to be a false move, possibly engineered to:
Trigger stop-losses below the previous low
Attract sellers expecting further downside
Create sell-side liquidity for institutions
This pattern is known as a liquidity trap or stop hunt.
---
📏 Step 3: Confirmation from Price Action
A descending trendline breakout is visible on the 1H timeframe.
Price broke out, retested the trendline, and is now showing bullish candles.
This signals potential accumulation and trend reversal.
---
💼 Step 4: Trade Details
Entry: 3,393.73
Target (TP): 3,500.41
Stop Loss (SL): 3,351.50
Risk to Reward Ratio: ~2.5:1
This trade offers a solid risk-managed setup, ideal for intraday to short-swing traders.
---
🔍 Step 5: What to Watch For
Watch for bullish continuation above 3,400.
If price closes above 3,420, breakout buyers may join in.
If price drops below 3,375, exit and reassess.
---
📌 Summary
This trade banks on the idea that smart money is accumulating positions while retail traders are trapped short. The risk-reward ratio is favorable, and technical signals align for a potential upside move.
XAUUSD, Gold analysis, Liquidity trap, Stop hunt, Trend reversal, Technical analysis, Gold breakout, Smart money move
#XAUUSD #Gold #Breakout #LiquidityTrap #TechnicalAnalysis #SmartMoney
#Forex #TradingView #GoldAnalysis #PriceAction #TrendReversal #RiskReward
Gold should focus on Federal Reserve news.Gold is experiencing short-term volatility influenced by the Federal Reserve's interest rate decision. It is advisable to avoid chasing the market and wait for favorable entry opportunities. The upper resistance level has been a site of repeated tug-of-war recently. Following the release of Fed data, there is a high probability that the trading range will be broken. From a 4-hour technical analysis perspective, the key support level for gold remains at 3,370, while the short-term resistance level is focused on 3,420.
you are currently struggling with losses,or are unsure which of the numerous trading strategies to follow,You have the option to join our VIP program. I will assist you and provide you with accurate trading signals, enabling you to navigate the financial markets with greater confidence and potentially achieve optimal trading results.
Trading Strategy:
buy@3370-3375
TP:3400-3405
Current Gold Trend Analysis and Trading RecommendationsOn Tuesday, gold dipped to around $3,374 in the early trading session, then rebounded to the intraday high. In the U.S. trading session, it is currently quoted at about $3,388, approaching the psychological level of $3,400. From the 4-hour chart of gold, the current upward momentum remains intact. The support below is focused on around $3,350, and the strong support is highlighted in the $3,350-$3,330 area, which is also the position of the 5-week moving average. Only by breaking the $3,350 area is there hope to reverse the trend and fall completely. If it does not break here, the bulls may still repeat.
Regarding the current trend, gold tends to continue to test the bottom and then rebound, maintaining a large range of sweeping. In terms of operation, it is recommended to go long when gold rebounds to the vicinity of 3370-3360, with the target looking at the 3490-3400 range. The short strategy is to go short near 3400, with the target looking at the 3370-3350 line.
XAUUSD
buy@3370-3360
tp:3390-3400
sell@3395-3400
tp:3370-3350
Investment itself is not the source of risk; it is only when investment behavior escapes rational control that risks lie in wait. In the trading process, always bear in mind that restraining impulsiveness is the primary criterion for success. I share trading signals daily, and all signals have been accurate without error for a full month. Regardless of your past profits or losses, with my assistance, you have the hope to achieve a breakthrough in your investment.
GOLD Made Inverted H&S Pattern , Long Scalping Ready !Here is my 15 mins chart on gold and we have a reversal pattern , ( inverted head & shoulders ) and we have a clear closure above our neckline so we can buy it to get the target and then wait for the news tonight and then decide the new direction after news effect .

XAUUSD:Go long
As can be seen from the chart, the decline of gold actually did not fall below 3380 each time, the actual close longer lower shadow, and from yesterday's trend can be seen 3400 is a certain pressure exists, so today to see whether this position can break through. After the break, we continue to look up, and then increase the trading range.
For now or first around the narrow range to trade.
Trading Strategy:
BUY@3378-84
TP:3395-3400
↓↓↓ More detailed strategies and trading will be notified here ↗↗↗
↓↓↓ Keep updated, come to "get" ↗↗↗

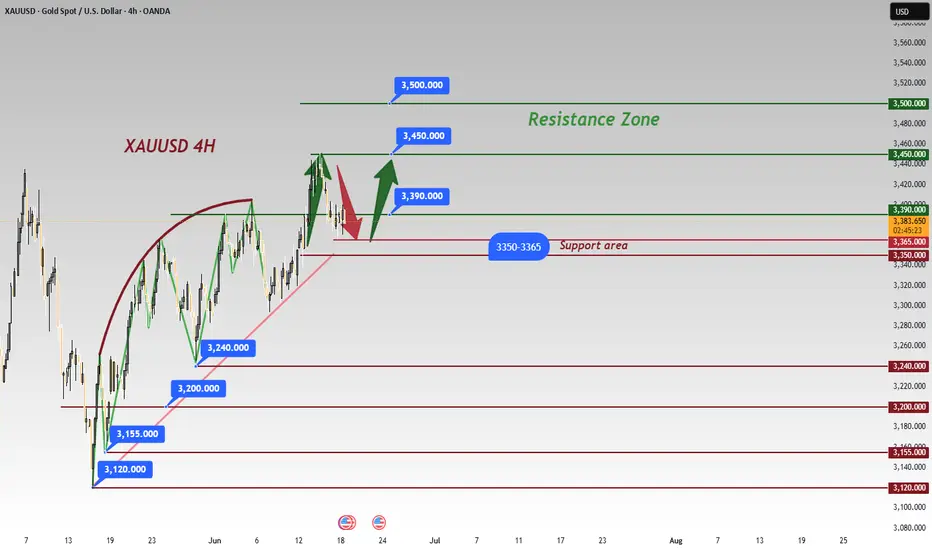
Strong support at 3365/3350In recent years, following the easing of high inflation pressures in the U.S., the Federal Reserve has maintained a high-interest-rate policy, a decision that has significantly impacted gold and U.S. dollar markets: high rates have boosted the U.S. dollar while suppressing gold demand 📉.
This week, gold prices defied market expectations: fueled by geopolitical conflicts, gold surged last Friday and opened higher on Monday, only to trend lower thereafter ⬇️. The hourly chart shows a series of lower lows, with 3,400 emerging as short-term resistance, while gold currently oscillates around 3,380 🔄. With key economic data pending release, gold may still rebound (the initial jobless claims data was advanced to Wednesday) ⏰.
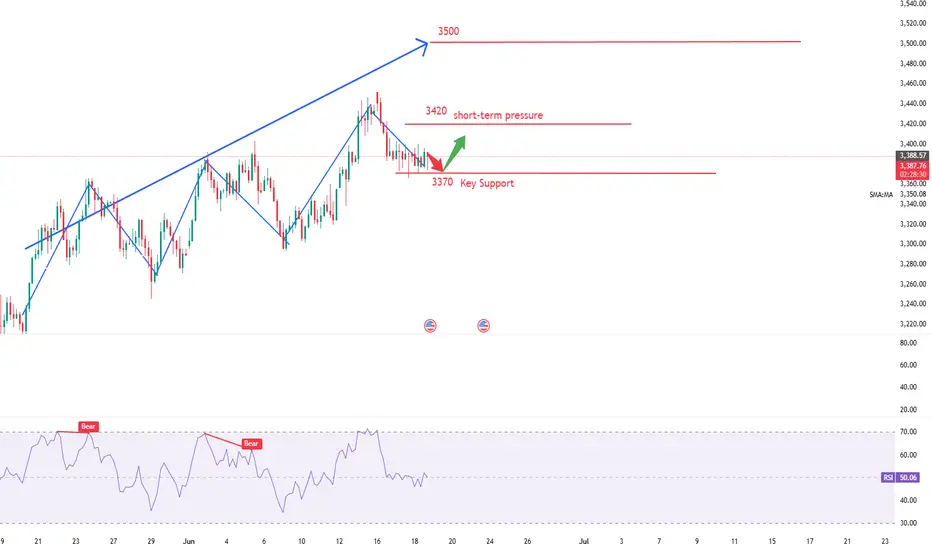
Technically, gold remains in a unilateral uptrend on the daily chart, with strong support at 3,365/3,350 from the 5-day and 10-day moving averages—though not yet in an extremely strong trend 📈. Key resistances lie at 3,430/3,450: a break above 3,450 could pave the way for a challenge to the previous high of 3,500 🏔️!
⚡️⚡️⚡️ XAUUSD ⚡️⚡️⚡️
🚀 Buy@ 3365 - 3375
🚀 TP 3395 - 3405
Accurate signals are updated every day 📈 If you encounter any problems during trading, these signals can serve as your reliable guide 🧭 Feel free to refer to them! I sincerely hope they'll be of great help to you 🌟 👇
gold on bullish reverse#XAUUSD buy below 3375-3377, but firstly we wait for 3375 to touch before buying.
Target 3406, stop loss at 3365
Below the 3365 holds bearish flag which will continue falling till 3349.

XAUUSD:A long trading strategy
Yesterday was affected by the easing signal gold high continued to correction, fell back to 3400 again, the trend exceeded personal expectations. Gold received another boost after the president's news, and rebounded slightly in the Asian session. In this eventful autumn, the market is subject to frequent news factors, the trend is slightly turbulent, to be ready to sweep back and forward.
Today's overall volatility is expected to have a contraction, individual expectations of the final close of the small negative line is more likely
Trading Strategy:
BUY@3380-85
TP:3404-3410
↓↓↓ More detailed strategies and trading will be notified here ↗↗↗
↓↓↓ Keep updated, come to "get" ↗↗↗
GOLD H1 Intraday Chart Update for 18 June 25Hello Traders, Welcome to the FOMC Day
as you can see that market is in tight range for now which is 3370-3400, we are still waiting for long above 3400 Psychological Level once market will clearly breaks 3400 level we consider long opportunities
if market breaks 3350 Psychological digit successfully then it will move towards 3325 first then focus will 3300 Major Support Level
All eyes on FOMC for the day
Disclaimer: Forex is Risky
Middle East Tensions Intertwined with Fed Rate Cut SpeculationThe Middle East situation remains tense ⚠️, and with rumors of a Fed rate cut emerging 👂, gold is likely to see significant volatility in the near term 📈📉. Due to the war, we still favor going long at lower levels 💹. During the current U.S. trading session, another pullback may occur—we need to wait for the correction before continuing to go long ⏳
⚡️⚡️⚡️ XAUUSD ⚡️⚡️⚡️
🚀 Buy@ 3365 - 3375
🚀 TP 3400 - 3410
Accurate signals are updated every day 📈 If you encounter any problems during trading, these signals can serve as your reliable guide 🧭 Feel free to refer to them! I sincerely hope they'll be of great help to you 🌟 👇

Accumulate around 3400, Keep interest rate today⭐️GOLDEN INFORMATION:
Gold prices slipped below the $3,400 threshold on Tuesday, weighed down by renewed strength in the US Dollar (USD), despite a worsening global risk sentiment. The resilience of the greenback limited gains in the safe-haven asset, though mounting tensions between Israel and Iran continue to offer underlying support. At the time of writing, XAU/USD is trading at $3,380, down 0.05%.
Although risk appetite remains subdued, gold has struggled to rally, as the US Dollar regains ground. The US Dollar Index (DXY), which measures the currency against a basket of six major peers, climbed 0.46% to 98.58.
Meanwhile, geopolitical tensions intensified after US President Donald Trump abruptly departed the G7 summit in Canada on Monday in response to unfolding events in the Middle East. In a stark warning posted to his social platform, he urged, “Everyone should immediately evacuate Tehran,” signaling a sharp escalation in the conflict that began last Friday.
⭐️Personal comments NOVA:
Gold price is moving in accumulation zone below 3400 - 3365. Break and return above 3400, continue to accumulate.
⭐️SET UP GOLD PRICE:
🔥SELL GOLD zone: 3437- 3439 SL 3444
TP1: $3425
TP2: $3410
TP3: $3395
🔥BUY GOLD zone: $3338-$3340 SL $3333
TP1: $3346
TP2: $3355
TP3: $3370
⭐️Technical analysis:
Based on technical indicators EMA 34, EMA89 and support resistance areas to set up a reasonable BUY order.
⭐️NOTE:
Note: Nova wishes traders to manage their capital well
- take the number of lots that match your capital
- Takeprofit equal to 4-6% of capital account
- Stoplose equal to 2-3% of capital account
XAUUSD!UP!As I expected, the market remains volatile. It needs an opportunity to continue to rise.
I will update this kind of information in the swing trading center. If you don't want to miss such precise trading opportunities, remember to stay tuned.
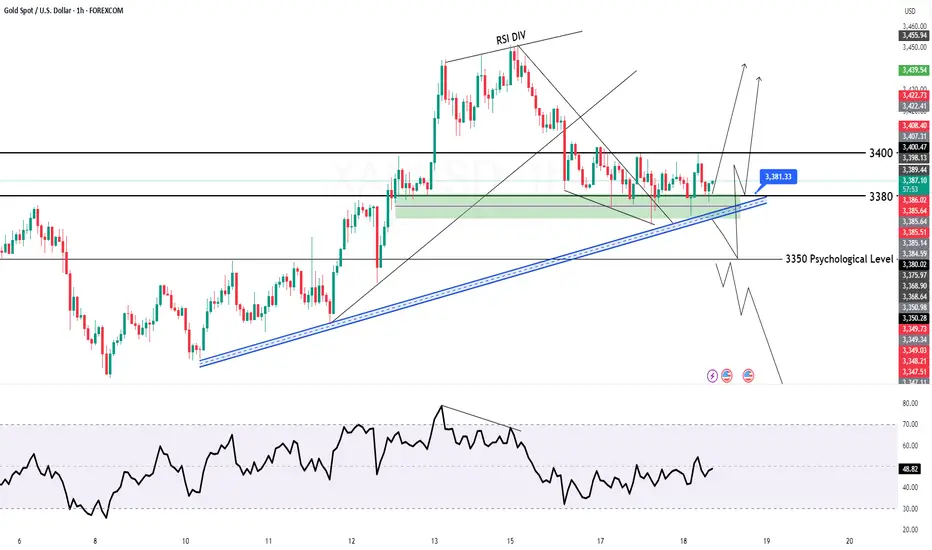
Key Event Today – FOMC Interest Rate DecisionAs risk-off sentiment cools, gold bulls failed to take control yesterday, resulting in a stalemate with the bears.
From the 4H chart perspective, bearish momentum currently appears stronger,
though bulls are not giving up easily.
Currently, price is rebounding off the 4H MA60 support,
with immediate resistance from the MA20 around 3405.
As time progresses, this resistance is likely to shift lower,
so for now, we’ll treat $3400 as the primary reference point.
For bulls to regain dominance,
they must hold steady above 3405,
and more importantly, protect the support at 3386–3378 during any pullback.
🔔 Key Event Today – FOMC Interest Rate Decision
Today’s trading will also be influenced by the Federal Reserve’s rate decision,
which, based on current expectations, is likely to weigh heavily on bullish sentiment.
📌 Strategy for Today:
Main Bias: Sell the rebound
Secondary Approach: Buy on pullbacks if strong support levels hold
Key support levels to monitor:
⚠️ 3382 zone (minor support)
🔻 Most critical: 4H MA60 around 3366
Stay cautious during the FOMC announcement window, and remember — in volatile markets, reacting with discipline is more important than predicting perfectly.
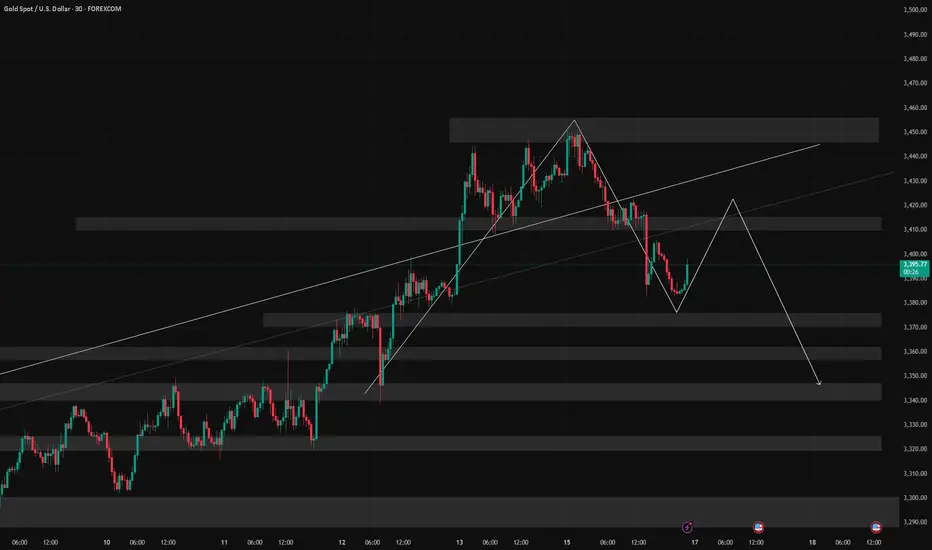
6/17 Gold Analysis and Trading SignalsGood morning!
Yesterday, gold opened with a gap-up and surged to around 3451, but failed to sustain above key resistance. After another failed attempt to break higher, prices gradually turned lower and finally broke below 3400, finding short-term support near 3382.
The primary driver of this decline was a waning of geopolitical risk sentiment, which had previously fueled the rally. Additionally, the market is now pricing in expectations that the Fed will keep rates unchanged, a factor that was likely preemptively reflected in price.
🔍 Fundamental Focus:
Today’s U.S. session will feature a key news release, which may prove decisive for gold’s next directional move. With yesterday’s advance pullback, market dynamics are likely to be more volatile today. We recommend caution, especially ahead of the announcement.
📉 Technical View:
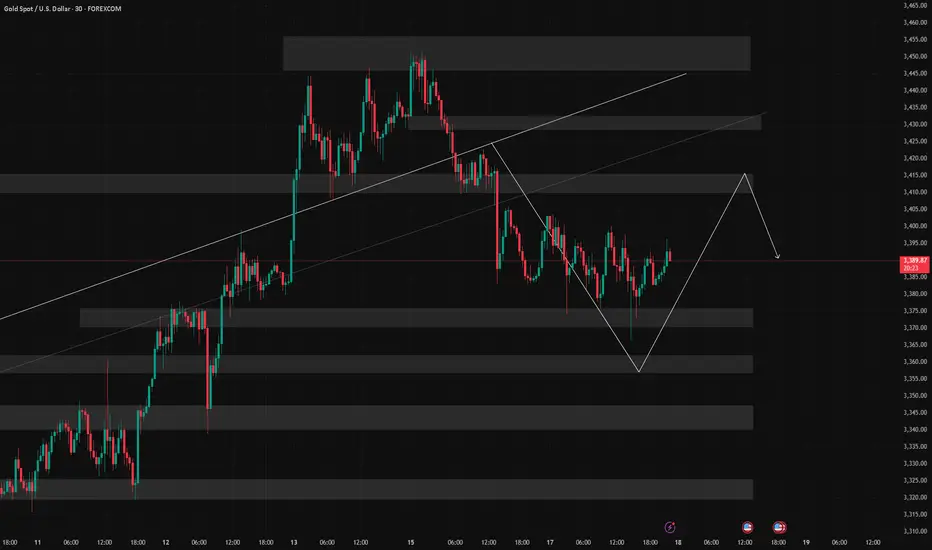
Gold is currently in a post-decline consolidation phase.
The main resistance lies between 3430–3450, while 3415 on the 30-minute chart also presents a short-term cap.
For those entering long positions, target zones should remain conservative, ideally around 3412–3418, and then be adjusted depending on volume momentum and breakout structure.
📊 Weekly Structure Outlook:
The weekly chart shows that gold is at a key trend inflection point.
If no additional bullish catalysts emerge, the market is likely to develop into a bearish consolidation, with the next major downside target around 3200.
📌 Trading Plan (For VIP):
✅ Sell Zone: 3436–3466
✅ Buy Zone: 3347–3323
✅ Flexible Trade Zones: 3428 / 3415 / 3403 / 3392 / 3378 / 3362 / 3354
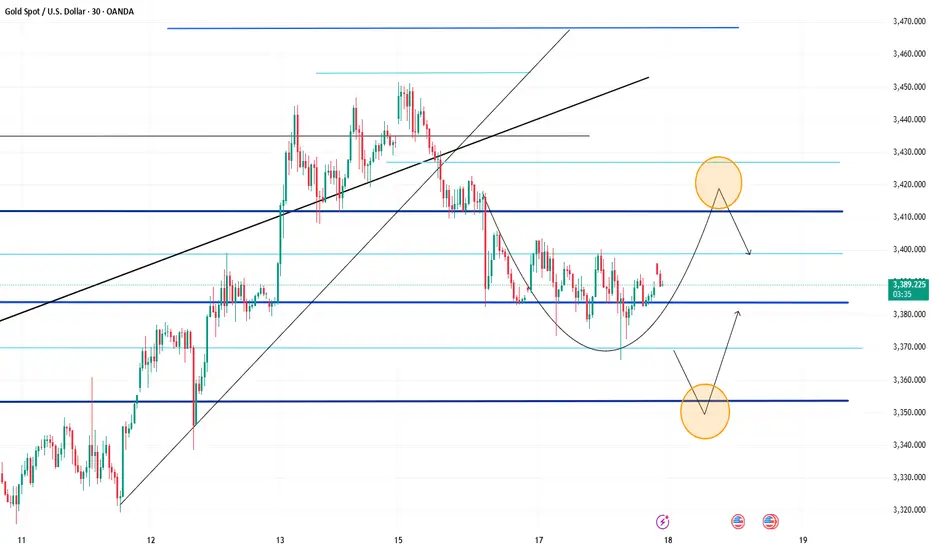
6/18 Gold Analysis and Trading SignalsGood morning, everyone!
Gold traded within a narrow range yesterday, and the buy signal shared during the session yielded profits. From a technical perspective, the market remains in a rebound phase, with key resistance around 3403. If the price breaks and holds above this level, there’s a good chance we’ll see a move toward the 3418–3428 zone today.
During the Asian and European sessions, the trading bias should remain on the buy side, while in the U.S. session, it may be more favorable to shift toward short setups, mainly due to expectations surrounding the upcoming Fed interest rate decision—an outlook we discussed yesterday.
Key intraday ranges to watch:
Asian–European session: 3362–3413
If price reaches the 3425–3435 zone before the U.S. session, short opportunities may emerge
As always, manage your positions carefully and adapt to key levels as price unfolds.
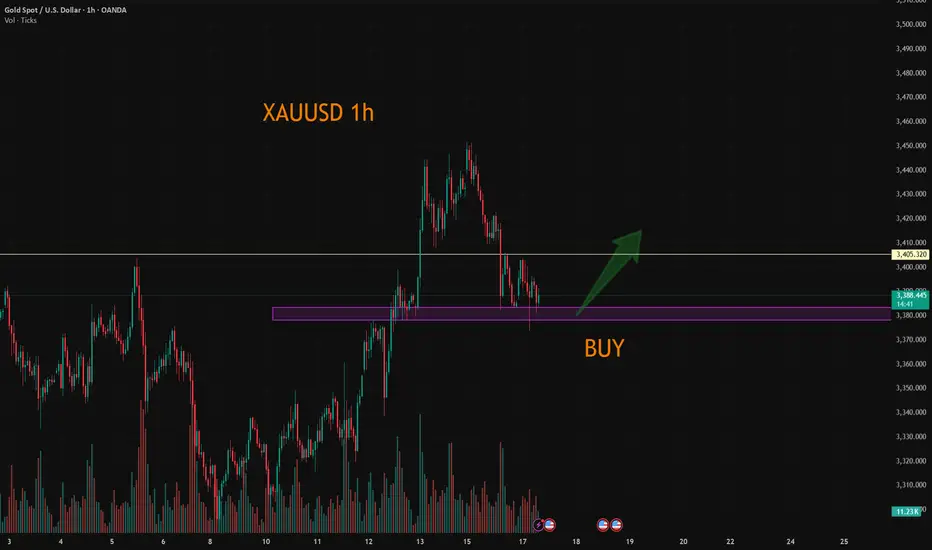
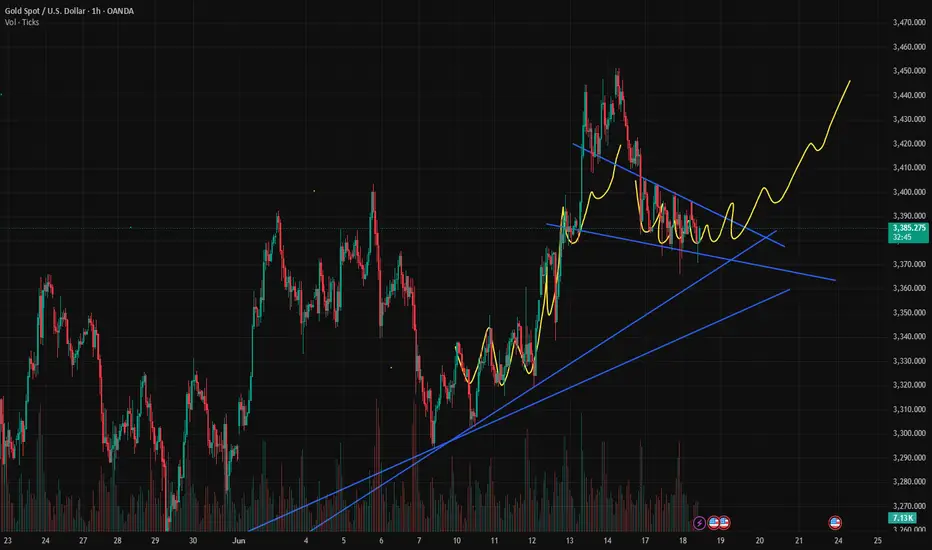
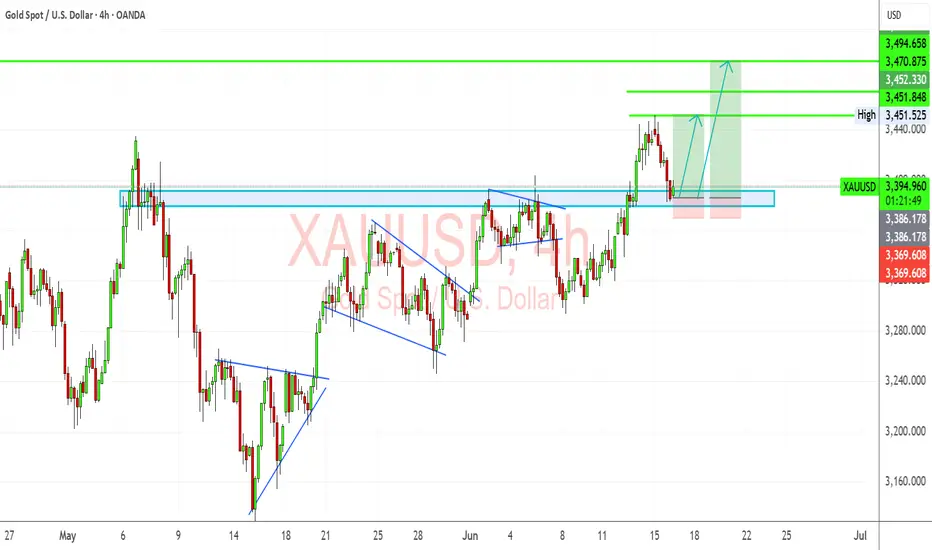
XAUUSD Long Setup – Retest of Broken Structure & Safe-Haven FlowGold has pulled back to retest a strong former resistance (now support) zone around $3,385–$3,390. This level aligns with a previous breakout and marks the neckline of an inverted head-and-shoulders pattern. The pair is now showing bullish structure with back-to-back continuation patterns (bull flags), suggesting further upside potential.
Given escalating geopolitical risk (Iran-Israel strikes, Trump-led evacuation urgency), slowing Fed cut expectations, and softening inflation-adjusted yields, gold remains in demand.
🔍 Technical Analysis:
Structure: Higher highs and higher lows maintained.
Support Zone: $3,385–$3,390 (retest zone) – bulls stepping back in.
Targets:
TP1: $3,451
TP2: $3,470
TP3: $3,495 (new local high)
Stop Loss: Below $3,369 (recent low)
Pattern Context: Bull flags continue to form and break bullish – reinforcing trend.
🧠 Fundamental Context (June 17):
Bullish Drivers:
Middle East escalation → safe haven bid surging (Iran missile launches, Israeli retaliation, US political chaos).
Fed on pause → real yields are subdued, favoring non-yielding assets like gold.
Convexity & bond volatility rising → investors hedging with hard assets (confirmed via CME sentiment reports).
Risks:
Sudden peace deal or ceasefire.
Unexpected US CPI spike → reawakens rate hike fears.
📅 Key Events to Watch:
Fed speeches (confirmation of dovish tone)
Any ceasefire or major diplomatic development
Oil movement (energy risk spillovers)
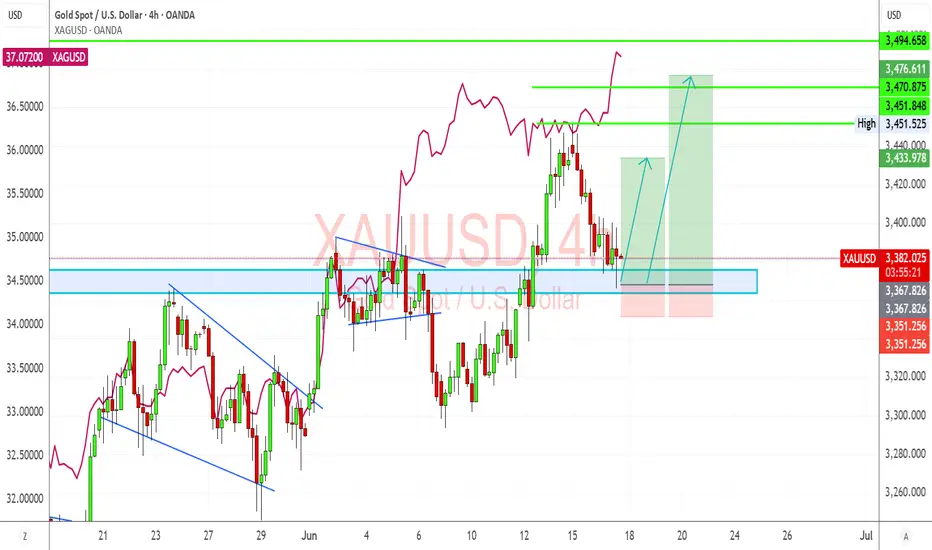
Gold (XAUUSD) – Demand Zone Holding, Silver Leading BreakoutGold has respected its demand zone near $3,367–$3,382 and is attempting to bounce higher. Importantly, Silver (XAGUSD in pink overlay) is leading the upside move, having broken out cleanly above $37.00 and still climbing. This confirms the bullish momentum across precious metals.
Geopolitical tensions, dovish Fed commentary, and risk-off market conditions continue to favor a move toward $3,451, $3,471, and possibly $3,495.
🔍 Technical Breakdown (4H)
Support Zone: $3,367–$3,382 (retest of broken resistance)
Bullish Structure: Rising lows, trendline holds, and higher timeframe support remains intact
Projected Targets:
🎯 TP1: $3,451 (recent high)
🎯 TP2: $3,471 (key extension)
🎯 TP3: $3,495 (top of range)
Stop Loss: Below $3,351 (invalidates demand structure)
🪙 Silver (XAGUSD) Overlay Insight:
Currently at $37.11+, showing leadership in the breakout.
Suggests gold will likely follow through — watch for Gold catching up.
🧠 Macro & Fundamental Context (June 17)
Bullish Drivers:
🔥 Ongoing Middle East war escalation (Iran-Israel, US troop buildup)
🏦 Dovish Fed tone, soft retail sales, rate cuts expected from Sept
🧾 Silver strength confirming demand across metals
Risks:
☮️ Unexpected ceasefire headlines could cause knee-jerk pullbacks
📈 Hot inflation data or hawkish Fed rhetoric could pressure upside
📅 Key Events to Watch:
FOMC members' speeches this week
US Core PCE inflation print
War headline velocity — particularly involving shipping or direct US-Iran confrontation
🧭 Strategy Suggestion:
Tactical Buy on Rejection Wick from current demand zone
Watch Silver momentum — if it breaks $37.50+, gold likely catches up fast
Consider scaling out around $3,451–$3,471 with final target near $3,495