Falling below 3380,testing 3365,the low position remains bullish📰 Impact of news:
1. Geopolitical tensions in the Middle East
2. Iran nuclear talks
3. Retail sales data
📈 Market analysis:
After rebounding to the 3400 line, gold encountered resistance and fell back to test the support level of 3380. Although it was very close to the point of 3405 we gave, I did not enter the trade because gold has been in the middle section in the short term and has not rebounded to the ideal point.
There are too many long orders at high levels in gold. The international situation is so tense that gold is still slowly declining, but the geopolitical situation is still continuing. In addition, the retail sales data is bullish. Then, as the trading strategy given at noon, it is expected to test the short-term support of 3365-3355 below. I will consider going long in this range
🏅 Trading strategies:
BUY 3365-3355
TP 3380-3390-3400
If you agree with this view, or have a better idea, please leave a message in the comment area. I look forward to hearing different voices.
TVC:GOLD FXOPEN:XAUUSD FOREXCOM:XAUUSD FX:XAUUSD OANDA:XAUUSD
Xauusdlong
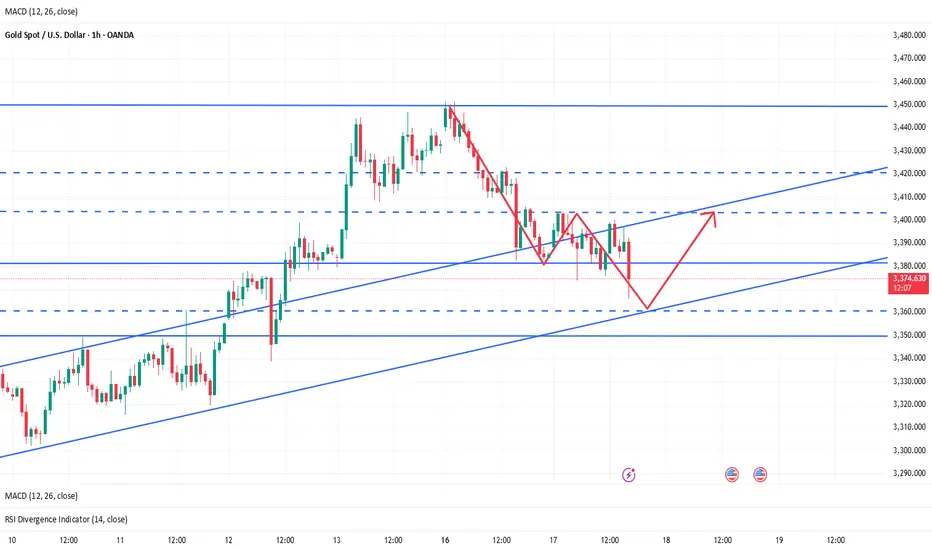
Gold price short term correction 3373Plan XAU day: 17 June 2025
Related Information: !!!
Gold price (XAU/USD) extends its intraday directionless price move and remains below the $3,400 mark through the first half of the European session on Tuesday. Traders now seem reluctant and opt to wait for more cues about the Federal Reserve's (Fed) rate cut path before placing fresh directional bets. Hence, the focus will remain glued to the outcome of a two-day FOMC meeting on Wednesday, which should provide a fresh impetus to the US Dollar (USD) and the non-yielding yellow metal.
Heading into the key central bank event risk, the growing acceptance that the Fed would lower borrowing costs further in 2025 keeps the USD close to a three-year low touched on Friday and acts as a tailwind for the Gold price. Apart from this, persistent trade-related uncertainties and rising geopolitical tensions in the Middle East assist the safe-haven precious metal to stall the previous day's retracement slide from a nearly two-month top. This, in turn, warrants some caution for the XAU/USD bears.
personal opinion:!!!
Selling pressure in the European session on Tuesday, pay attention to support zones: 3373, 3352
Important price zone to consider : !!!
Buy point: 3373 , 3352
Sustainable trading to beat the market
Continue the uptrend, gold price returns to 3444⭐️GOLDEN INFORMATION:
Gold prices (XAU/USD) slipped for the second consecutive session on Tuesday, retreating from an early uptick during the Asian session that briefly pushed prices above the $3,400 mark. A slight rebound in the US Dollar (USD) continues to weigh on the precious metal, acting as a key drag. However, the downside appears limited amid escalating geopolitical tensions in the Middle East and growing market expectations that the Federal Reserve (Fed) will initiate further rate cuts in 2025.
Meanwhile, the ongoing aerial conflict between Israel and Iran has entered its fifth day, heightening fears of a wider regional escalation. This persistent geopolitical uncertainty is keeping demand for safe-haven assets like gold supported. Investors are also exercising caution ahead of the Federal Open Market Committee’s (FOMC) two-day policy meeting, the outcome of which may shape the next directional move for non-yielding bullion.
⭐️Personal comments NOVA:
Gold price takes liquidity from lower supports: completed 3385, 3373. short term downtrend break. Gold price will soon return above 3400.
⭐️SET UP GOLD PRICE:
🔥SELL GOLD zone: 3443- 3445 SL 3450
TP1: $3435
TP2: $3422
TP3: $3407
🔥BUY GOLD zone: $3352-$3350 SL $3345
TP1: $3368
TP2: $3376
TP3: $3390
⭐️Technical analysis:
Based on technical indicators EMA 34, EMA89 and support resistance areas to set up a reasonable BUY order.
⭐️NOTE:
Note: Nova wishes traders to manage their capital well
- take the number of lots that match your capital
- Takeprofit equal to 4-6% of capital account
- Stoplose equal to 2-3% of capital account
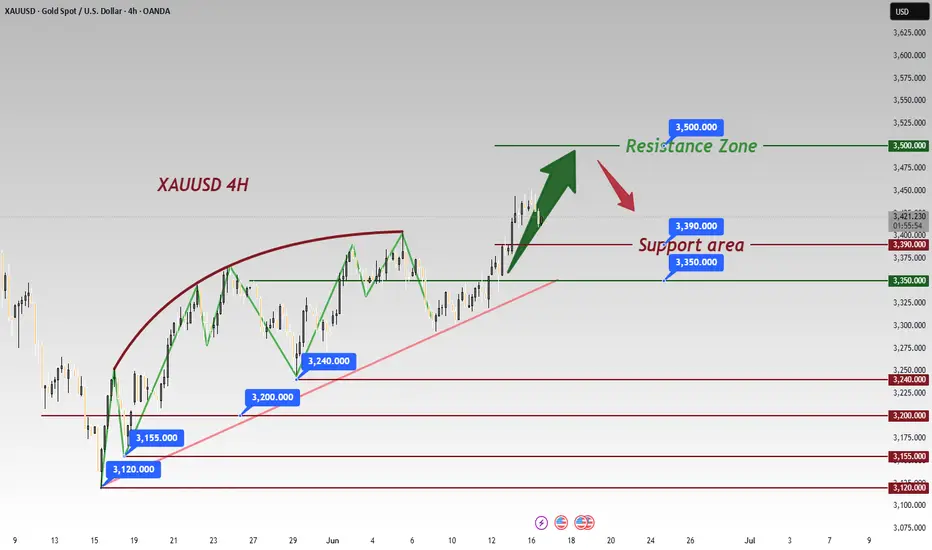
XAUUSD: Accumulation in process,Waiting for Bullish DistributionHello,
Today, we will analyse the key points of each significant move.
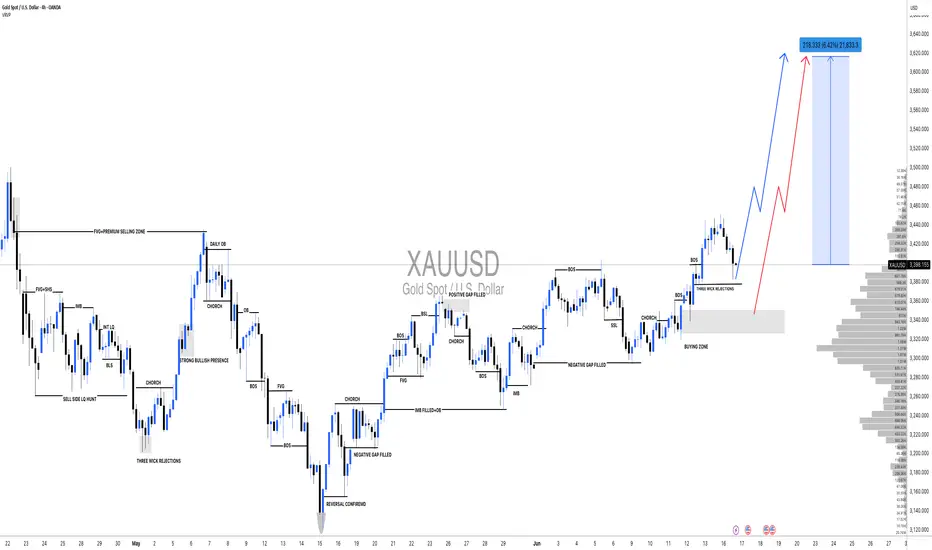
Following the price’s all-time high at $3500, it experienced a sharp decline and failed to maintain that level. A substantial 2400 pips would have resulted in significant losses for many accounts. Initially, it was perceived as a minor correction, with the expectation of further price appreciation. However, this assumption proved incorrect. After reaching an even higher peak, the price invariably undergoes a more substantial correction.
At 3260, substantial bullish volume surged into the market, necessitated by the presence of a fair value gap. Subsequently, the price experienced a decline, reflecting the prevailing bearish trend, which favoured the bears. However, at 3200, a pivotal level representing a discounted price point, bull volume surged. This powerful bullish impulse propelled the price to 3432, ultimately confirming the bullish trend. AB=CD there recurring pattern emerged weekly. When the price reached the 3432 level as a fair value gap, the CD pattern commenced.
AB=CDTheHeyIndeed, we have identified a recurring pattern. It appears to be an equal move in any direction, and it has manifested precisely as anticipated. We were aware that the price would reject at 3120, and it did so accordingly. Currently, the market is in our favour. Upon market opening, it exhibited a positive gap, propelling the price to 3450. However, it subsequently declined, reaching 3384.
Presently, we find ourselves in the accumulation phase, poised for distribution. This distribution is anticipated to be substantial, potentially leading to another record high, potentially reaching 3650.
Moving forward, the price could continue towards our target from its current position. Alternatively, there exists a possibility that it may drain the sell-side liquidity and reverse from 3360-3370.
Our take-profit levels are set at 3450, 3490, 3520, and finally, 3600. When entering the market, it is advisable to employ a short time frame. It is important to note that this analysis is merely our opinion, and market conditions may deviate from expectations.
We extend our best wishes for success and safe trading. If you wish to demonstrate your support, you may consider liking, commenting, or sharing this analysis with others.
Sincerely,
Team Setupsfx_
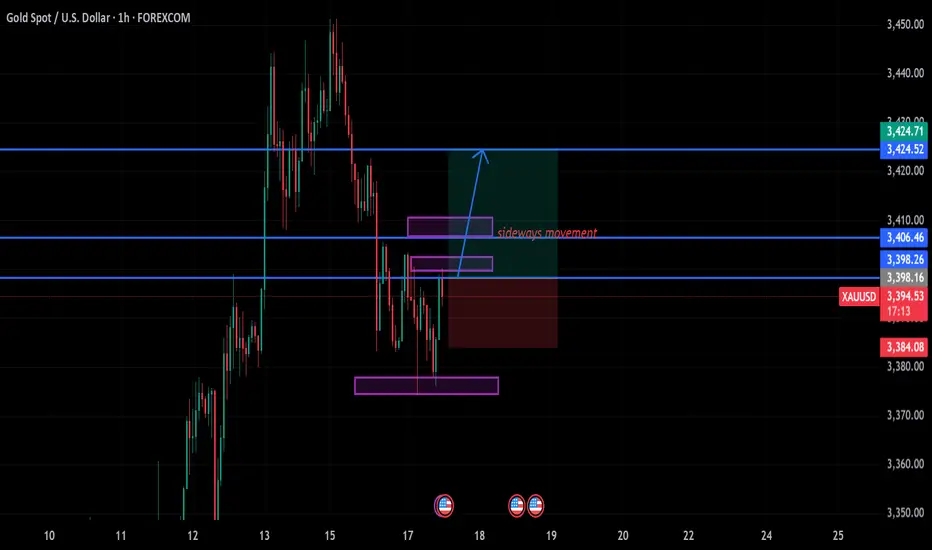
gold on buy#XAUUSD price holds on 3398 for buy continuation.
Above 3398 will take bullish which will breakout 3406, entry 3398, SL 3384, TP 3406-3425.
If price breakout 3406 and H1 closes above there then bullish will continue till 3425, but reverse and closure below 3402 down will drop the price more.
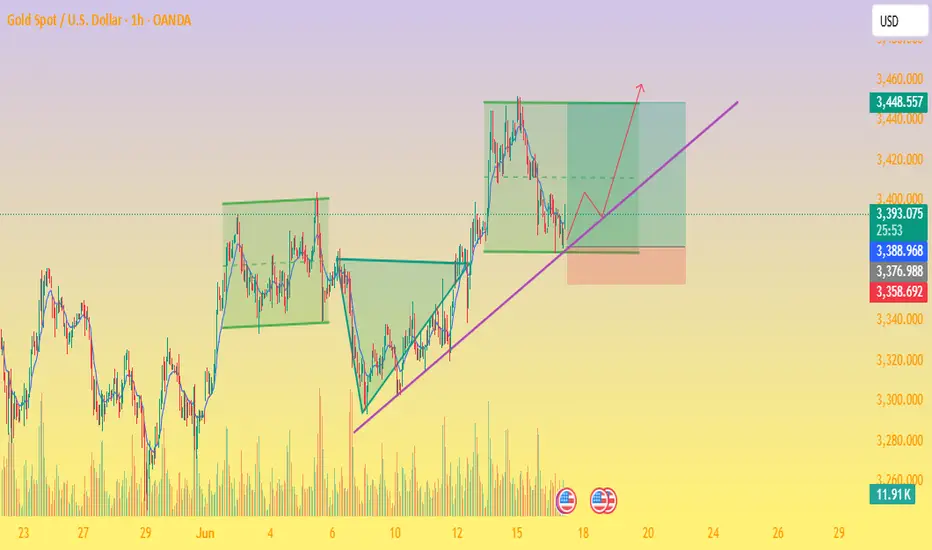
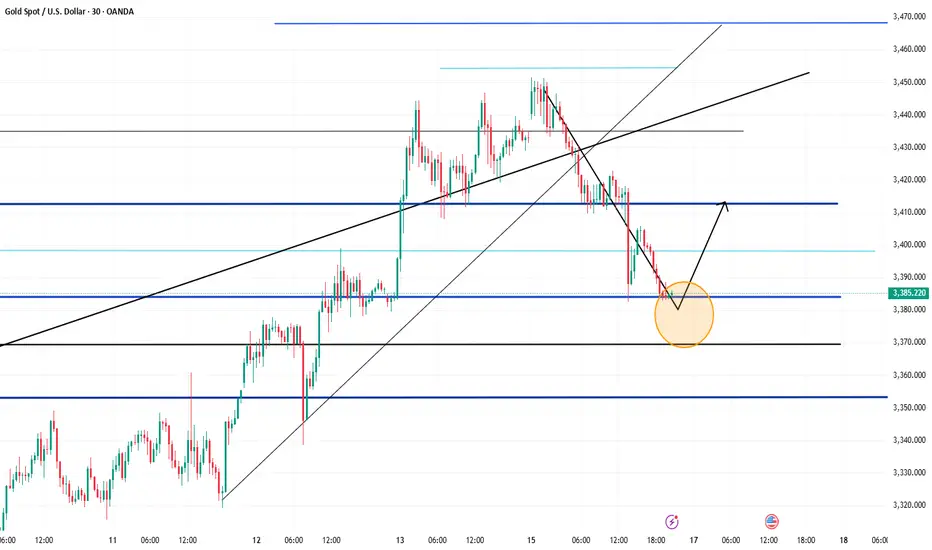
Gold on the Rise! – Bullish Setup in Focus The chart shows a repeating consolidation‑then‑breakout pattern, with Gold forming ascending swing structures, consolidating in rectangles (green), then riding higher along a rising trendline (purple). Price has just bounced off that trendline again, signaling a possible new leg up—potentially targeting the upper range near $3,448–3,450. A clear breakout above that level could open the door toward $3,500+.
📍 Trading Plan
🎯 Entry
Long on breakout above recent consolidation highs (~$3,440–3,448).
Alternatively, buy the dip near the purple trendline (~$3,385–3,390), with confirmation (hammer candle, bounce).
🛑 Stop‑Loss
For breakout: just below the top of the rectangle consolidation (~$3,389).
For trendline entry: slightly below recent swing low (~$3,358–3,360).
🎯 Profit Targets
Primary: upper rectangle level (~$3,448–3,450).
Extension: historic all‑time high region (~$3,500) → next major zone.
🎥 Path
Potential minor pullback toward trendline.
Bounce establishes support.
Surge toward top of range.
Breakout with trend continuation to new highs.
📊 Trade Risk & Reward
Target ~60–100 pts above entry, stop ~50 pts below → ideal Risk:Reward ≥ 1:1.2.
📌 Key Levels to Monitor
Level Role
$3,360 Swift dip support (green base line)
$3,390–3,400 Trendline confluence zone
$3,440–3,450 Breakout area & top of rectangle
$3,500 Next major resistance/all‑time high
🧭 Market Context & Drivers
Broad uptrend remains intact amid geopolitical tensions, especially the Israel–Iran situation, which continues to support safe-haven flows
Markets are positioning ahead of Fed’s June 18 decision; dovish signals could fuel continuation toward new highs (~$3,500+)
.
Technical structure reflects bullish momentum—ascending wedge patterns with shallow dips and strong trendline bounces
.
✅ Summary
Bias: Bullish – uptrend intact.
Strategy: Go long on dip near trendline or on breakout above $3,445.
Stop‑Loss: Just below last swing low ($3,360).
Targets:
Near-term: $3,448–3,450
Medium-term: $3,500+
XAUUSD: The beginning of range trading.Last week, I perfectly predicted the sharp rise in the market. At the beginning of this week, XAUUSD reached a high of 3451, which is the front pressure position. Due to the cooling of risk aversion in the international market, the New York market fell back to 3373 on Monday.
XAUUSD did experience a typical "news-driven callback", and the analysis of technical and fundamental aspects is very critical. The following is a professional analysis and operation suggestions for the current market:
Key points and technical structure
1. Pressure level: 3450 area
- The previous high pressure is effective. This is the resonance resistance area of the upper track of the daily level channel + Fibonacci 61.8% retracement level, and the demand for long profit-taking is concentrated.
2. Support level: 3370-3380 area
- Currently falling back to 3373, here is:
- 50-day moving average dynamic support
- 4-hour chart previous low level support platform
- Fibonacci 38.2% retracement level
- If the daily closing is above 3380, the technical structure is still a healthy correction.
News-driven logic
- Negative factors:
Geopolitical situation and peace talks ➜ Risk aversion cools down ➜ Gold's attractiveness as a safe-haven asset decreases.
- Potential risks:
The progress of peace talks may be repeated (such as the situation between Israel and Hamas and Russia and Ukraine). If the negotiations fail, safe-haven buying will return quickly. Need to keep an eye on news sources.
Key signals for long-short game
Long signal: long lower shadow candlestick appears in 3370 area, US dollar index (DXY) falls below 105.0
Short signal: rebound fails to break through 3400 integer mark, US bond yield rises above 4.3%
Trading strategy suggestion
- *Long order opportunity*: 3370-3380 light position to try long, stop loss 3355 (below the previous low), target 3400/3420.
- *Short order opportunity*: 3415-3425 to arrange short orders in batches, stop loss 3440, target 3390.
2: Break down
- Trigger condition: daily closing price <3365
The callback is upgraded to a deep correction
- Target: 3340→ 3300 (psychological barrier + trend line support)
- Operation: Chasing short needs to wait for a rebound to around 3400, stop loss 3420.
3: Restart the rise (probability 10%)
- Trigger condition: Break through 3440 and stand firm for 1 hour
- Possible driving force: Geopolitical conflict escalates/Fed rate cut expectations rise
- Target: 3480 (historical high psychological resistance) → 3500
- Operation: After breaking through 3440, step back to 3425 to chase longs, stop loss 3405.
Key event risks this week
1. Wednesday: US May CPI data (core CPI expected to be 3.5%)
- If data > expectations: expectations of rate hikes rise → bearish for gold
- If data < expectations: expectations of rate cuts come earlier → bullish for gold
2. Thursday: Fed interest rate decision + Powell press conference
- Pay attention to the dot plot's hints on the number of rate cuts in 2024 (current market pricing is about 2 times)
3. Geopolitical headlines: progress in the Iran nuclear agreement, black swan risks in the French election
Position management principles
1. Total risk exposure ≤ 5% of account net value
2. Reduce positions by 50% 3 hours before key events (avoid instantaneous fluctuations in CPI/FOMC)
3. Breakout strategy stop loss setting: 15 points outside the previous high/low to prevent burrs
Conclusion: The effectiveness of the current 3373 support needs to be verified by Wednesday's CPI data. It is recommended that the London market operate in the 3370-3420 range and reduce positions before the US market to wait for data guidance. If you hold long positions, 3380 is the last line of defense; if you hold short positions, consider taking profits in batches above 3400. The medium-term bullish trend of gold has not been broken, but the risk aversion premium needs to be digested in the short term.
If you need a more detailed entry point analysis or position management to solve your long-term loss problem, please feel free to tell me your trading cycle and risk preference, and I will provide you with a customized strategy.
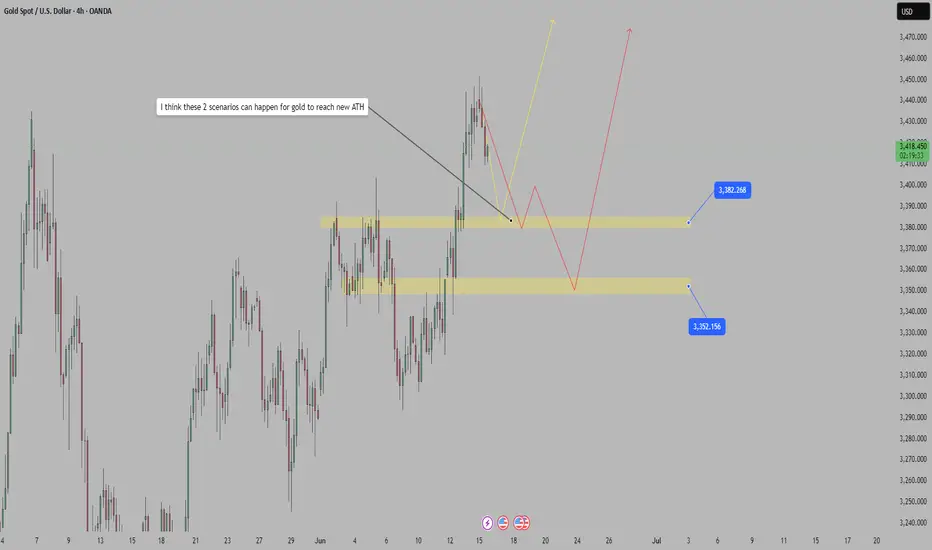
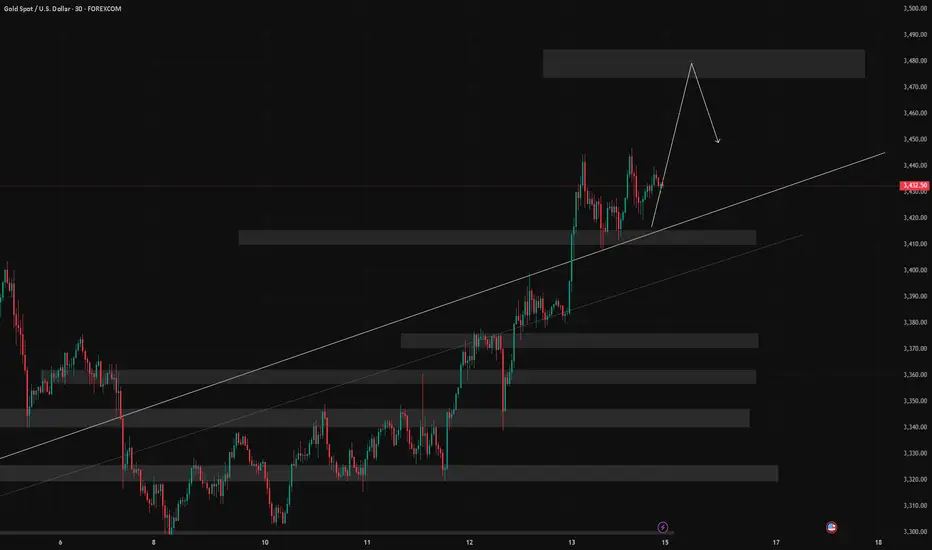
I think these 2 scenarios can happen for gold to reach new ATHGold supported by Israel-Iran conflict, US intervention in focus
Gold's sharp rise came late last week after Israel struck multiple targets in Iran, including Tehran's nuclear facilities.
The attack sparked fierce retaliation from Iran, which launched a barrage of missiles at key Israeli targets, including the financial capital Tel Aviv. Some of the Iranian missiles were also seen penetrating Israel's "Iron Dome" defense system.
What do you think?
Best regards, StarrOne !!!
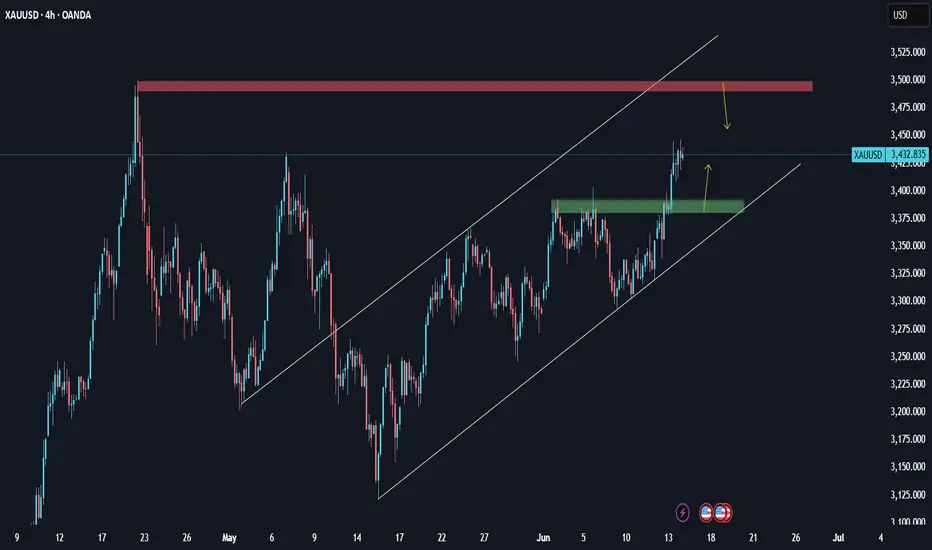
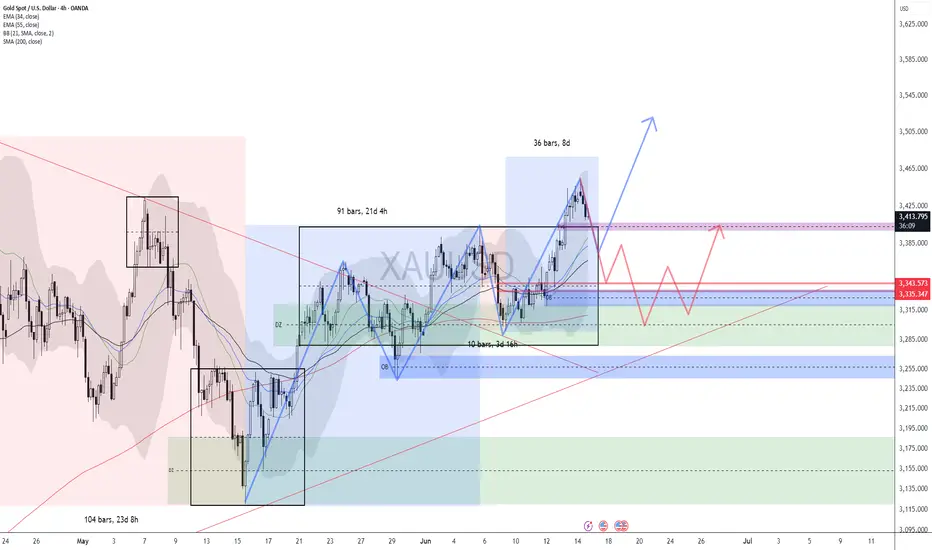
XAUUSD: Analysis H4 next weekThe continued tension in the Middle East (Israel–Iran) has led to a flight to safe havens, a key driver for gold.
Reduced pressure from the USD due to expectations that the Fed will slow down its rate cut (~September), coupled with inflationary pressures, could support gold prices
If tensions in the Middle East do not ease next week, gold's rally could extend and we could see 3500. But be careful, as if tensions ease and some good news from the USD comes, the rally could be halted.
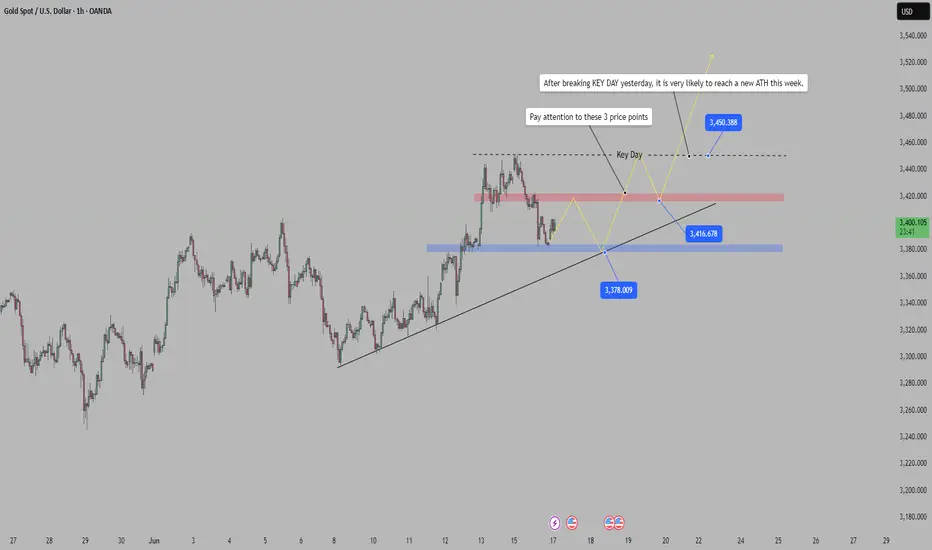
After breaking KEY DAY yesterday, it is very likely ATH in weekGold prices are being directly affected by the Israel-Iran tensions, the risk of trade conflicts due to the new US tariff policy, and concerns about slowing global economic growth. However, gold prices suddenly fell in the context of improving risk appetite of investors as they get used to the "new normal".
Daniel Pavilonis, senior commodities broker at RJO Futures, commented that if this rally starts to lose momentum, it could be a double top pattern for gold. Giving advice to investors, according to Mr. Pavilonis, they should start considering reducing their gold position at this time if they missed the opportunity to take profits at $3,509. When gold is peaking, investors see other markets moving higher, such as silver, platinum and palladium.
Best regards, StarrOne !!!
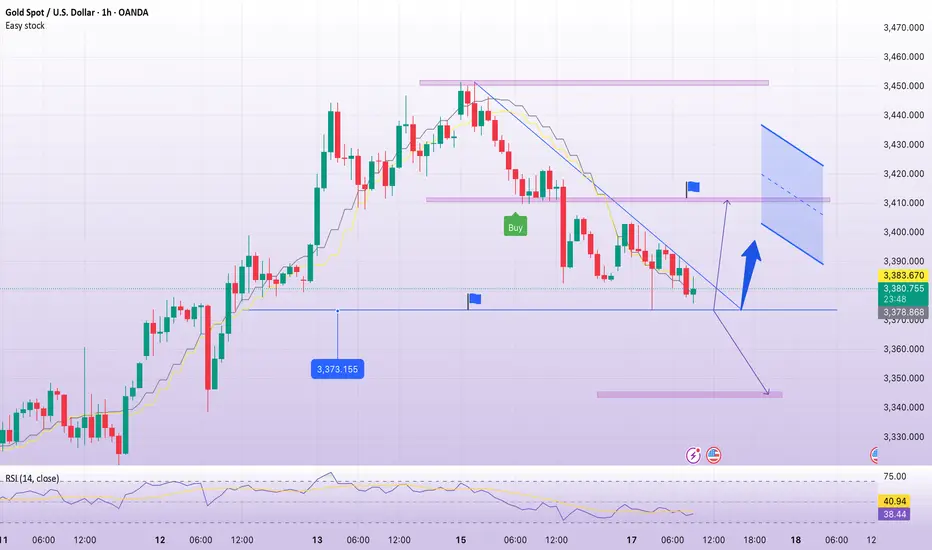
Gold is expected to hit 3410-3420 againBecause of the news that Iran hopes to ease the hostile relationship with Israel, gold fell sharply in the short term, then rebounded after touching 3383, and quickly recovered above 3390. From this point of view, the buying support below is strong, and the market sentiment is still high, which limits the downside of gold, and the support of 3390-3380 area is still valid.
Although the bullish momentum of gold has weakened relatively due to the retracement in the short term, as long as gold remains above 3380, it still maintains a strong upward structure; and the retracement only exacerbates the short-term shock trend. Gold is still likely to maintain a shock upward structure and try to touch the 3410-3420 area again. Once gold breaks through 3420 strongly, it is expected to hit the area near 3450 again.
So for short-term trading, I still hold a long position in gold, and there is still a certain profit now. I have to say that if gold can reach the 3410-3420 area as expected, our profits will increase significantly!

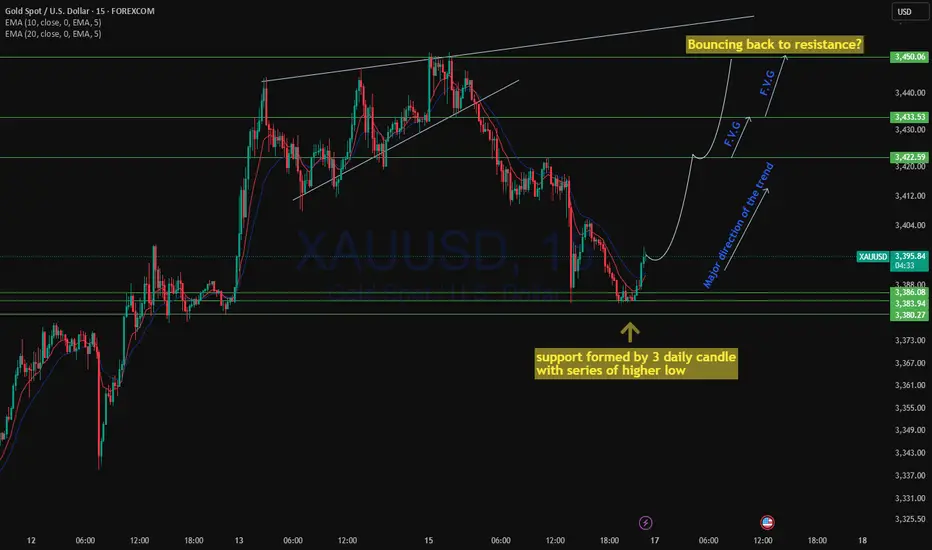
XAUUSD Bouncing back to 3450?3380.27, 3383.94 and 3386.08 three daily consecutively candlestick patter with continuted series of higher low formed the daily support. Previous daily candle just closed at support with an ATR of 1.1ATR, which is quite large in the opposite direction of the major trend while the price is trading above 10ema in the daily.
In 4h there is also 3 ATR ( overall) bearish move is spotted giving a high probability for this market to bounce back to the daily resistance to the major direction of the trend.
We have a buy position at this level and will keep you posted for more updates!
Fed Rate Decision May Trigger a Decline in Gold PricesDespite heightened tensions in the Middle East providing safe-haven support, gold failed to break through the 3450–3455 resistance zone today and instead pulled back to the 3400–3386 support area.
This decline was mainly driven by two factors:
Iran expressed willingness to resume nuclear talks, easing geopolitical tensions and weakening safe-haven demand.
Growing expectations that the Fed will keep rates unchanged this week strengthened the DXY, reducing gold's appeal.
That said, inflation concerns persist, offering medium-term support to gold. On the technical front, the 3378–3340 consolidation zone may serve as secondary support, while stronger trend support lies in the 3310–3289 range—a level that may only be tested under extreme bearish conditions.
For now, the primary support to watch is 3386–3373, with short-term rebound resistance around 3400–3420.
Trading Suggestion:
Ahead of the Fed’s rate decision tomorrow, consider buying on dips, as today’s decline may lead to a technical rebound. Then reassess the market’s response to key support and resistance levels to determine further action.
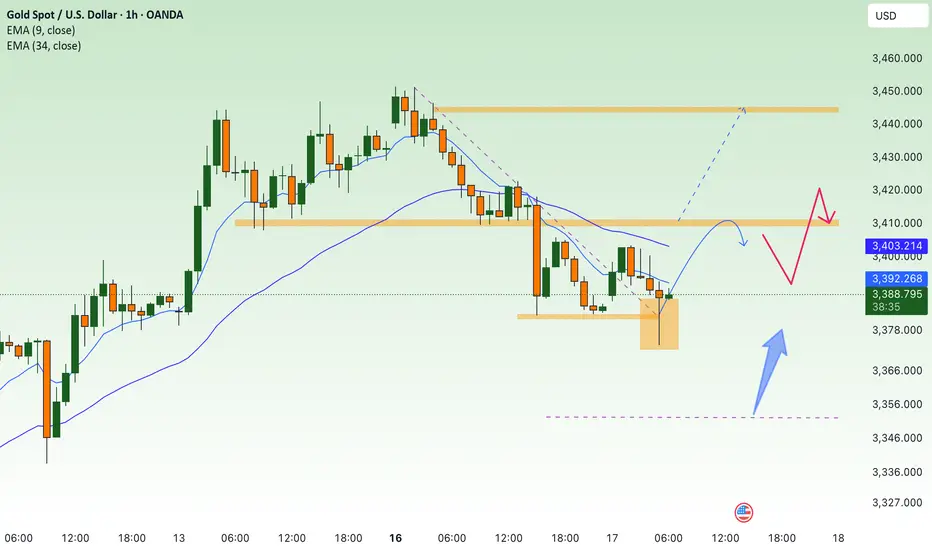
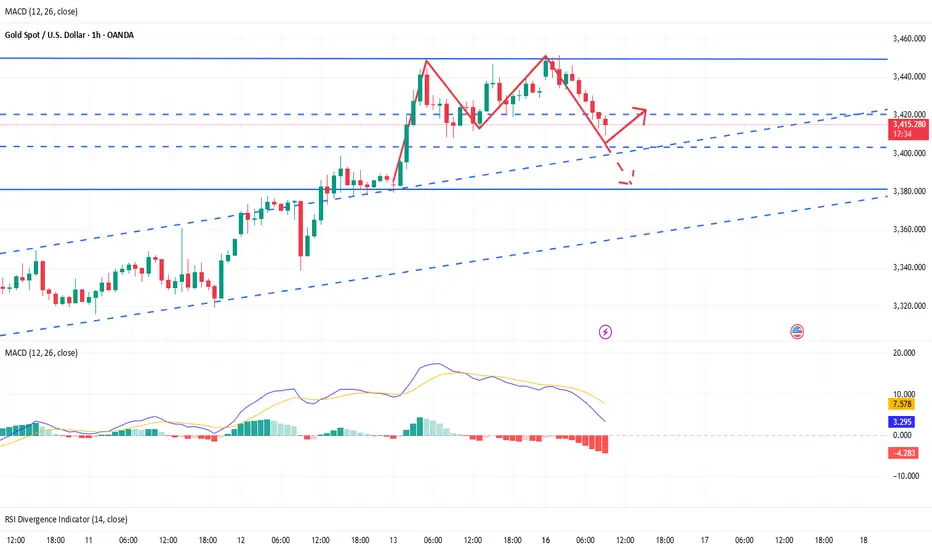
3400 3380 are the two points that determine the trend of gold📰 Impact of news:
1. Geopolitical risks
2. Expected Fed policy
📈 Market analysis:
This week, the Federal Reserve's policy meeting, retail sales data, initial jobless claims and geopolitical situation will be the core factors affecting global markets. In the short term, gold rebounded after hitting the 3383 line. This round of decline was relatively rapid. At the same time, there is a certain resistance at the 3405-3410 line above in the short term, which is also the main reason for our long orders to leave the market. In the short term, it is recommended to first look at the support situation at the 3380 line below, and then enter the long order after obtaining effective support above this position. On the contrary, if it falls below this short-term support, the gold price is expected to fall to the 3350 mark! For the evening layout, it is recommended to focus on the 3400 long-short watershed, pay attention to the 3410 line of resistance, and pay attention to the 3380 line of support below.
🏅 Trading strategies:
BUY 3390-3380
TP 3400-3410-3420
SELL 3400-3390
TP 3380-3360-3350
If you agree with this view, or have a better idea, please leave a message in the comment area. I look forward to hearing different voices.
TVC:GOLD FXOPEN:XAUUSD FOREXCOM:XAUUSD FX:XAUUSD OANDA:XAUUSD
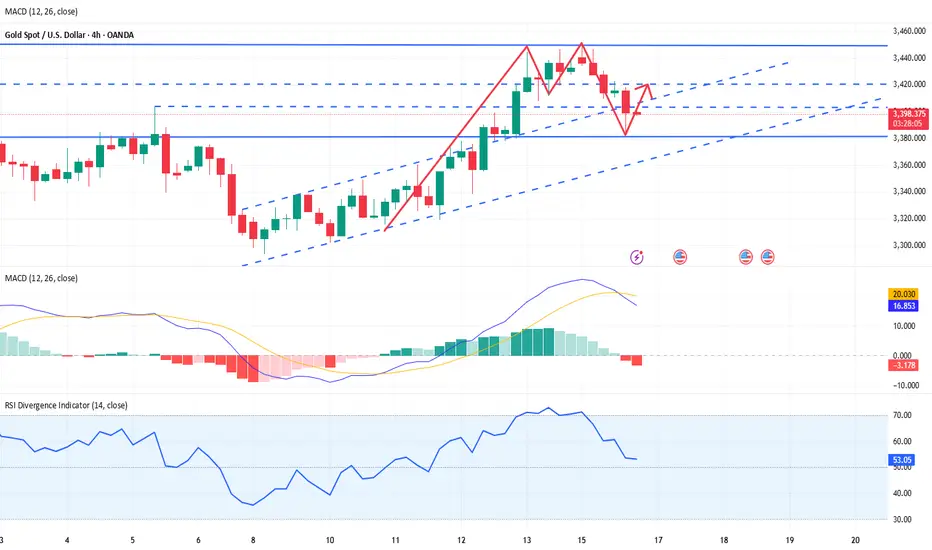
Gold Outlook: Bulls Defend Support Amid Rising Geopolitical RiskGold (XAU/USD) remains within a strong bullish structure on the 4-hour chart, trading inside an ascending channel. Recently, price attempted to break above the key resistance near $3,450 but failed, leading to a minor pullback toward the mid-channel area around $3,428–$3,430, where buyers are currently defending support. The key support remains at $3,394–$3,400, which also coincides with the ascending channel’s lower boundary.
As long as price holds above this level, the bullish trend remains intact, and there is potential for a breakout above the $3,450 resistance zone. If a breakout occurs and price closes above $3,450 on the 4-hour chart, the next bullish targets would be around $3,475 and then $3,500–$3,510. On the downside, if price fails to hold $3,394, it may trigger a short-term bearish correction toward the next support zone around $3,380–$3,370.
Overall, gold is currently in a consolidation phase inside the $3,394–$3,450 range, with a bullish bias above $3,394. A breakout above $3,450 may trigger strong upward momentum, while a break below $3,394 could open the door for a deeper correction.
🔑 Key Levels
Support: ~$3,394–$3,400 (channel floor) and intermediate support at $3,430–$3,440 .
Resistance: Immediate resistance zone is $3,445–$3,450, with broader upside potential toward $3,500+ if that break occurs.
Note
Please risk management in trading is a Key so use your money accordingly. If you like the idea then please like and boost. Thank you and Good Luck!
Iran seeks peace, Israel strikes – Gold dip, buy opportunity🌍 Iran's peace overtures sent gold prices plummeting to 3382, but Israel is unlikely to accept the olive branch lightly. With no clear signs of de-escalation in the Middle East situation, it's advisable to continue going long at lower levels 📉→📈
Israeli PM Benjamin Netanyahu vows military strikes will continue until Iran's nuclear program and ballistic missile capabilities are fully dismantled—showing no signs of halting ⚡. While he claims regime change is not the objective, he notes that given the weakness of Iran's leadership, political upheaval could emerge as a collateral outcome of the operations 🌪️
🌍 Currently, only Iran is seeking peace, but Israel won't simply end the war🌍 Currently, only Iran is seeking peace, but Israel won't simply end the war
⚡️⚡️⚡️ XAUUSD ⚡️⚡️⚡️
🚀 Buy@ 3385 - 3390
🚀 TP 3410 - 3420
Accurate signals are updated every day 📈 If you encounter any problems during trading, these signals can serve as your reliable guide 🧭 Feel free to refer to them! I sincerely hope they'll be of great help to you 🌟 👇
Buy on dips and seize rising opportunities📰 Impact of news:
1. Geopolitical risks
2. Expected Fed policy
📈 Market analysis:
The market opened higher in the morning and then continued to fall. From a medium-term perspective, the market is still in a medium-term bullish position. The price will only be under further pressure if it breaks below the weekly support. Observing from the daily level, the price broke through the daily resistance again last Wednesday and continued to soar after the breakthrough. The current price is testing the monthly high, and the subsequent gains and losses of the previous high are the key. Judging from the 1H chart, the short-term death cross continues to fall. At the same time, according to the 4H level, as time goes by, we need to pay attention to the support of 3413-3403. This support is the key watershed of the short-term trend. As long as it does not fall below this support, the bulls still have a chance.
🏅 Trading strategies:
BUY 3413-3403
TP 3430-3440
If you agree with this view, or have a better idea, please leave a message in the comment area. I look forward to hearing different voices.
OANDA:XAUUSD FX:XAUUSD FOREXCOM:XAUUSD FXOPEN:XAUUSD TVC:GOLD
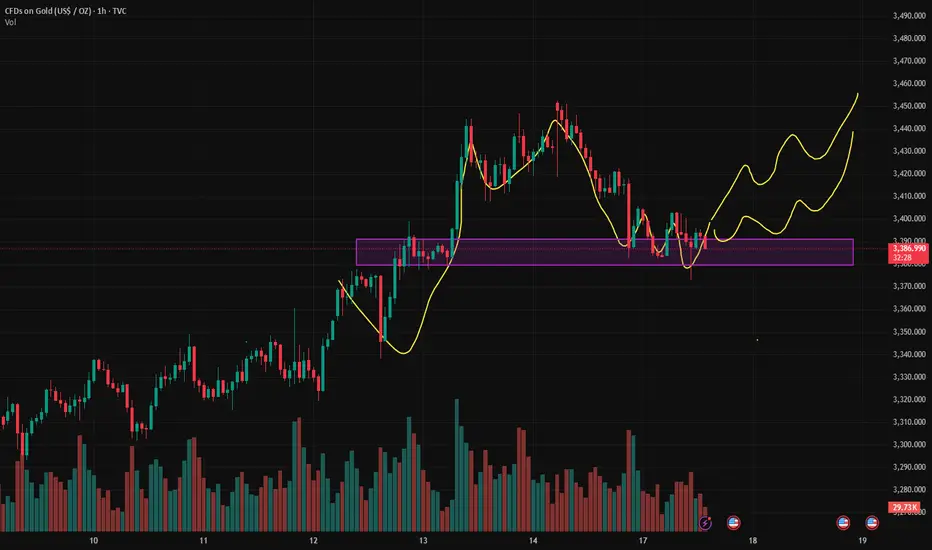
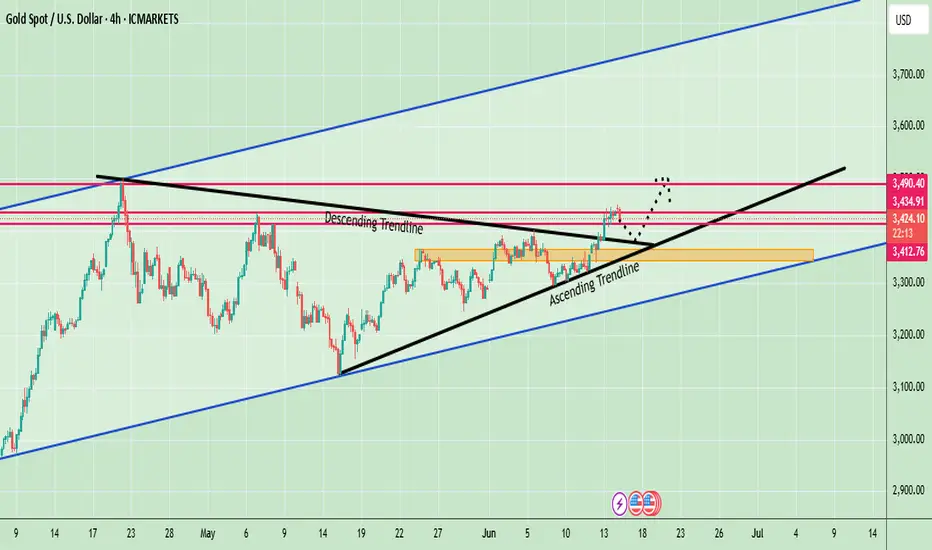
XAUUSD – Swing Trade and Trend FollowingXAUUSD – Swing Trade and Trend Following
Gold prices have been moving sideways, forming a consolidation range, and recently broke out to the upside last week.
Currently, the price is pulling back to retest the bullish Fair Value Gap (FVG). If it can bounce from the 3400 support level, the next target would be the Range Volatile Week High around 3500.
However, if the FVG fails to hold, the price may drop to the next support levels at 3350 and 3300.
These are critical supports that should not be broken, as they also align with the ascending trendline (Up Trend Line).
That said, this move is seen as a pullback for a potential continuation to the upside.
Strategy: Buy the dip
Wait for a reversal candlestick at the key support zones.
The bullish outlook would be invalidated if the price breaks below 3250.
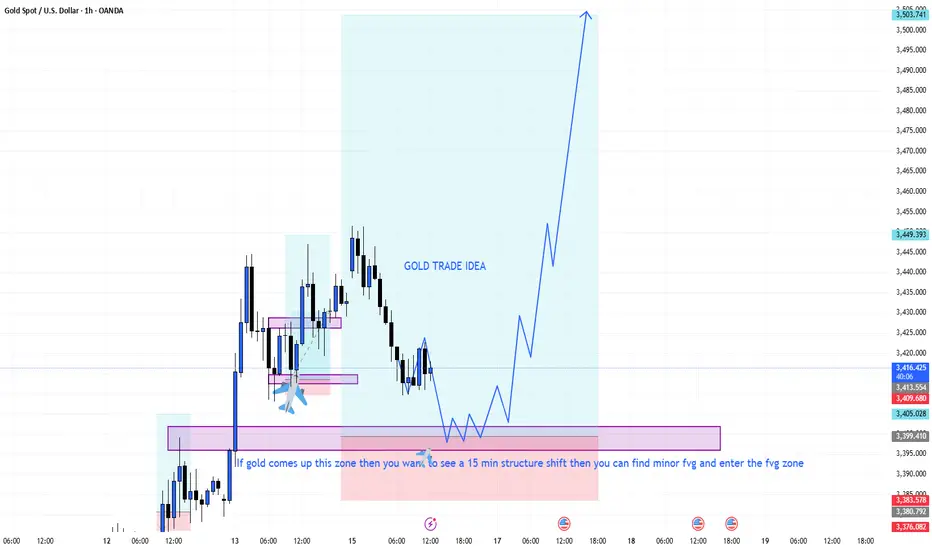
GOLD TRADE IDEA BULLISH MOMENTPrice is approaching a high-interest demand zone, marked by previous accumulation and clean inefficiency. My plan?
I’m not rushing in — I’m waiting for a 15-minute structure shift. Once that happens, I’ll look for a minor FVG to enter with precision.
📌 Key Criteria:
Price must react in the zone
Clear shift in structure (bullish intent)
Minor FVG forms = potential sniper entry
Targeting a high RR setup (6.5+)
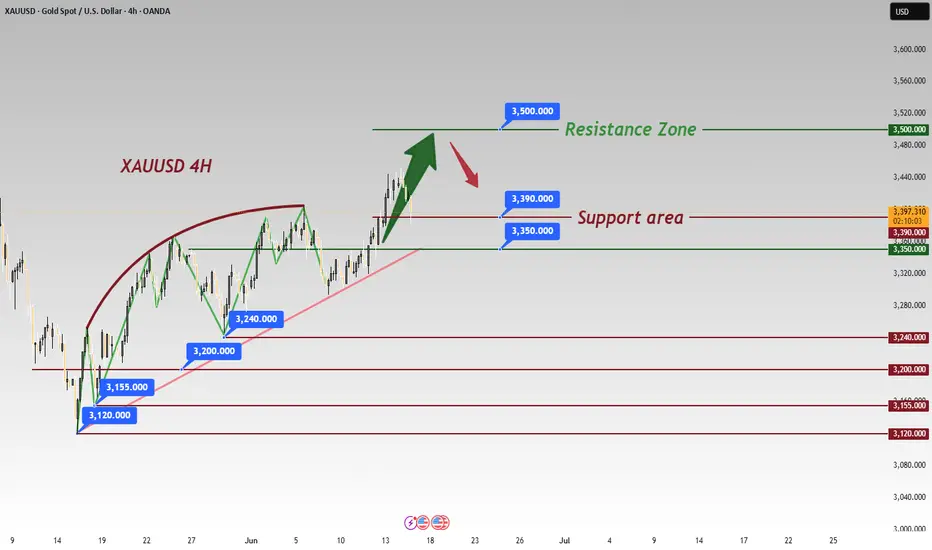
Safe-Haven Demand Drives Gold Higher – 3500 Within ReachWishing everyone a peaceful weekend—despite turbulent times.
This weekend has been anything but calm. The escalating conflict in the Middle East continues to widen, with rising casualties. As always, war is often a pursuit of power by those at the top, while the real cost is borne by innocent civilians. Though we are mere observers from afar, it’s hard not to feel the weight of the situation.
From a geopolitical perspective, this conflict coincides with U.S.–Iran nuclear negotiations. Could this be a calculated move by certain powers to shift the balance in their favor? While it remains speculative, what’s certain is that the intensifying conflict is already shaking global financial markets.
In such a climate, safe-haven assets are clearly benefiting. Gold’s upward momentum appears firmly established, and oil’s direction hinges on the situation at the Strait of Hormuz. If the strait is closed, a surge in USOIL prices toward $100 would no longer seem unlikely.
Under the influence of such impactful news, traditional technical analysis plays a lesser role. The market direction is largely determined by sentiment, and chart patterns now serve more as entry point references rather than decisive indicators.
My trading outlook for Monday:
If gold opens with a bullish gap and rallies toward the 3480–3500 zone, this area could present a short-term selling opportunity—ideally executed with a quick in-and-out strategy;
If a pullback follows, look to build intraday long positions: aggressive traders may consider entries near 3430, while conservative ones can wait for a potential retest of the 3418 level.
One crucial reminder: News-driven markets are highly uncertain. Eventually, every war comes to an end, and when the demand for safe havens fades, so too will prices. Stay rational in your decisions, and always manage your risk appropriately.
Middle East tensions rise, gold eyes 3500 this week
🌍 Over the weekend, tensions in the Middle East escalated sharply, with geopolitical conflicts further intensifying. Multiple forces were drawn into the fray, the scope of conflict expanded continuously, and related military actions triggered widespread international concern, significantly increasing regional uncertainty. This geopolitical instability has had a profound impact on global financial markets, causing a notable decline in investors' risk appetite. Against this backdrop, gold, as a traditional safe-haven asset, has once again become the top choice for investors. The market expects that as the Middle East situation continues to ferment in the coming week, risk-averse sentiment will remain high, and gold is expected to continue benefiting from this trend, with a high likelihood of breaking through the key $3,500 mark 📈.
Additionally, this week's Federal Reserve interest rate decision and Chairman Powell's speech will also be key factors influencing the trend of gold prices. Recent U.S. economic data has been mixed, and fluctuations in inflation figures as well as subtle changes in the job market have left the market full of uncertainty about the Fed's monetary policy direction. If the Fed signals a dovish stance in its interest rate decision, hinting at the possibility of future rate cuts, gold prices will undoubtedly gain further upward momentum. A lower interest rate environment reduces the opportunity cost of holding gold while weakening the appeal of the U.S. dollar, thus prompting more funds to flow into the gold market. Conversely, if the Fed adopts a hawkish stance, emphasizing the maintenance of current interest rates or even hinting at possible future rate hikes, this will exert certain pressure on gold prices ⚖️.
Equally noteworthy is that U.S. President Trump will visit Canada from June 15th to 17th to attend the G7 Leaders' Summit. Trump's words and deeds in international affairs often carry significant influence and uncertainty. At this summit, his speeches and interactions with other world leaders may trigger a reassessment of the global economic and trade situation by the market, thereby causing fluctuations in gold prices 📊. For example, if Trump makes tough statements on trade policies, geopolitics, etc., it may exacerbate market concerns and push gold prices higher; if he conveys more positive signals of cooperation, market risk appetite may recover, and gold prices may face certain correction pressure. Therefore, investors need to closely monitor every move of Trump at the summit to timely grasp investment opportunities and risks in the gold market 👀
⚡️⚡️⚡️ XAUUSD ⚡️⚡️⚡️
🚀 Buy@ 3410 - 3415
🚀 TP 3480 - 3490
Accurate signals are updated every day 📈 If you encounter any problems during trading, these signals can serve as your reliable guide 🧭 Feel free to refer to them! I sincerely hope they'll be of great help to you 🌟 👇
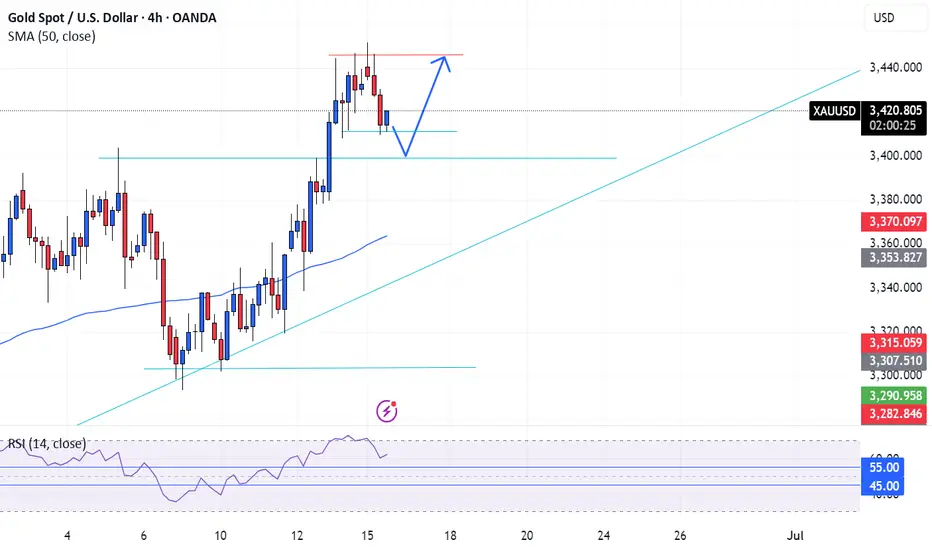
XAUUSD Long Position Gold is currently in a retracement with the potential for a further to the upside from the $3400 break-and-retest level. Last week we saw a massive rally to the upside for Gold after 2 days of indecision, during this rally, Gold broke above the $3400 resistance zone and now has the potential to use this level and platform to bounce further to the upside. On the 4 hour timeframe, Gold is comfortable trading above the 50 SMA and the $3400 potentially lays in the 45-55 zone of the RSI which is the sweet spot region indicating the need of a retracement and continuation of the the primary trend which is bullish. Will be looking to trade from $3400 with Stop loss below structure towards the $3445 resistance level.