xauusd setup"🌟 Welcome to Golden Candle! 🌟
We're a team of 📈 passionate traders 📉 who love sharing our 🔍 technical analysis insights 🔎 with the TradingView community. 🌎
Our goal is to provide 💡 valuable perspectives 💡 on market trends and patterns, but 🚫 please note that our analyses are not intended as buy or sell recommendations. 🚫
Instead, they reflect our own 💭 personal attitudes and thoughts. 💭
Follow along and 📚 learn 📚 from our analyses! 📊💡"
Xauusdlong

Gold market trend analysis and exclusive analysis.Analysis of the latest gold market trends:
Analysis of gold news: The U.S. Department of Labor released the much-anticipated June Consumer Price Index (CPI) data at 20:30 Beijing time. After the CPI data was released, the financial market responded quickly, showing investors' recalibration of inflation data and monetary policy expectations. The U.S. dollar index (DXY) fell 16 points in the short term after the data was released, reflecting the market's interpretation of the core CPI being slightly lower than expected, which was dovish. The gold market reacted particularly sensitively. The core CPI was lower than expected, pushing spot gold up by $6 in the short term, indicating a brief rebound in safe-haven demand. In the short term, the probability of the Federal Reserve keeping interest rates unchanged in July is close to 100%, but the mild performance of the core CPI reserves the possibility of a rate cut in September or earlier. The market needs to pay close attention to subsequent data, especially the July CPI and PCE price index, to determine whether inflation will continue to rise.
Gold technical analysis: This week's upward breakthrough of 3375 further bullish on the 3400 mark; the daily average line diverges upward to support bulls, and bullish on bullish gains. However, if you want to rise, you must exert your strength today, otherwise the bulls may end at any time! The current support level is near the daily MA5 and the middle track. The next step is still the focus. If you want to rise, you can't go down here. Going down means continuing to sweep back to 3320 and 3300. Today's European session also broke high without continuation, and the US session formed a retracement to test the MA5 support level. As long as the middle track is not lost, the short-term will continue to touch the high, so the operation is very clear. In the short term, the short-term will rely on the support of the middle track to see a rebound, and the upper resistance is 3665-3375. The daily Bollinger Bands continue to close. If the upper 3375 is not broken, do not chase the high position, and beware of high-level selling. On the whole, today's short-term operation of gold recommends that the callback is mainly long, and the rebound is supplemented. The upper short-term focus is on the 3350-3360 line resistance, and the lower short-term focus is on the 3320-3310 line support.
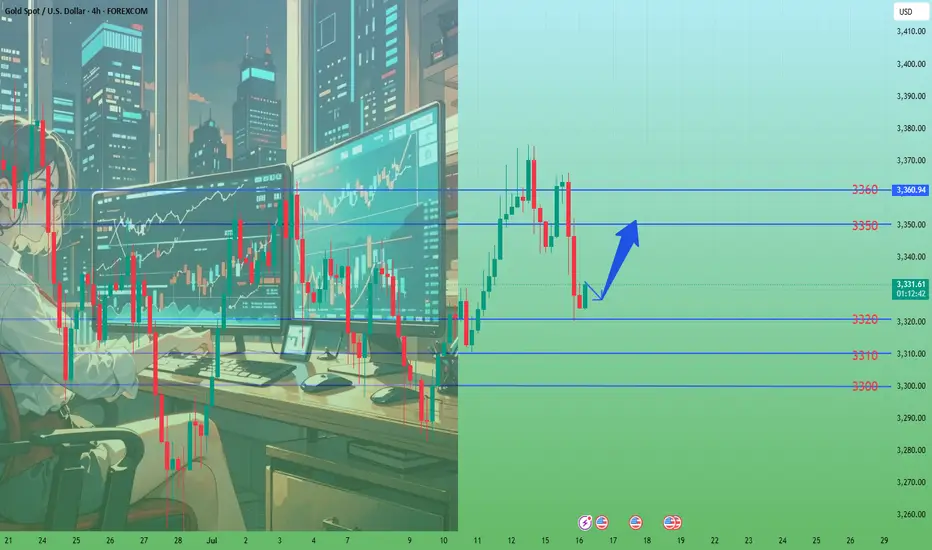
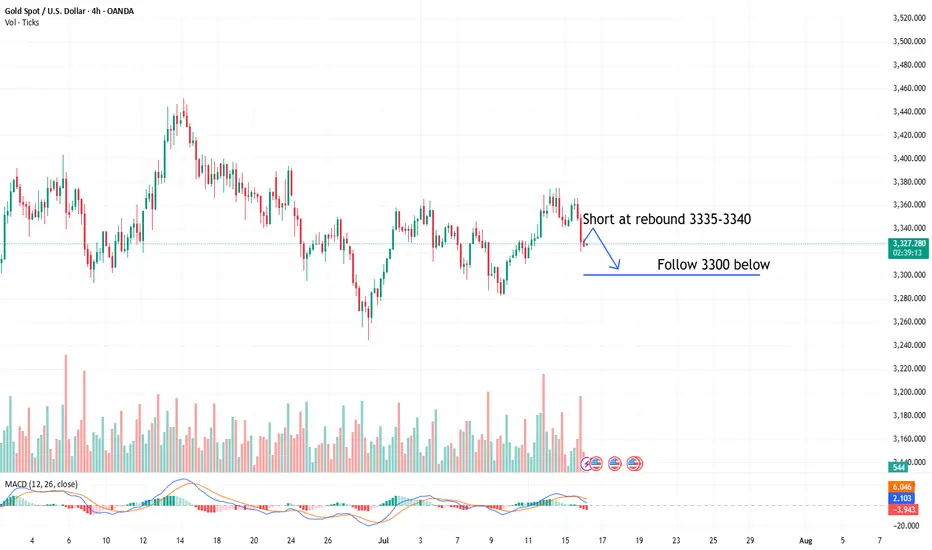
Diving through support, gold's downward space opens up!Gold reached a high of 3366. Although it broke through slightly, it failed to form an effective breakthrough and was only a false break. Subsequently, the bears led the market to continue to decline, breaking the key support of 3330 to 3320 at the end. The daily line closed with a medium-sized Yin line, directly breaking the short-term moving average support, ending the previous three-day positive trend. After the single Yin retreat, the upward trend failed to continue, and the risk of technical pattern reversal increased. The bears chose to break down, indicating that the market may fall further. The first test below is the support of the previous starting point of 3300. If this position is lost, the bearish target will point to the area near the previous low of 3270. The current market atmosphere is bearish, and the key pressure above has moved down to the 3340 line. It is expected that the rebound will be difficult to reach.
In terms of operation strategy: It is recommended that if gold rebounds first, it can be considered to continue to short near 3336-3338, stop loss 3347, and the target is 3310-3300 and below, and strictly stop loss to control risks. The overall bearish view is maintained.
GOLD...Hello friends
Due to the entry of buyers and the strong breakdown of the indicated resistance, the price is expected to move to the indicated targets.
*Trade safely with us*
XAUUSD Long OpportunityXAUUSD is currently on a retracement from the Asian high of the day at $3365. Looking for a Long opportunity from either the pivot level at $3351 (Break and Retest zone) or the Asian lows of the day at $3342.
Momentum is in favour of further bullish movements with these key level provide the best platform for the market to continue the bullish move. Price is trading above both the 21 and 50 SMA at these levels and is perfectly situated in the sweet spot region of the RSI (between 45-55) indicating that the retracement is nearing the end and we could see a pivot in the next few hours.
Looking for entry on the 5 minute chart and will be awaiting the NY market open for added liquidity into the market which could push it further into the bullish territory and beyond the high of $3365. Will need to be wary of the volatility at the open but will be looking at this bullish move continuing throughout the NY Session.
Will also be awaiting the release of CPI to confirm the strength in Gold and weakness in USD for added bullish confluence for this market.
Gold CPI shocks and fallsMarket news: Focus on the US CPI, PPI, retail data and the initial value of the University of Michigan Consumer Confidence Index; in addition, US President Trump plans to make a "major statement" on the Russian issue, the Federal Reserve will release the Beige Book on economic conditions, and the CFTC weekly position report is also worth noting.
Last weekend, Trump imposed tariffs on the EU and other countries and regions, and the EU has strongly counterattacked. The subsequent developments need to be tracked. The market has fluctuated violently and moved towards the 3400 mark. Trump has recently frequently announced tariff policies (such as 30% tariffs on the EU and Mexico, and threatened to impose 100% tariffs on Russia), exacerbating market uncertainty. Although theoretically beneficial to gold's safe-haven demand, the actual impact requires close observation of institutional capital flows.
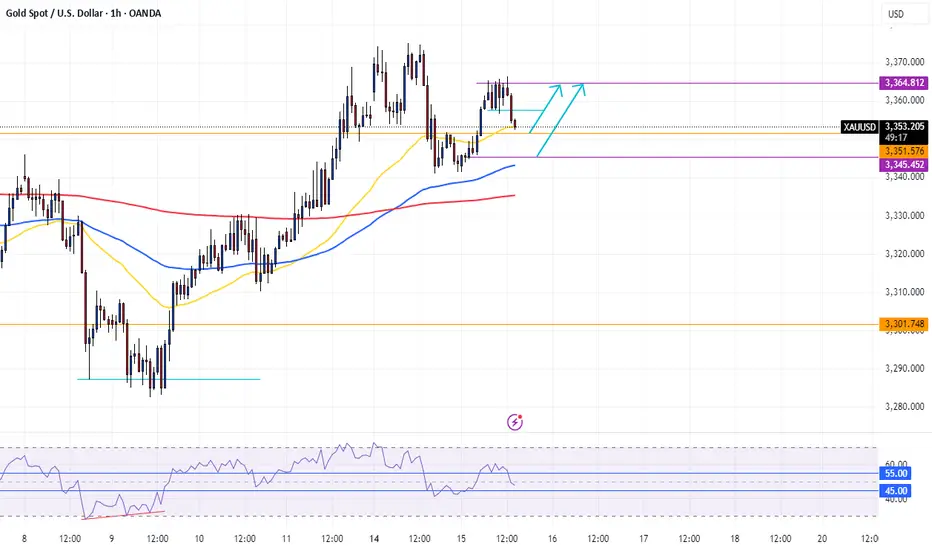
The 1-hour chart shows that gold prices fluctuated and consolidated at the bottom after a continuous correction yesterday, and continued to rebound today. The key pressure level is the top and bottom conversion level. The current gold rebound is only a secondary confirmation of the 30-minute top structure. After the high of 3365, the short-term has shown signs of pressure. In the volatile market, if the price starts to consolidate horizontally, it may indicate the end of this round of volatile upward trend, and it will turn into a downward phase later. Considering the market sensitivity before the release of CPI data, it is recommended to focus on the volatile decline trend. After today's rebound, it is necessary to focus on the 3363-3368 area as the short-selling range, and the long-short defense position is set at yesterday's intraday high of 3375. In terms of operation, it is recommended to maintain the rebound short-selling idea, and pay attention to the 3340-3335 range for support below.

Gold CPI shocks and fallsThe hourly chart shows that the gold price fluctuated and consolidated at the bottom after a continuous correction, continuing the rebound trend. The key pressure level is the top and bottom conversion position. The current gold rebound is only a secondary confirmation of the top structure at the 30-minute level. After reaching 3365, the short-term has shown signs of pressure. In the volatile market, if the price begins to consolidate horizontally, it may indicate the end of this round of volatile upward trend, and it will enter a downward phase later. Considering the market sensitivity before the release of CPI data, it is recommended to focus on the volatile decline trend. After today's rebound, it is necessary to focus on the 3363-3368 area as a short-selling range, and the long and short defense position is set at yesterday's intraday high of 3375. In terms of operation, it is recommended to maintain the idea of rebounding and shorting, and pay attention to the 3340-3335 range for support below.
Operation strategy:
1. It is recommended to short gold near the rebound of 3363-3368, with a stop loss at 3375 and a target of 3350-3340.

XAUUSD 4H – Break & Retest With Bullish Continuation | SMC🚨 Gold (XAUUSD) is setting up for a potential bullish move after a successful break and retest of a key resistance zone at 3346 – 3348, now turned into fresh support.
🔍 Technical Breakdown:
📌 Structure:
Gold previously formed a strong resistance near 3346, which aligned with multiple rejections in past sessions. After a liquidity sweep and break above this level, price retraced for a textbook break-and-retest setup.
📌 CHoCH & BOS (Break of Structure):
The market showed a bullish Change of Character followed by a clean Break of Structure to the upside, confirming bullish intent.
📌 Smart Money Perspective:
Institutional demand was respected at 3296–3305 zone.
Liquidity below this zone has been taken.
Current bullish candles are printing higher highs and higher lows.
📌 Confluences:
✅ Break & Retest of major structure
✅ Clean demand zone below
✅ Imbalance filled
✅ Bullish market structure
✅ SMC confirmation (CHoCH + BOS + Mitigation)
📈 Trade Idea (Long Setup):
💰 Buy Entry: 3359
🔻 Stop Loss: 3305 (below demand + structure)
🎯 Take Profit 1: 3400
🎯 Take Profit 2: 3440 – 3442 (major resistance)
🧮 Risk-to-Reward: 1:2+
This setup provides a strong bullish continuation opportunity targeting the upper resistance zone. Monitor candle confirmations and session volume for more precise entries.
📢 💬 Like this idea? Follow for more Smart Money trades on Gold, US30, NAS100, and V75!

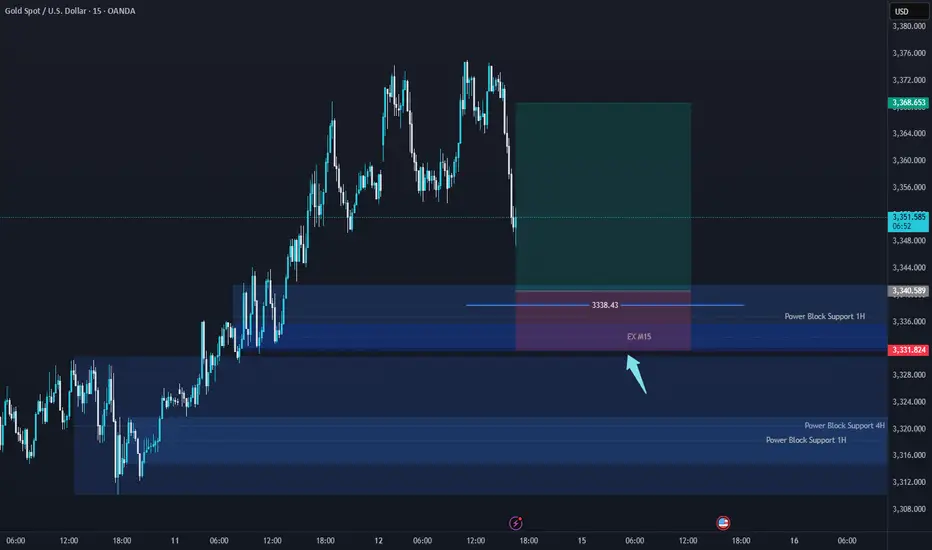
XAUUSD Trade Plan | 15 July 2025After observing the recent low breakdown and a clear liquidity grab, we saw a strong direction confirmation breakout. This suggests that the market is likely to continue its upward momentum.
🔄 Breakdown/Seller Trap triggered the reversal
🔹 Last Important Low respected
📈 Breakout confirms bullish direction
✅ Plan:
I’ll be watching for a pullback into the grey demand zone (highlighted area) for a potential long entry.
🕵️♂️ No FOMO — I’ll only enter after price shows clear bullish behavior in this zone.
🎯 Target: 3,365.89 resistance
📍 Entry Zone: Grey box (based on previous structure)
Let me know your thoughts — are you also watching this zone?
#XAUUSD #GoldAnalysis #LiquidityGrab #SmartMoneyConcepts #PriceAction #TradingPlan #TradingView

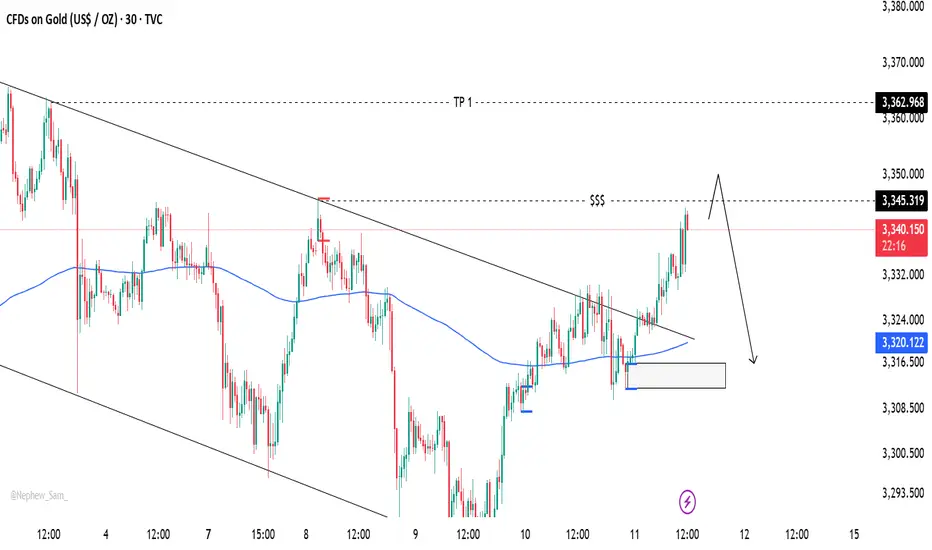
Gold’s Chart Update Next Move: Bullish or Bearish?Gold has shown strong bullish momentum 💪 as it breaks through the descending trendline 📉, positioning itself to target the upper liquidity zone 💰. Right now, we have two key scenarios to watch:
1️⃣ Bullish Scenario: If Gold breaks above the 3345 level and closes a solid candle above it 🔝, we could see a move towards 3360 🚀, signaling further upward potential.
2️⃣ Bearish Scenario: However, if Gold sweeps the 3345 zone and fails to maintain the bullish momentum 🔻, we may see a pullback that could push prices lower 📉.
Stay vigilant 👀 and keep an eye on price action for the next big move! 🔍📊
Gold surged higher but encountered resistance and pulled back.Spot gold edged higher, with the highest level reaching $3,374.71 per ounce, the highest since June 23. Over the weekend, Trump announced that a 30% tariff would be imposed on goods imported from the European Union starting from August 1, which further intensified market concerns about international trade and provided upward momentum for gold prices.
Gold prices rose 1% last Friday, closing at $3,357.39 per ounce, as investors turned to safe-haven assets after U.S. President Trump announced a series of tariff measures. Analysts said that the uncertainty premium has returned to the market again.
U.S. President Trump threatened on Saturday (July 12) to impose a 30% tariff on goods imported from Mexico and the European Union starting from August 1. Prior to this, he had engaged in weeks of negotiations with these two largest U.S. trading partners but failed to reach a comprehensive trade agreement. The escalation of the trade war has angered U.S. allies and unsettled investors.
It is worth noting that U.S. President Trump plans to make a "major announcement" on the Russia issue on Monday, which also requires attention from investors.
you are currently struggling with losses,or are unsure which of the numerous trading strategies to follow,You have the option to join our VIP program. I will assist you and provide you with accurate trading signals, enabling you to navigate the financial markets with greater confidence and potentially achieve optimal trading results.
XAUUSD Bullish Signal | Technical + Custom AlgoSmart Trend Signal | Technical Analysis + Custom Algorithm
This signal is the result of a combination of classic technical trend analysis and a proprietary software I personally developed.
XAUUSD Long OpportunityXAUUSD is bullish per the 4 hour and 1 hour timeframe with continued bullish momentum coming out of the fundamentals around tariff uncertainty. There is clear bullish market structure.
XAUUSD is currently sitting on the pivot level of $3350 (Resistance turned support) after a retracement prior for the NY opening bell which gives rise for a long opportunity from this level towards the next Pivot point at $3391.
On the hour timeframe, price is trading above the 50 and 200 SMA and is currently sitting upon the 21 SMA which XAUUSD has used push point from in the past trending markets. RSI is currently sitting in a sweet spot region of the RSI between 45-55 indicating this is a valid retracement and price is looking to turn bullish again soon.
This provides 4 points of Bullish confluence within the momentum in favour of further bullish movements
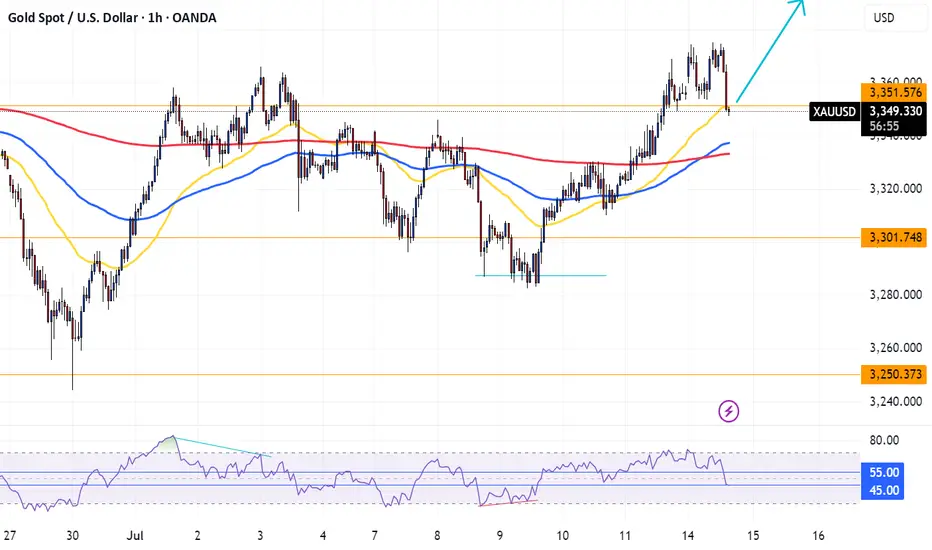
XAUUSD - Gold Awaits Tariff News?!Gold is trading above the EMA200 and EMA50 on the hourly chart and is trading in its medium-term ascending channel. We remain bullish on the commodity and can expect to see $3,400. A correction towards the demand zones would provide us with a better risk-reward buying opportunity.
Gold markets experienced significant volatility this past week, largely driven by global trade developments and speculation over future Federal Reserve actions. Although gold posted a positive weekly performance, it remained confined within its recent trading range and continued to trade cautiously.
Marc Chandler, CEO of Bannockburn Global Forex, noted, “Gold saw declines on Monday and Tuesday, but a three-day rally brought the week to a positive close. It appears that the announcement of new U.S. tariffs played a major role in this rebound. However, it remains uncertain whether the consolidation phase following the historic high near $3,500 has concluded.”
Adam Button, head of currency strategy at Forexlive.com, said that since the passage of the “Big, Beautiful Bill” last week, markets have split into two opposing camps. “The optimists are enthusiastically buying equities, while the pessimists are flocking to precious metals. The bulls believe the budget deficit could stimulate growth, but the bears are concerned about the long-term burden of repaying it.”
He continued: “This divide is evident across the market. Bearish capital is flowing into bitcoin, silver, and gold. While retail traders are largely focused on bitcoin and silver, gold remains the preferred safe haven for central banks and global reserve managers. These institutions are likely observing Trump’s policies and the political landscape carefully before reducing reliance on the U.S. dollar and reallocating reserves toward gold.” He added, “Among retail traders, patience seems to have worn thin, and many are ready to enter the market aggressively.”
Button also stated that the markets are no longer reacting seriously to Trump’s tariff rhetoric. “The reaction of the Canadian dollar after the 35% tariff announcement on Thursday clearly reflected this indifference. Even the Brazilian real barely moved despite facing unexpected tariffs. Now all eyes are on the potential tariffs on Europe—an announcement that could come at any moment and serve as a key test. Still, I expect the market will shrug it off. The only question is whether that indifference lasts an hour or even less.”
Meanwhile, Deutsche Bank has issued a warning that financial markets may be underestimating the risk of Federal Reserve Chair Jerome Powell being dismissed by Trump. According to Bloomberg, George Saravelos, the bank’s senior strategist, said that such a move could result in a 3–4% drop in the U.S. dollar and a 30–40 basis point surge in Treasury yields within a single day.
He emphasized that removing Powell would be a significant blow to the Fed’s independence and would raise concerns about direct political interference in monetary policymaking. The market’s long-term response would depend on Trump’s nominee to replace Powell, how other Fed officials react, and the overall state of the economy. Deutsche Bank also warned that the U.S.’s weak external financing position could amplify market volatility well beyond the initial shock.
Looking ahead to next week, investors will be closely watching developments around trade tariffs, but special attention will also be paid to the U.S. Consumer Price Index (CPI) for June. According to the ISM Purchasing Managers Index (PMI), prices in the manufacturing sector have slightly accelerated, while price components in the non-manufacturing sector have dropped notably. Since manufacturing only accounts for 10% of U.S.GDP, the risks to CPI appear skewed to the downside. A slowdown in inflation may lead some market participants to reassess the likelihood of a July rate cut—potentially halting the recent upward momentum of the U.S. dollar.
On Wednesday, June’s Producer Price Index (PPI) data will be released, followed by June retail sales figures on Thursday. Additionally, Friday will see the preliminary results of the University of Michigan’s consumer sentiment survey for July. This report is closely watched for its one-year inflation expectations. The annual rate surged to 6.6% in May before dropping to 5% in June. If this downward trend continues, it could reinforce the view that inflation risks are easing, potentially leading to a modest pullback in the dollar.
Gold Eyes CPI as Tariffs BiteGold (XAU/USD) continues to push higher, recently hitting $3,360. The latest catalyst: escalating trade tensions, as President Trump imposes a fresh round of 30% tariffs on EU and Mexican goods. This is boosting safe-haven demand and weighing on the dollar, albeit modestly. Still, with the Federal Reserve signalling a cautious stance on rate cuts, gold may need an additional spark to clear long-term resistance.
Chart Setup:
• Current Resistance: Gold is trading just below $3,365, a multi-session ceiling.
• Indicators: The RSI remains above 50, reflecting bullish momentum.
• Breakout Potential: A strong CPI print tomorrow could challenge this uptrend. But if CPI cools, gold could test the $3,400 psychological barrier.
• Pullback Risk: A drop below $3,350 (23.6% Fibonacci) could bring us back to the $3,340–$3,320 support zone.
Markets are on edge ahead of Tuesday's U.S. CPI report, which may significantly influence inflation expectations, Fed policy, and safe-haven demand.

GOLD H2 Intraday Chart Update for 14 July 2025Hello Traders,
we have no major news today, But Tariff News remains agendas for now
All eyes on 3380-3400 zone breakout for further upside, only below 3350 GOLD will move towards 3330 level with continuation of 3310 level
Disclaimer: Forex is Risky

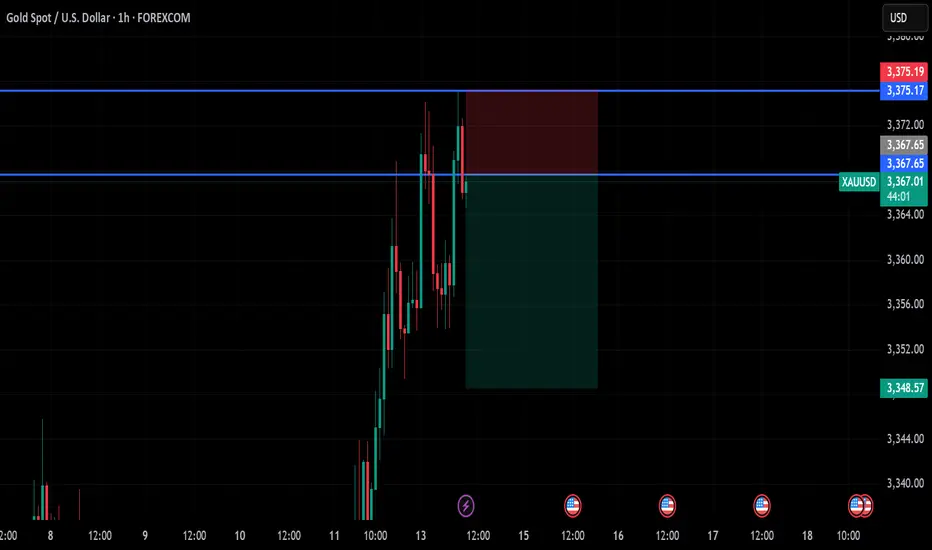
gold on sell reverse#XAUUSD needs reverse below last week support 3350, now entry at 3367.5.
Target 3350-3340, stop loss at 3375.19.
D1 TF still shows bullish continuation which can Target 3385-3390, expect entry above 3376
Adjust after shock and then go longNews: In the early Asian session, spot gold rose slightly, reaching a high of $3,372.65/ounce, the highest since June 23. Trump announced last weekend that he would impose a 30% tariff on goods imported from the EU from August 1, which further heated up the market's concerns about international trade and provided momentum for gold prices to rise. In the early Asian session, spot gold rose slightly, reaching a high of $3,373.99/ounce so far, the highest since June 23. Trump announced last weekend that he would impose a 30% tariff on goods imported from the EU from August 1, which further heated up the market's concerns about international trade and provided momentum for gold prices to rise.
Analysis of gold trend: Today it hit a new high at around 3373. From the daily chart, gold has closed three consecutive positive days. The K-line pattern is a bullish signal. From the indicators, the RSI turned upward from a low level, and the Stoch indicator formed a golden cross at a low level. It is currently running in the middle. The indicators show that gold is still likely to rise in the short term. At the same time, we should also pay attention to the suppression of the 3400 area on the upper track of the daily Bollinger band. In the short term, pay attention to the breakthrough of this level. Once 3400 is not broken through for multiple times, gold will still fall back to test the 3280 support in the future. Once it breaks through 3400, gold will test the 3450 area. In the short term, it is still likely to rise. The operation strategy remains unchanged.

XAU/USD Setup THIS WEEK
Expecting a drop into the 3300–3310 zone, where we have:
4H Fair Value Gap
Trendline confluence
Liquidity below New York Low
From there, looking for a potential bullish reaction targeting:
📈 3405 – area with resting liquidity above recent highs.
📍 No confirmed bullish structure yet — waiting for a shift on the 5M/15M timeframe to confirm entry.

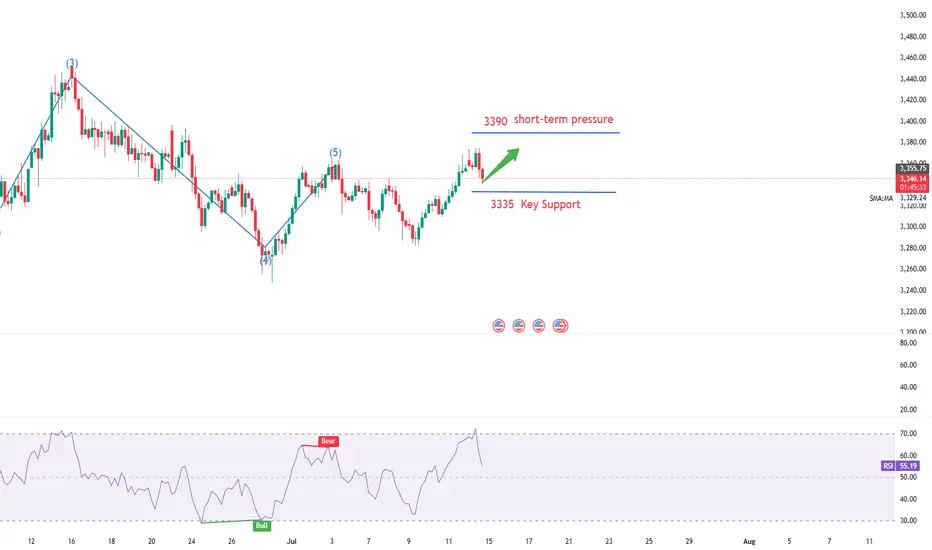
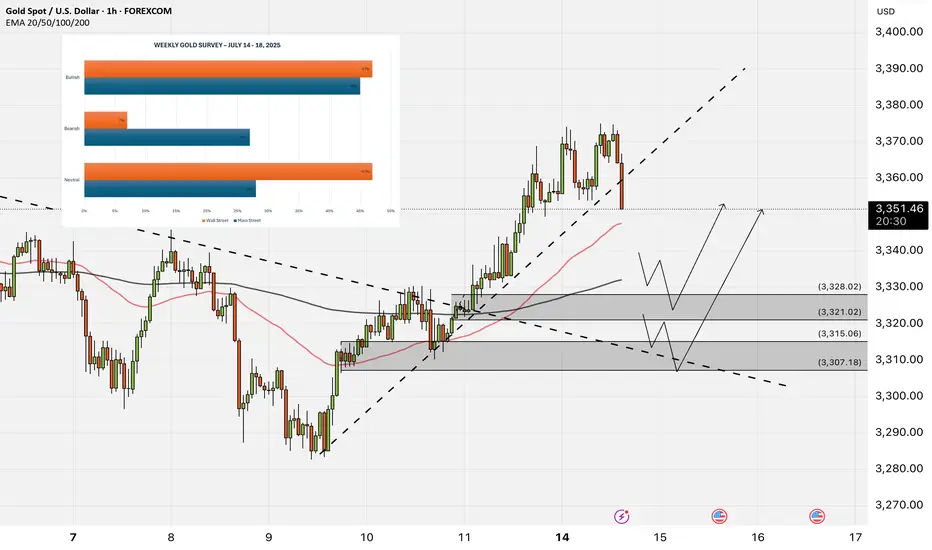
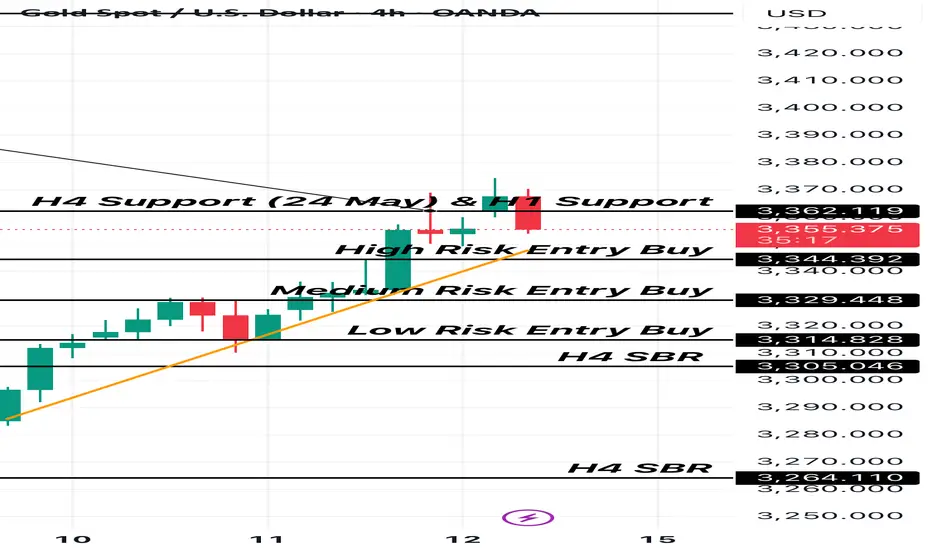
Gold Medium to Short Term Outlook Gold has shifted into a bullish structure after reclaiming key technical levels.
The strong impulsive move from below $3,300 into the $3,354–$3,370 resistance area reflects renewed buying interest, likely driven by improving sentiment and shifting macroeconomic expectations.
If bulls maintain control and price breaks and holds above $3,354, we could see continuation toward $3,383 and $3,400, with $3,416 marking the next major higher-timeframe resistance. These levels will be critical in determining whether gold resumes a broader bullish trend or begins to stall into a deeper correction.
On the flip side, if gold begins to fade below $3,354, then the $3,335–$3,305 pullback support zone will be key for potential bullish re-entry attempts.
A sustained break below this area would invalidate the current bullish leg and expose the market to a deeper retracement toward $3,289–$3,267, with $3,241–$3,208 acting as the higher-timeframe support floor.
📌 Key Levels to Watch
Resistance
‣ $3,370
‣ $3,383
‣ $3,400
‣ $3,416
Support
‣ $3,335
‣ $3,305
‣ $3,289
‣ $3,267
‣ $3,241
‣ $3,208
🔎 Fundamental Focus
Multiple high-impact U.S. data releases this week, including CPI, PPI, Retail Sales, and Unemployment Claims.
Expect elevated volatility across sessions.
⚠️ Manage your risk around news times. Stay sharp.

"Gold at a Crossroads! Bullish or Bearish? (Trade Plan)"🦹♂️💰 "Gold Heist Alert: XAU/USD Bullish Raid or Bearish Ambush?" 💰🦹♂️
🌍 Greetings, Market Pirates & Profit Raiders! 🌍
(Hola! Oi! Bonjour! Hallo! Marhaba!)
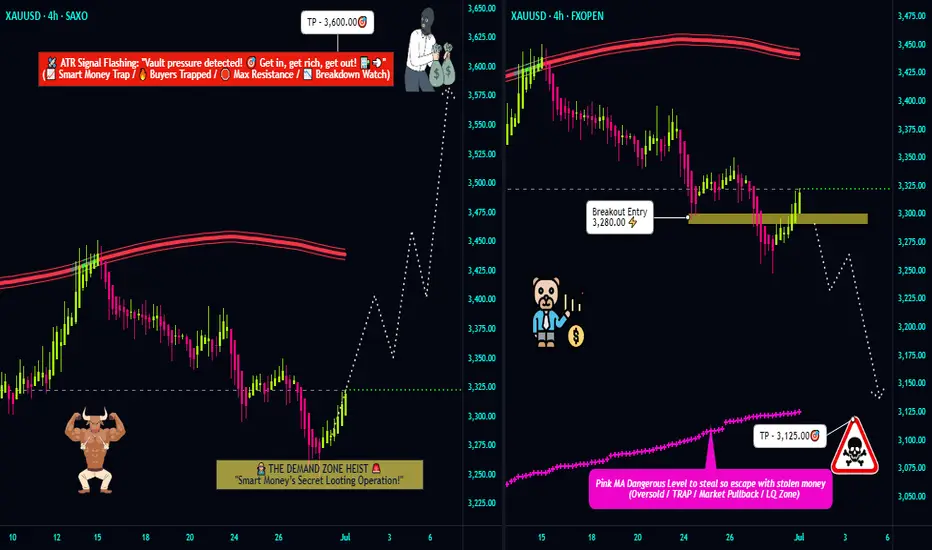
Based on the 🔥Thief Trading Method🔥, here’s our strategic heist plan for XAU/USD (Gold vs. Dollar). Follow the chart markings for high-probability loot zones—whether you're a bullish bandit or a bearish burglar! 🏴☠️💸
🎯 Entry Strategy (Where to Strike)
"The treasure is ripe for taking! Breakout = GO TIME!"
✅ Long Entry (Bullish Raid): Jump in at current levels if the uptrend holds.
✅ Short Entry (Bearish Ambush): Wait for a break & close below 3280.00 (confirms downtrend).
🛑 Stop Loss (Escape Route)
🚨 For Bulls: Bail out if price hits 3240.00 (SL tightens if trend strengthens).
🚨 For Bears: Retreat if price surges past 3360.00 (only activate SL post-breakout!).
🎯 Take Profit (Loot & Scoot!)
💰 Bullish Thieves: Aim for 3600.00 (or exit early if momentum fades).
💰 Bearish Bandits: Target 3125.00 (or escape before the cops—err, reversal—arrives).
📡 Market Intel (Why This Heist?)
Gold’s in a neutral zone (but bulls have the edge! 🐂📈). Key factors:
Macroeconomic shifts
COT data clues
Sentiment & seasonal trends
(Full breakdown in the chart notes—klick the 🔗! 🔍🌐)
⚠️ Danger Zones (News & Risk Control)
🚨 High-Impact News = NO NEW TRADES!
🚨 Protect open positions: Use trailing stops to lock in profits.
🚨 Adjust SLs if volatility spikes!
💥 Boost the Heist! 💥
Like & Share to fuel our next market robbery! 🚀💰
Follow for more lucrative trade setups—coming soon! 👀🔥
🎯 Trade Smart, Steal Smarter! 🦹♂️💎
GOLD Breakout or Fakeout? Thief’s Guide to Safely Rob the Move!🏆 XAU/USD Master Plan: Loot the Bullish Rally Before the Bearish Trap!💨💰
🌟 Hola! Bonjour! Hallo! Marhaba! 🌟
Attention Money Makers & Market Robbers! 🤑💸
🔥 Thief Trading Strategy Alert 🔥
Time to execute our gold heist on XAU/USD! Based on technical + fundamental looting tactics, here’s the play:
📈 ENTRY ZONES (4H TIMEFRAME)
BUY: Sneak in at Market Maker’s Buy Zone (Pullback Entries Only!).
SELL: "The vault’s wide open!"—Ambush bearish traps at risky highs (Red Zone).
🛑 STOP-LOSS (THIEF RULES)
Hide your SL at:
Past key lows OR nearest swing low (4H).
Adjust based on your risk, lot size, & robbery multiplier.
🎯 TARGET: 3525.00 (OR ESCAPE EARTHER!)
Scalpers: Long-side only! Trail your SL to lock loot.
Swing Thieves: Join forces—big pockets or small, execute the plan!
⚠️ WARNING: NEWS = VOLATILITY TRAPS!
Avoid new trades during news.
Use trailing SL to protect stolen profits.
📰 FUNDAMENTAL LOOT LIST (READ BEFORE HEIST!)
COT Report, Macro Data, Sentiment Outlook—Link in bi0! 🔗🤙🏻👉🏻👉🏻
Gold’s bullish now… but robbers adapt fast!
💥 BOOST THIS PLAN = STRONGER GANG!
Hit 👍 & Share—More boosts = More gold stolen daily!
Stay tuned… Next heist drops soon! 🚀🐱👤
