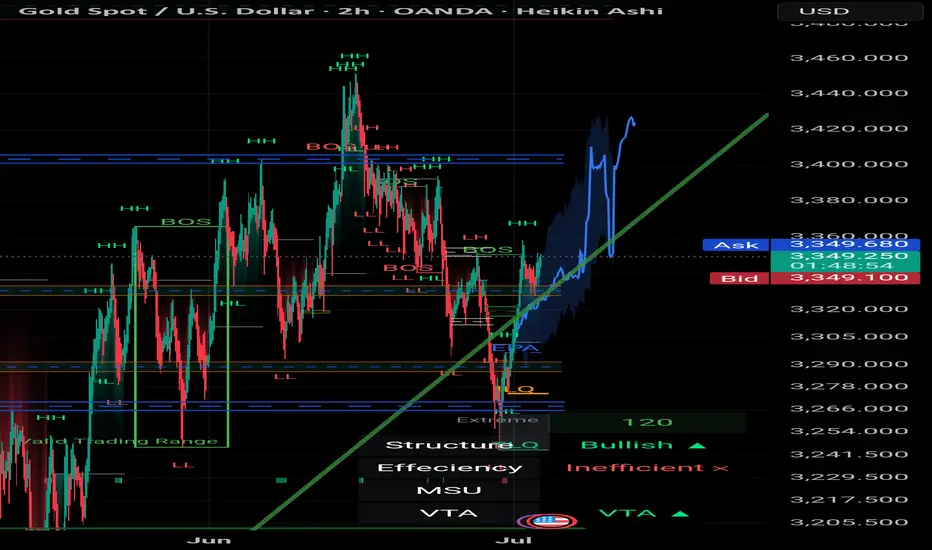
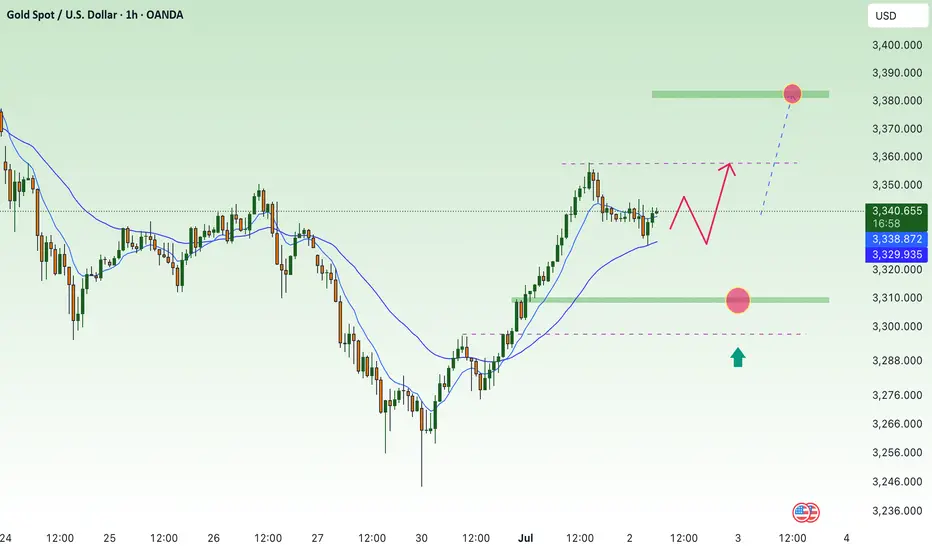
Mozafari Nejad ### Multi-Timeframe Analysis: 15min + 30min + 2# XAU/USD | Gold Market Outlook by Mohsen Mozafari Nejad
### Multi-Timeframe Analysis: 15min + 30min + 2h | July 2–3, 2025
---
## 🔍 Technical Overview:
| Timeframe | Structure | Efficiency | Context |
|-----------|-----------|------------|---------|
| 15min | Bullish ✅ | Efficient ✅ | Reverse H&S complete – price entering neckline zone |
| 30min | Bullish ✅ | Inefficient ❌ | Clean BOS – ready for potential continuation |
| 2H | Bullish ✅ | Inefficient ❌ | HL confirmed – clear bullish delivery range ahead |
---
## 🧠 Key Insights:
- **Left Shoulder - Head - Right Shoulder** clearly visible and now validated with neckline break
- Price is reacting from **last TLQ + ILQ zones** with MSU
- Strong **liquidity gap** above 3,380–3,405 likely to be targeted
- **Highs around 3,420–3,440** may act as liquidity magnet if clean break happens
- **BOS and CHoCH** confirmed across all LTFs — strong bullish intent
- Structure remains **bullish** as long as 3,312–3,320 HL holds
---
## 🎯 Price Zones to Watch:
| Zone | Action |
|--------------|----------------|
| 3,335–3,340 | OB Flip Support / Demand (Retest Possible) |
| 3,368–3,375 | Reaction Zone / Short-Term Take Profit |
| 3,404–3,420 | Major Liquidity Above / SH Grab |
| 3,428–3,440+ | Stop-Hunt Potential for Final Exit |
---
## 📌 Trade Scenarios:
### 🟢 Long Setup
- **Entry:** 3,340–3,348 (OB retest or continuation)
- **SL:** below 3,328
- **TP1:** 3,375
- **TP2:** 3,400
- **TP3:** 3,420+
### 🔴 Caution for Short
Only valid if price shows **CHoCH + strong rejection** from above 3,420–3,440.
Otherwise, trend continuation is dominant.
---
## 🧭 Summary:
> Gold continues its bullish structure in all LTFs.
> Reverse H&S has broken neckline cleanly.
> Momentum + inefficiency zones above = clear drive to liquidity.
> Patience is key – reentry on OB retest = high R/R setup.
---
🖋️ Prepared by: **Mohsen Mozafari Nejad**
*Smart Money | Liquidity Zones | Order Blocks | MSU/MSD Framework*
Xauusdlong
XAUUSD Analysis – July 2–3, 2025: Resistance Holds Gold is currently trading around 3,337 USD, having tested the 3,350 USD resistance zone without a successful breakout. The price remains under pressure from key macroeconomic factors:
- The Dollar Index (DXY) is stable above 106 – a sign of continued demand for the greenback, which weakens gold.
- U.S. 10-year Treasury yields hold around 4.35%, reinforcing the view that the Fed will keep interest rates high.
- The Core PCE report for June remains above the Fed’s 2% inflation target, decreasing expectations of a rate cut in Q3.
- Safe-haven demand is weak, as geopolitical tension in the Middle East and Eastern Europe remains subdued.
➡ Overall, these factors confirm that XAUUSD remains under bearish pressure in both the short and medium term, especially while key resistance remains intact.
1. Technical Analysis – XAUUSD on D1 Chart
- Price recently tested the 3,340 – 3,350 USD resistance zone, a confluence of:
Previous supply zone
- Fibonacci retracement 0.5–0.618 from 3,399 USD
- Key Change of Character (CHoCH) level
- RSI is forming a mild bearish divergence, signaling weakening bullish momentum.
- EMA20 and EMA50 are both sloping downward – confirming the prevailing bearish trend.
This setup is typical of a Sell on Rally pattern, with each retracement being rejected at strong resistance.
2. Key Technical Zones to Watch
Technical Role
- 3,350 – 3,340 Major resistance (Fibo 0.5–0.618 + supply + CHoCH)
- 3,294 – 3,285 Nearest support – previously a resistance-turned-support
- 3,255 – 3,235 Short-term target zone – June low
- 3,223 – 3,205 Strong medium-term support – April low + extended Fibo
3. Suggested Trade Setup
Preferred Scenario: SELL below 3,350
Entry: 3,345 – 3,347
Stop Loss: 3,351
Take Profit 1: 3,335
Take Profit 2: 3,330
Take Profit 3: 3,320
Ps : XAUUSD is retesting a major resistance zone without macro or technical catalysts for a sustained breakout. The best approach remains to sell at resistance and take profit near support, in alignment with the ongoing bearish trend.
The strategy will be updated regularly – don’t forget to save and follow to stay ahead of market opportunities.
The analysis was provided by @Henrybillion
As expected, it will fall and form a head and shoulders bottom📰 News information:
1. ADP data, for reference of tomorrow's NFP data
2. Interest rate cuts and Powell's dovish comments
3. Geopolitical impact on the gold market
📈 Technical Analysis:
Yesterday we expected gold to retreat to the 3330-3320 area. Today, gold hit a low of around 3328 during the Asian session, which is in line with our judgment of the market trend. In the short term, gold may still fall. First, it may test the 3323 support line. If it falls back to this position during the day, you can try to go long. In the short term, focus on the 3315-3305 long-short dividing line below. If gold gets effective support below, it is expected to form a head and shoulders bottom pattern. The short-term decline will accumulate momentum for the future rise. Pay attention to the ADP data during the NY period
🎯 Trading Points:
BUY 3323-3315-3305
TP 3340-3350-3360-3375
In addition to investment, life also includes poetry, distant places, and Allen. Facing the market is actually facing yourself, correcting your shortcomings, confronting your mistakes, and strictly disciplining yourself. I hope my analysis can help you🌐.
FXOPEN:XAUUSD PEPPERSTONE:XAUUSD FOREXCOM:XAUUSD FX:XAUUSD OANDA:XAUUSD TVC:GOLD
How do we plan before ADP and NFP?📰 News information:
1. ADP data, for reference of tomorrow's NFP data
2. Interest rate cuts and Powell's dovish comments
3. Geopolitical impact on the gold market
📈 Technical Analysis:
The market will continue to fluctuate before the ADP data, and the market will continue to rise after the adjustment. In the 4H cycle, the upper rail of the pressure is temporarily suspended, and the Bollinger Bands also close. This is why I emphasize the need to pay attention to the 3323 support line below. At present, gold rebounded, I think it will touch 3348 at most, that is, it rebounded to 50%. Therefore, before the ADP data, I still hold the position of 3340-3350 for shorting, and find support for long at 3325-3315 below. I have marked the pattern of head and shoulders bottom in the figure. I have been engaged in spot, futures, foreign exchange and other transactions for many years. My analysis ideas can be referred to by brothers
🎯 Trading Points:
SELL 3340-3350
TP 3330-3325-3315-3295
BUY 3323-3315-3305
TP 3340-3350-3360-3375
In addition to investment, life also includes poetry, distant places, and Allen. Facing the market is actually facing yourself, correcting your shortcomings, confronting your mistakes, and strictly disciplining yourself. I hope my analysis can help you🌐.
TVC:GOLD OANDA:XAUUSD FX:XAUUSD FOREXCOM:XAUUSD PEPPERSTONE:XAUUSD FXOPEN:XAUUSD
XAUUSD:Go long
Gold continued to strengthen in the Asian session, mainly due to adverse signals from tariff talks, which spurred a sharp rebound in gold prices. At present in the 3340 near the shock, this position is a short - term small pressure, from the technical trend, is still a strong long arrangement, so I think continue to break up is inevitable. Above you can look at 3350 first, then 3368/3390.
My idea is to wait for a pullback after entering the long, at present, there is not much room for a pullback, and under the strong market, there are fewer opportunities, so you can consider the first 3336-40 direct layout of long orders. If there is a certain range of retracement to consider adding positions.
Trading Strategy:
BUY@3336-40
TP:3349-54
More detailed strategies and trading will be notified here ↗↗↗
Keep updated, come to "get" ↗↗↗
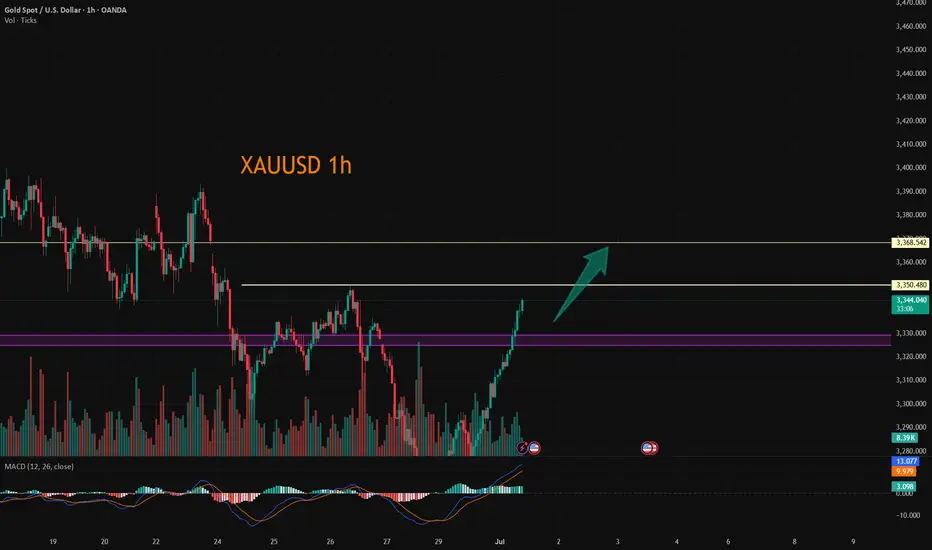
Will Gold Continue Its Strong Rally or Face a Pullback?XAUUSD 02/07: Will Gold Continue Its Strong Rally or Face a Pullback?
📉 Technical Analysis – Gold Faces Short-Term Pullback After Strong Rally
Gold has been experiencing a clear rally in recent days, but it’s currently undergoing a brief correction. The price has recently dropped slightly, prompting traders to keep a close eye on key levels for potential reversal or continuation of the bullish move.
🌍 Macroeconomic Context – Factors Impacting Gold's Price
USD Fluctuation: The weakness in the US Dollar continues to affect gold prices, creating opportunities for the precious metal to maintain its upward movement.
Geopolitical Tensions: Ongoing global tensions, including the US-Iran conflict, act as a safe-haven factor, supporting gold demand.
Interest Rate Expectations: The market is closely watching for any changes in interest rate policies. Any future rate cuts by the Fed could further bolster gold's price.
📊 Technical Outlook (H1 – H4 – D1)
Short-Term Trend: On the H1 timeframe, the price of gold touched a key level near 3340. From there, the price began to experience a pullback. However, the upward momentum remains strong on higher timeframes.
Key Support Levels: The 3300 level remains a crucial support. If the price stays above this, there’s a chance for gold to continue rising towards higher levels.
Key Resistance Levels: 3360 and 3380 are critical resistance levels. If breached, gold could move towards new highs.
📍 Important Support and Resistance Levels:
🔺 Resistance: 3345 – 3360 – 3380 – 3400
🔻 Support: 3300 – 3290 – 3270 – 3250
💡 Trading Plan for Today, 02/07:
🔵 BUY ZONE:
📈 Entry: 3305 – 3303
📉 SL: 3297
💰 TP: 3315 → 3325 → 3340 → 3360
🔴 SELL ZONE:
📉 Entry: 3360 – 3362
📈 SL: 3368
💰 TP: 3350 → 3340 → 3320
📣 Conclusion:
Gold is showing signs of short-term correction but remains a strong asset due to geopolitical factors and monetary policies. Buying opportunities continue to be attractive at support levels, while key resistances will play a crucial role for any breakout. Keep an eye on the mentioned levels to capitalize on market movements.
Happy trading and best of luck to all traders!
Waiting for gold price to grow with ADP-NF⭐️GOLDEN INFORMATION:
Gold (XAU/USD) finds it difficult to extend its two-day rally and trades within a tight range during Wednesday’s Asian session, hovering just below Tuesday’s one-week high. A modest rebound in the US Dollar—recovering from its lowest level since February 2022—has put pressure on the precious metal. Additionally, improving market sentiment continues to reduce demand for safe-haven assets like Gold, further limiting its upside.
⭐️Personal comments NOVA:
Steady trendline recovery, sustained buying could move towards 3383 with today's ADP-NF data
⭐️SET UP GOLD PRICE:
🔥SELL GOLD zone: 3382- 3384 SL 3389
TP1: $3370
TP2: $3360
TP3: $3350
🔥BUY GOLD zone: $3312-$3310 SL $3305
TP1: $3320
TP2: $3330
TP3: $3340
⭐️Technical analysis:
Based on technical indicators EMA 34, EMA89 and support resistance areas to set up a reasonable BUY order.
⭐️NOTE:
Note: Nova wishes traders to manage their capital well
- take the number of lots that match your capital
- Takeprofit equal to 4-6% of capital account
- Stoplose equal to 2-3% of capital account
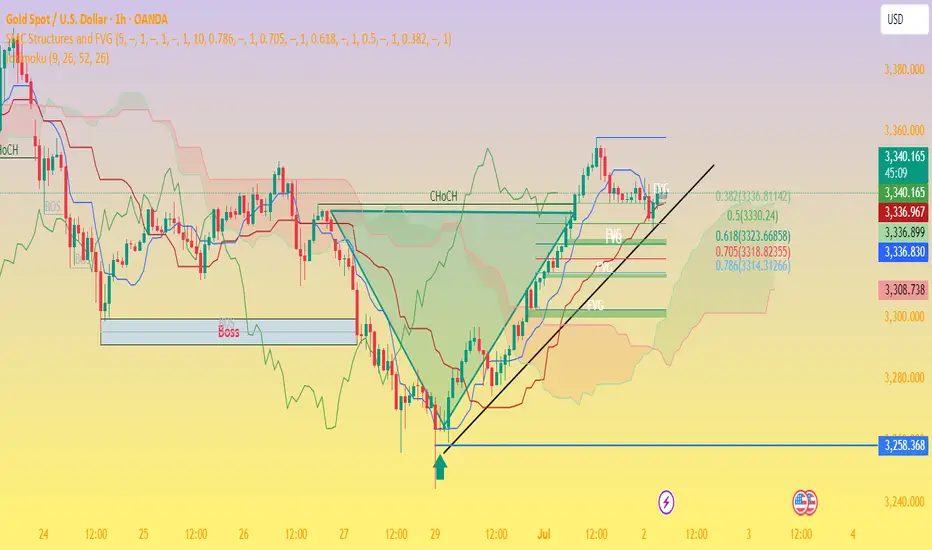
Gold Price Analysis – Bullish Momentum Holds Above FVGs🧠 Chart Breakdown:
Instrument: Gold Spot (XAU/USD)
Timeframe: 1H
Current Price: $3,340
Trend: Short-term uptrend intact
🔑 Key Observations:
Ch.o.Ch Confirmed (Change of Character):
The break above the previous structure high confirmed a bullish market structure shift.
Fair Value Gaps (FVG):
Multiple FVGs exist between $3,320 – $3,335, acting as potential demand zones and support levels.
Fibonacci Retracement:
Price is respecting the 0.382–0.5 levels ($3,336 – $3,330) well so far.
Below this, the 0.618 level at $3,325 is the next strong confluence zone.
Trendline Support:
The price is testing a rising trendline, adding dynamic support around the current level.
Ichimoku Cloud:
Price is above the cloud, which supports the bullish bias.
Conversion line (blue) and base line (red) are bullishly aligned.
📉 Possible Next Moves:
✅ Bullish Scenario:
Price bounces from current levels or slightly lower ($3,336–$3,330) and retests the recent high (~$3,355).
Breakout above $3,355 could open the door to $3,370+.
⚠️ Bearish Scenario:
If price breaks below $3,330 and the trendline, expect deeper pullbacks to:
$3,325 (0.618 Fib)
Then possibly $3,308 FVG support or $3,258 major demand zone.
📌 Conclusion:
Gold is still respecting bullish market structure with healthy pullbacks into support zones. As long as the price stays above $3,325, the bullish outlook remains valid. Watch for bullish reaction near the FVGs or a break above $3,355 to confirm upside continuation.
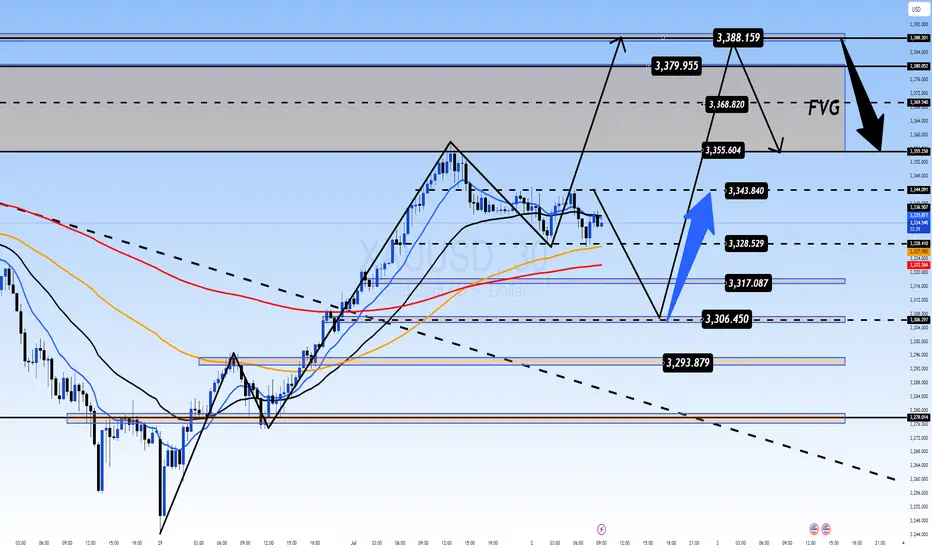
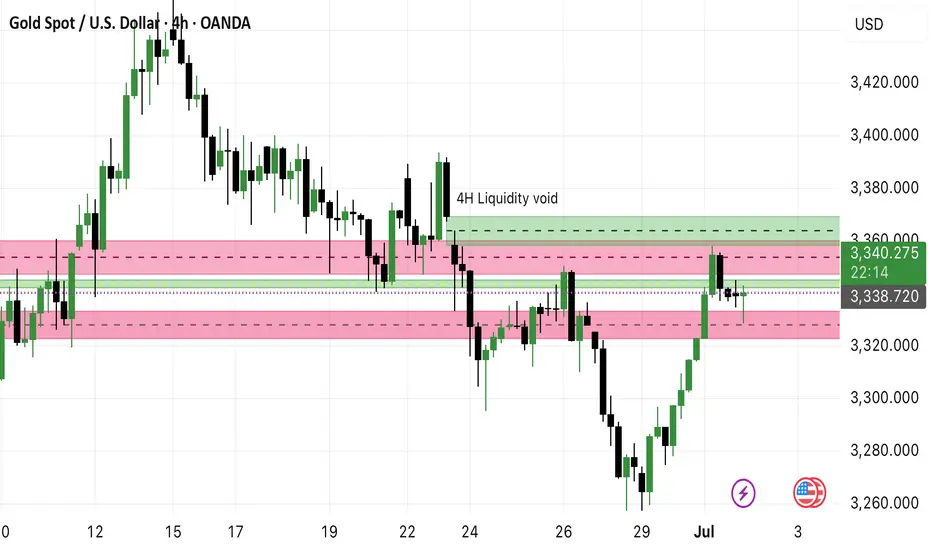
Gold(XAU/USDT) Analysis - Targeting 4H Liquidity VoidOANDA:XAUUSD
**Gold (XAUUSD) Trade Idea 🚀**
**🔍 Setup:**
- Price bounced from **Daily FVG (red)** & is now in **4H FVG (green)** ✅
- Targeting **4H liquidity void at 3400** 🎯
**⚡ Key Levels:**
- **Support:** 3338 / 3320
- **Resistance:** 3360 / 3380 / **3400 (main target)**
**🎯 Plan:**
- **Entry:** Hold above 3341 or pullback to 4H FVG
- **Stop:** Below 3320
- **Target:** 3400
*(Chart attached 👆)*
Liquidity Void: Its an imbalance which has high probability of getting filled
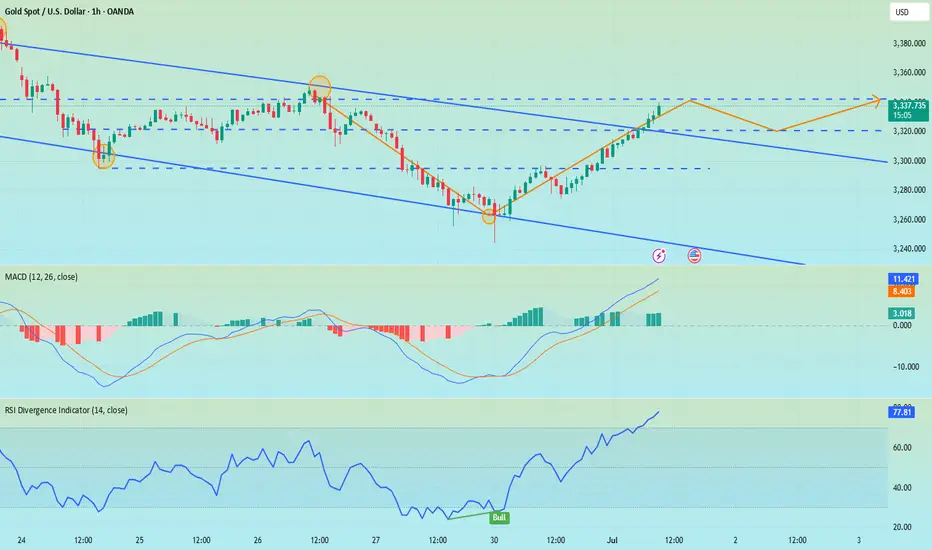
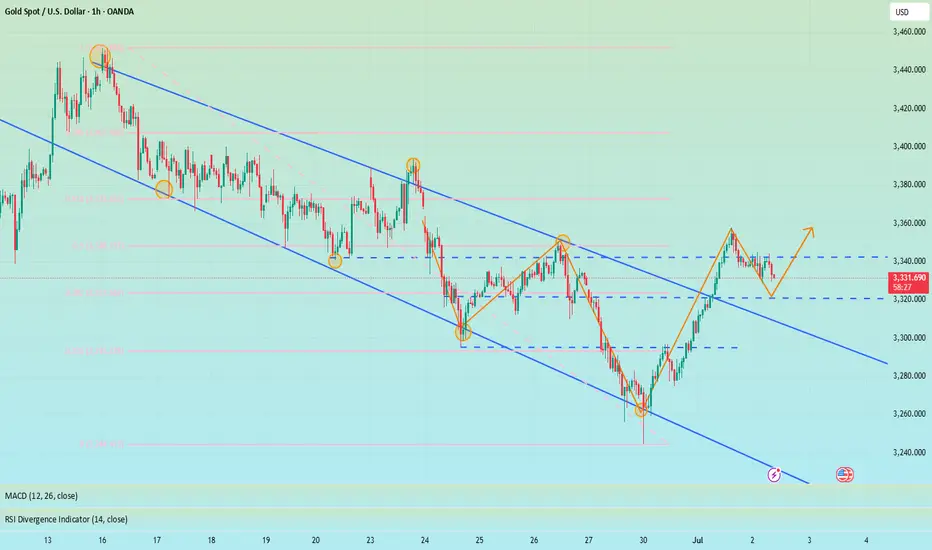
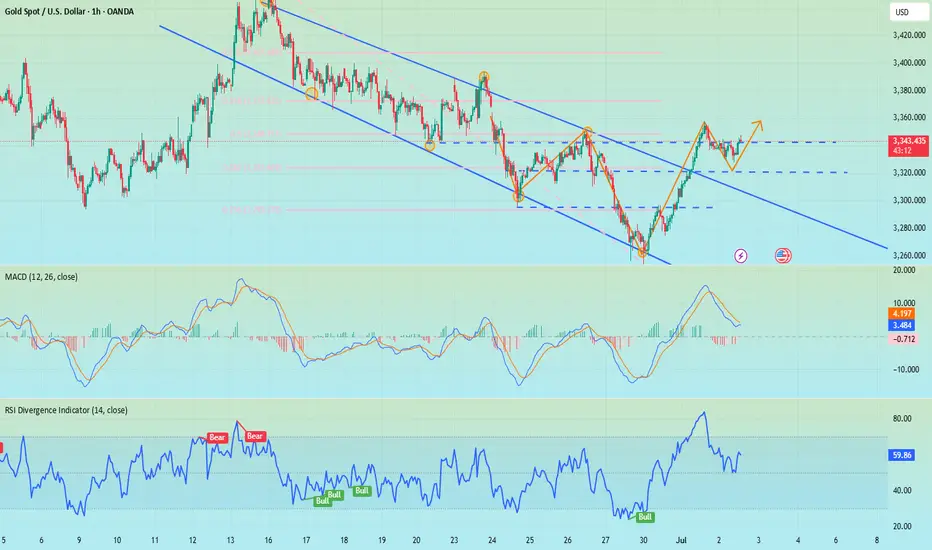
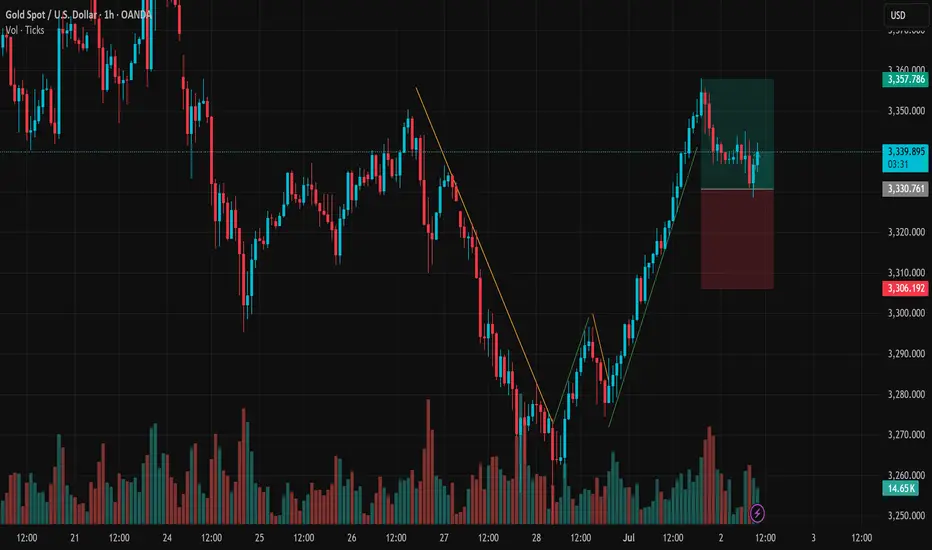
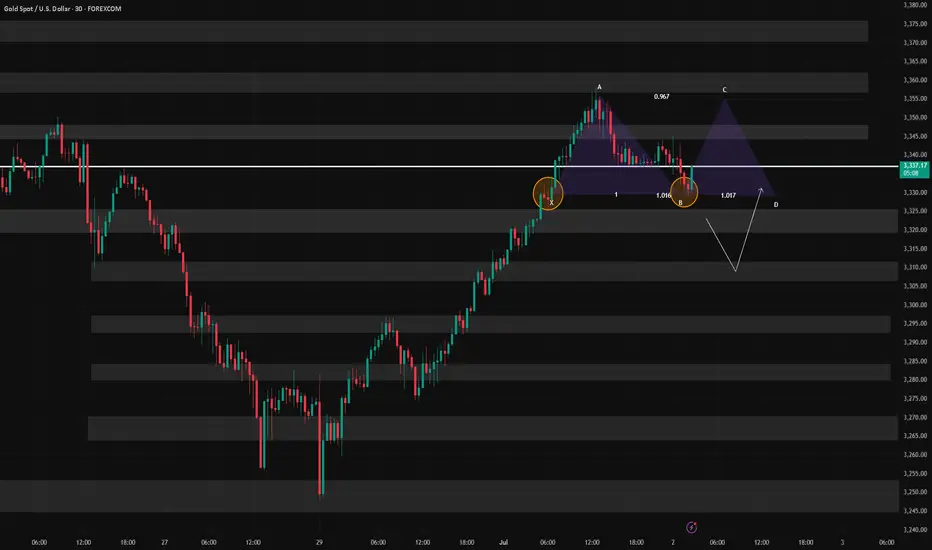
XAUUSD Consolidates Near Resistance After Strong RallyGold (XAUUSD) on the 1H timeframe has staged a solid bullish reversal from the 3,263 USD support zone, reaching a recent high of 3,357 USD. Now, the market is entering a consolidation phase just below this resistance. This price action may be setting the stage for the next directional move.
After breaking a clear descending trendline, XAUUSD formed a two-leg bullish structure with higher highs and higher lows – a classic signal of trend reversal. The rally paused around 3,357 USD, a previous swing high acting as short-term resistance. The price is currently ranging between 3,330–3,340 USD with decreasing volume, indicating a potential accumulation zone rather than distribution.
Resistance: 3,357 USD – breakout target
Support zone: 3,330–3,335 USD – short-term demand zone
Invalidation level: 3,306 USD – below this, bullish structure breaks
As long as price holds above 3,330 USD, a bullish continuation remains the primary scenario. Traders can look for pullbacks or bullish patterns within this zone for potential long entries. A break and close above 3,357 USD would confirm strength, opening the path toward 3,370 or even 3,390 USD.
Stop-loss should be placed below 3,306 USD to manage risk if the breakout fails. If price loses the 3,306 support decisively, the setup turns neutral to bearish short-term.
The breakout leg was supported by rising volume, validating real demand. Current low-volume sideways movement suggests the market is “cooling off” after the rally, often a precursor to the next breakout move. Watching for bullish engulfing candles or volume spikes near support can offer trade confirmation.
Conclusion:
Gold remains in a bullish technical structure on the 1H chart. The current range between 3,330–3,357 USD is key. If price breaks above resistance, we could see strong continuation toward higher levels. Traders should stay patient, manage risk carefully, and let price action confirm the next move.
GOLD H2 Intraday Chart Update For 2 July 2025Hello Traders,
Today all eyes on breakout of 3360-70 zone in order to GOLD go for further advance below this zone all eyes are remains on 3318 level if market successfully maintain 3330 level then will go down further towards 3300 Psychological Level after passing 3318
NFP main event of the day which is held by tomorrow
Disclaimer: Forex is Risky
7/2 Trapped Orders from Yesterday Turned ProfitableGood morning, everyone!
Yesterday’s early-entry gold short position encountered some temporary drawdown, but thanks to flexible adjustments, the trade has now moved into profit overall.
Currently, the price is hovering near a key support area. Based on the 1H and 2H charts, there is still room for further downside. At this point, there are two strategic options:
Close the position to lock in current profits;
Hold the position and wait for further decline, keeping in mind that if support holds, the price may rebound back toward the 3350 level, introducing some risk.
You can decide whether to stay in the trade or exit, depending on your risk tolerance and trading plan.
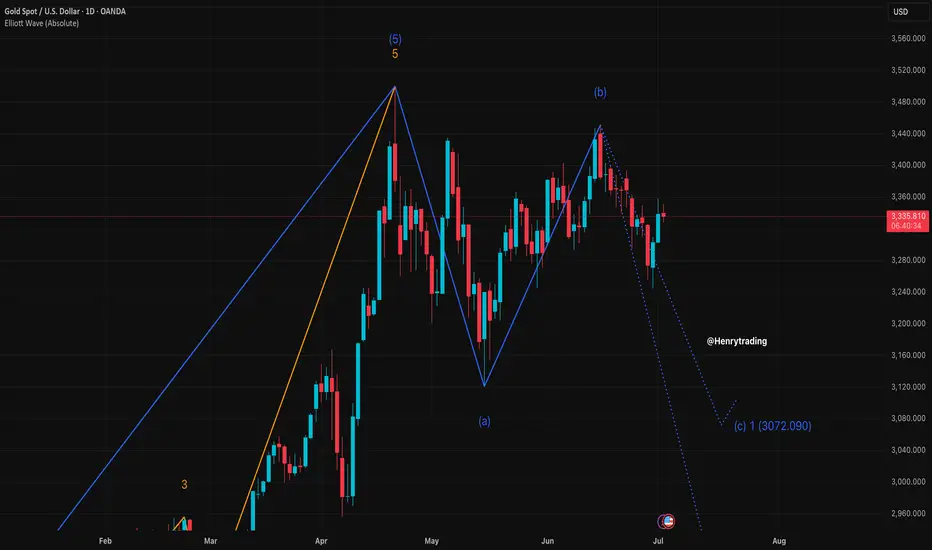
Gold operation suggestionsLooking back at the market in May and June, although gold has experienced adjustments, its shape is very resilient. In the monthly cycle, the price of gold is firmly above the MA5 moving average. From the perspective of large-cycle technical analysis, this is a typical strong bullish pattern, demonstrating the strong control of the bulls. As the adjustments are gradually in place, the later bullish outbreak is worth looking forward to. However, the adjustment to 3247 this time is not small, so in the short term, the gold price is likely to fluctuate upward. At present, 3451 is an important watershed. Once it is effectively broken through, the gold price is expected to hit the 3500 mark, and I personally believe that 3500 will not be the end point, and it is expected to be refreshed later.
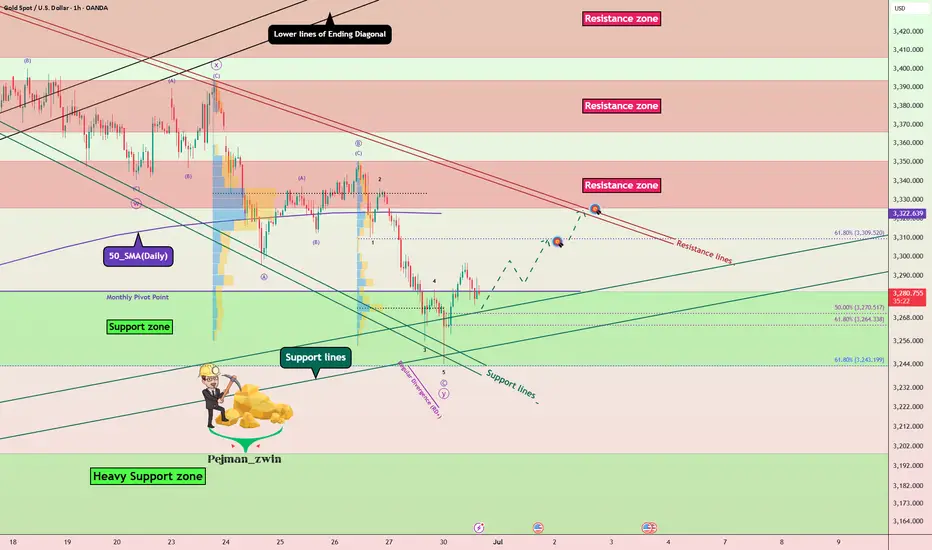
Gold Rebound Underway – Support Zone Holds Strong! - Short termGold( OANDA:XAUUSD ), as I anticipated in the previous idea , has attacked the Support zone($3,281-$3,243) and Support lines .
From an Elliott Wave theory perspective , it appears that Gold has completed 5 sub-waves of the main wave C .
Also, we can see the Regular Divergence(RD+) between Consecutive Valleys.
I expect Gold to rise to at least $3,307 in the coming hours.
Second Target: $3,321
Note: Stop Loss (SL) = $3,240
Gold Analyze (XAUUSD), 1-hour time frame.
Be sure to follow the updated ideas.
Do not forget to put a Stop loss for your positions (For every position you want to open).
Please follow your strategy; this is just my idea, and I will gladly see your ideas in this post.
Please do not forget the ✅ ' like ' ✅ button 🙏😊 & Share it with your friends; thanks, and Trade safe.
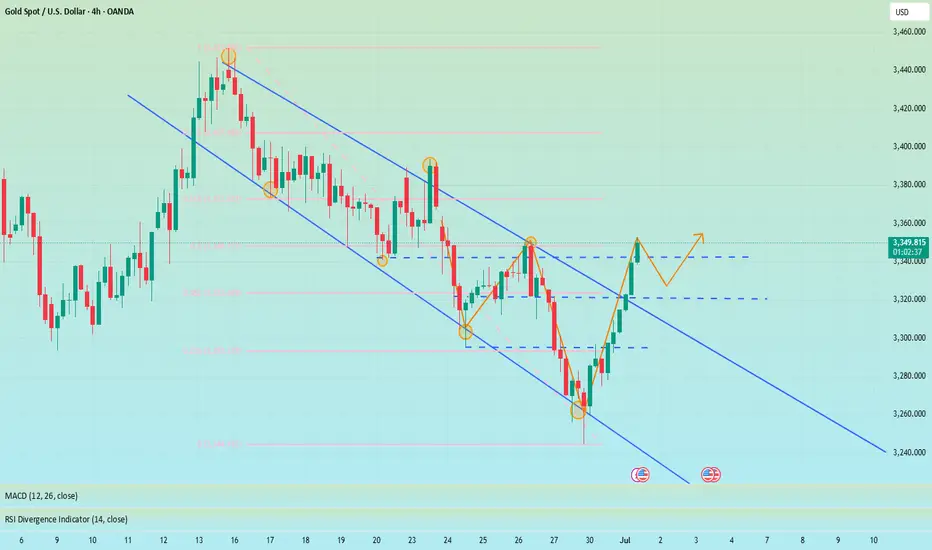
Can gold hit a new high again?During the U.S. trading session, spot gold trended higher in a volatile manner, reaching a three-day high of 3,357.88 as of 22:30. The rally was primarily driven by a weaker U.S. dollar, heightened uncertainty over U.S. trade agreements, and intensified market expectations for Federal Reserve rate cuts. The global economic uncertainties have highlighted gold's safe-haven value. Market participants should monitor the negotiation progress ahead of the tariff deadline on July 9. Traders have priced in at least two rate cuts in 2025. This Thursday's U.S. employment report may catalyze a decline in U.S. Treasury yields. Trump plans to replace Powell, demanding that the new chairman supports rate cuts. The market is focused on this week's ADP and non-farm payroll data to gauge the Fed's policy trajectory.
From a 4-hour technical perspective, the MACD has formed a bullish divergence, triggering a rebound with expanding red histogram bars. Prices are advancing along short-term moving averages, breaking through the previous range of resistance levels, indicating a short-term bullish trend. Before the non-farm payroll data, prices are expected to remain range-bound, with attention paid to safe-haven demand triggered by geopolitical risks. Focus on the opportunity for a secondary rally after the end-of-session pullback confirmation. Short-term resistance is seen at the 3,375-3,380 zone.
On the hourly chart, prices are in a narrow high-range consolidation with limited pullback momentum. Candlesticks maintain strength by relying on short-term moving averages.
you are currently struggling with losses,or are unsure which of the numerous trading strategies to follow,You have the option to join our VIP program. I will assist you and provide you with accurate trading signals, enabling you to navigate the financial markets with greater confidence and potentially achieve optimal trading results.
Trading Strategy:
buy@3330-3335
TP:3360-3365

Gold price rises by more than $100, will the bull run continue?📰 News information:
1. Geopolitical situation
2. PMI data
3. Global Central Bank Governors Meeting
📈 Technical Analysis:
The NY session is about to begin, and there are two things we need to pay attention to. First, the PMI data, and second, the talks between global central bank governors. If Powell again hints that the inflation outlook is weaker than expected, this will increase the Fed's easing bets and trigger a new round of decline in the US dollar. The dovish tone may help gold prices to further rebound. On the contrary, if Powell makes some hawkish or cautious remarks, this may exacerbate the recent downward trend in gold prices. The key point at present is the 3350 mark. If the 4H closing line of the NY session remains below 3350, then in the short term we are expected to continue to retreat to the 3330-3320 range. If the 4H closing line is above 3350 and stabilizes, gold may rebound to the 61.8% position, which is around 3372.
🎯 Trading Points:
SELL 3340-3350-3355
TP 3330-3325-3320
BUY 3330-3320
TP 3340-3350-3372
In addition to investment, life also includes poetry, distant places, and Allen. Facing the market is actually facing yourself, correcting your shortcomings, confronting your mistakes, and strictly disciplining yourself. I hope my analysis can help you🌐.
FX:XAUUSD FXOPEN:XAUUSD PEPPERSTONE:XAUUSD FOREXCOM:XAUUSD FX:XAUUSD OANDA:XAUUSD TVC:GOLD
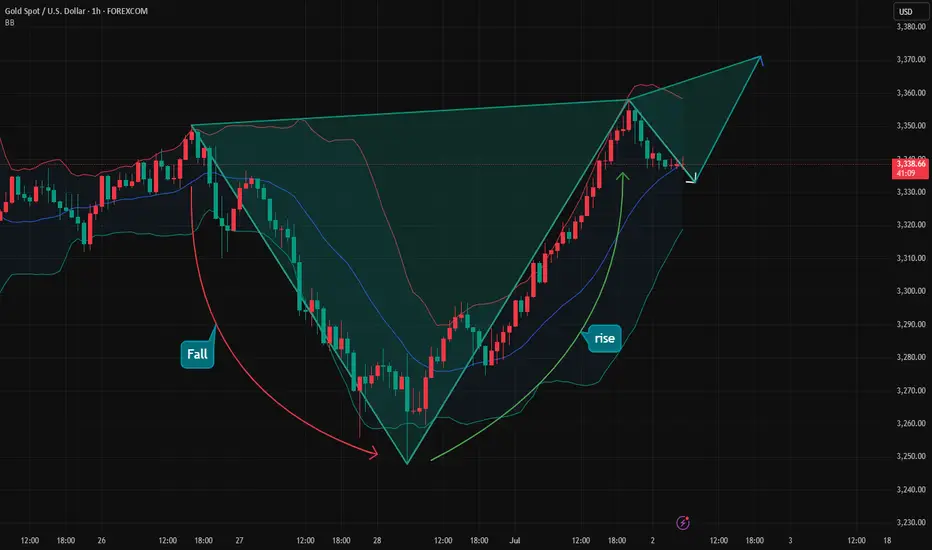
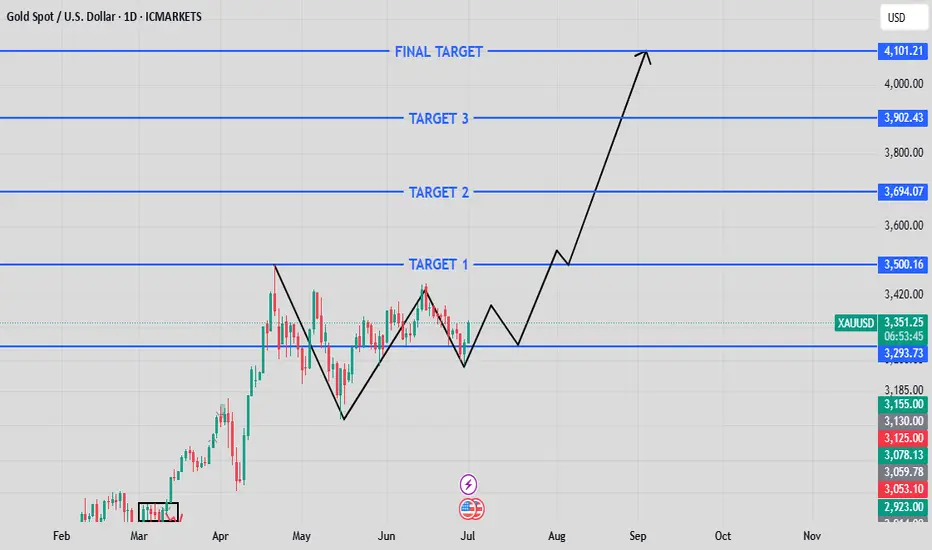
XAUUSD MONTHLY/WEEKLY ANALYSISWhat we’re seeing here on **XAUUSD (Gold Spot)** is a **classic higher-timeframe accumulation pattern** followed by **a potential explosive bullish leg**.
After a strong move up in April, we witnessed a **textbook V-reversal**, consolidation, and now — **a higher low** forming around the \$3,290 zone. That’s our key demand level. 💥
✅ If this higher low holds and price starts pushing with volume, we may be gearing up for a **multi-phase breakout** with the following potential targets:
🔹 **Target 1:** \$3,500
🔹 **Target 2:** \$3,694
🔹 **Target 3:** \$3,902
🎯 **Final Target:** \$4,101+
This isn’t just a short-term scalp setup. This is a **position trade opportunity** for those with patience and precision. The structure is clean, momentum is returning, and the levels are marked.
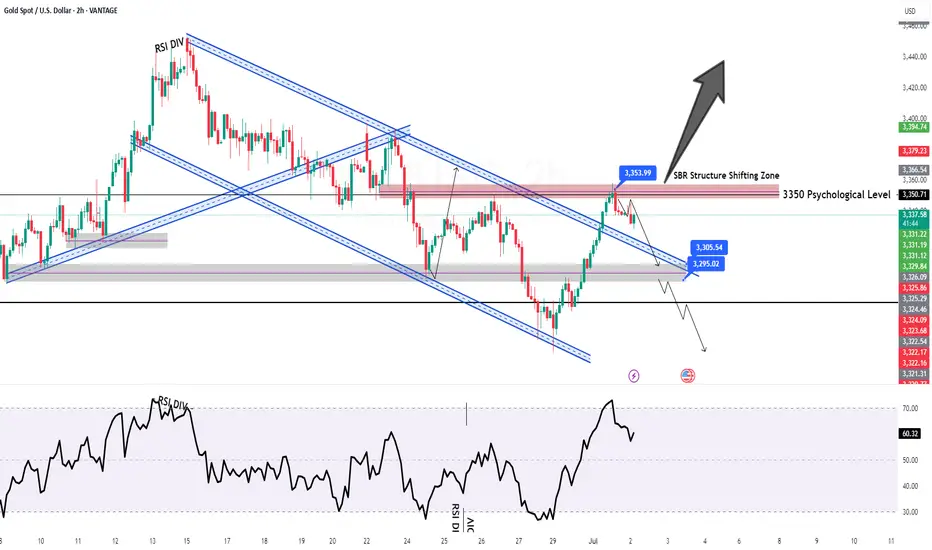
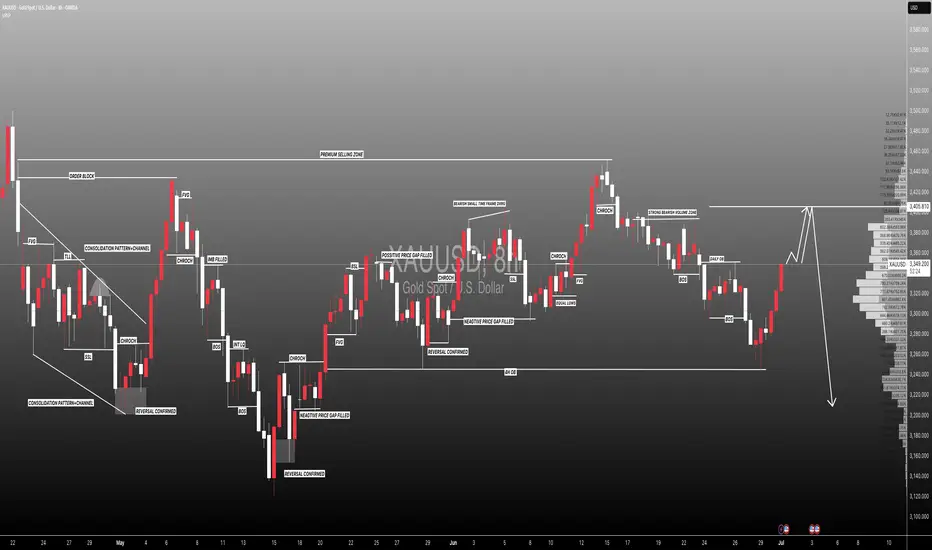
#XAUUSD:First Buy, Then Sell Swing! Big Move In Making! Gold failed to decline further as previously predicted in our analysis. Instead, it continues to exhibit bullish sentiment. The current price trading in a critical region between 3350 and 3360, where significant resistance is observed. We anticipate that the price must pass through this region before it can clearly surpass the 3400 mark.
When this occurs, it is advisable to implement precise risk management strategies while trading gold due to its volatile nature. Additionally, the DXY index is experiencing a decline and currently trading at its all-time low since 1976. This development will likely have a substantial impact on the gold price.
We wish you the best of luck and ensure safe trading practices.
Kindly consider liking, commenting, and sharing this idea.
Team Setupsfx_
❤️🚀
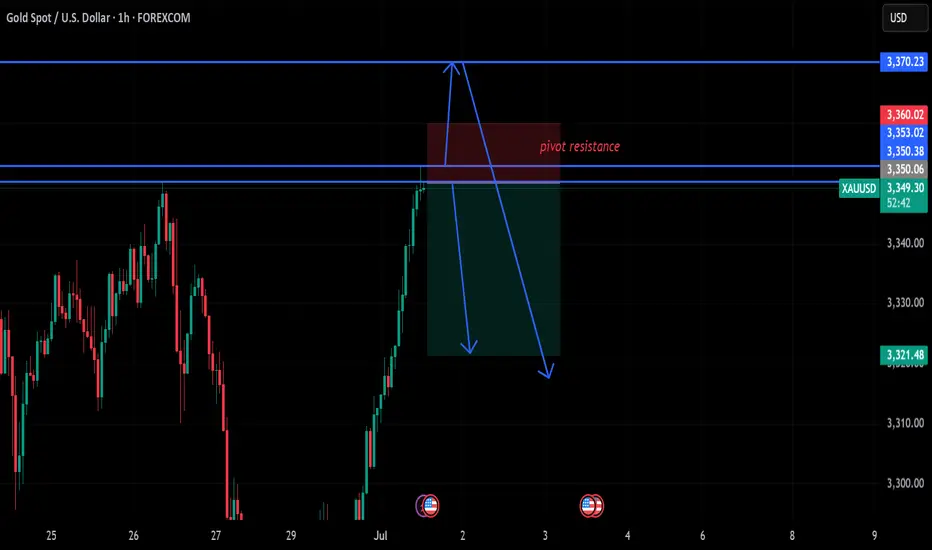
gold on sell retest#XAUUSD price have retest 3350 which have short bearish retest, fundamental is possible to change market direction.
Sell limit 3350, target 3336-21, stop loss 3360.
2 times breakout above 3353 today high will continue bullish till 3370 bearish retracment.
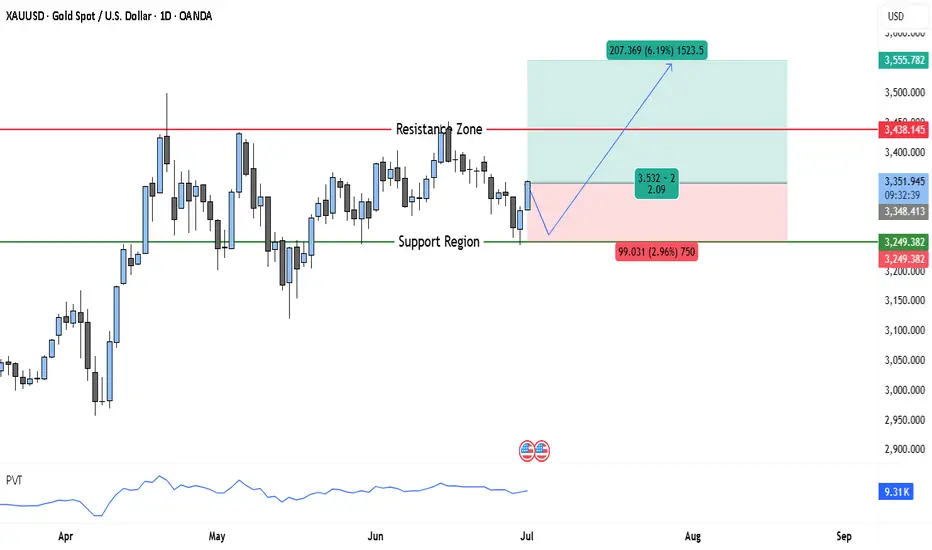
Gold Bulls Ready to Charge: $3,500 Target Could Be Days AwayThe chart shows a strong medium-term uptrend in gold that began in late 2024, carrying the price steadily higher through the first half of 2025. After peaking, price has been consolidating in a clear range bounded by a well-defined resistance and support zone.
The Resistance Zone is marked around $3,438, where price has been repeatedly rejected. Each time the market approached this level, sellers stepped in, causing retracements. This reinforces the area as a significant supply zone.
Below, the Support Region near $3,249–$3,250 has provided a floor for price action. It’s notable that this area was once a resistance, making it a classic breakout-retest structure. Buyers have stepped in multiple times to defend this level, indicating healthy demand that aligns with the broader bullish trend.
The recent candles suggest the market is trying to build momentum for another test of the resistance. Wick rejections near support indicate that buyers are showing interest again. At the same time, the overall structure remains constructive, with higher highs and higher lows visible on the longer timeframe.
The Price-Volume Trend (PVT) indicator along the bottom is gradually climbing, which suggests accumulation is still happening beneath the surface. This can be a signal that a fresh breakout attempt is brewing.
Trade Setup
Here’s how the trade idea is structured visually on your chart:
• Entry Zone: Around $3,348, near the midrange and just above support.
• Stop-Loss: ~99 points below the support area (around $3,249), offering a cushion against volatility.
• Target: Approximately $3,555–$3,560, the next major resistance above the current consolidation.
• Reward Potential: ~207 points (6.19%) upside.
• Risk-Reward Ratio: ~2.09, which is a favorable setup for a trend continuation trade.
Analysis Summary
This is effectively a range-bound bullish continuation setup. The idea is to enter on support retest and ride the next impulse leg higher. Price is consolidating above the former breakout area, with clear evidence of accumulation on the PVT. If gold can close convincingly above $3,438, it will likely trigger breakout buying interest and stop-loss clusters from short sellers, which could drive price rapidly toward your target.
However, keep in mind that failure to hold above $3,249 support would invalidate the setup and could lead to a deeper correction or range breakdown. For this reason, your stop-loss level is well-placed to limit risk.
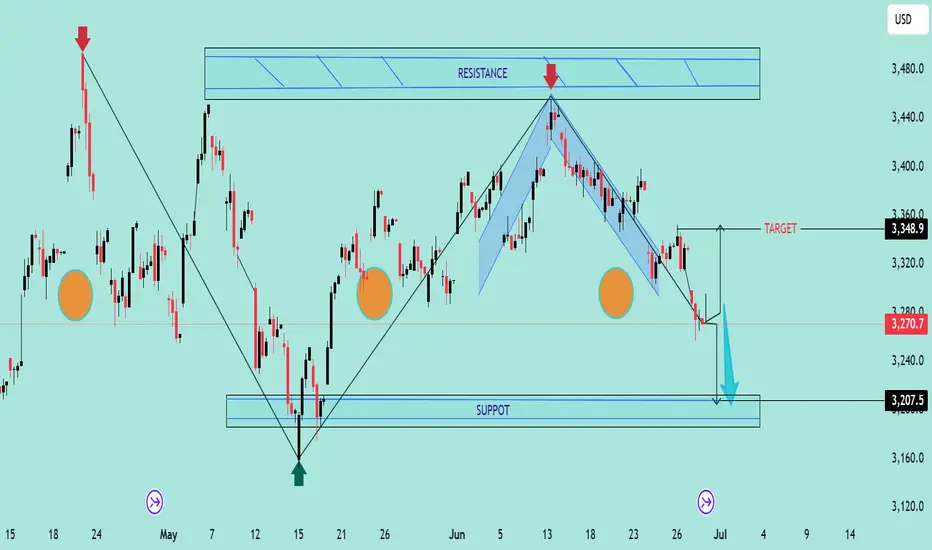
Double Top Breakdown at Resistance ZoneThe chart reveals a classic Double Top pattern formation near the 3,360–3,480 resistance zone, followed by a clear bearish rejection (highlighted with red arrows). This confirms the presence of strong supply pressure in that region.
🔍 Key Technical Highlights:
🔺 Double Top Pattern
The price formed two swing highs near the resistance zone, failing to break above.
After the second peak, the price started declining, confirming the reversal pattern.
📉 Bearish Channel
The recent downtrend is contained within a descending channel, with consistent lower highs and lower lows.
Price broke below the neckline of the double top pattern around 3,270.
🎯 Target Projection
Based on the height of the double top pattern, the projected downside target is near 3,207.5, aligning perfectly with the support zone marked below.
🟠 Historical Support Areas
The large orange circles indicate key reaction points, confirming that the 3,207–3,220 area has acted as support in the past.
📊 Outlook:
If the current bearish momentum continues, price is likely to head towards the support target zone at 3,207.5. Any pullback toward 3,320–3,350 could provide a shorting opportunity with stops above the recent highs.
🔧 Bias: Bearish
📍 Resistance: 3,360–3,480
📍 Support: 3,207–3,220
📍 Target: 3,207.5
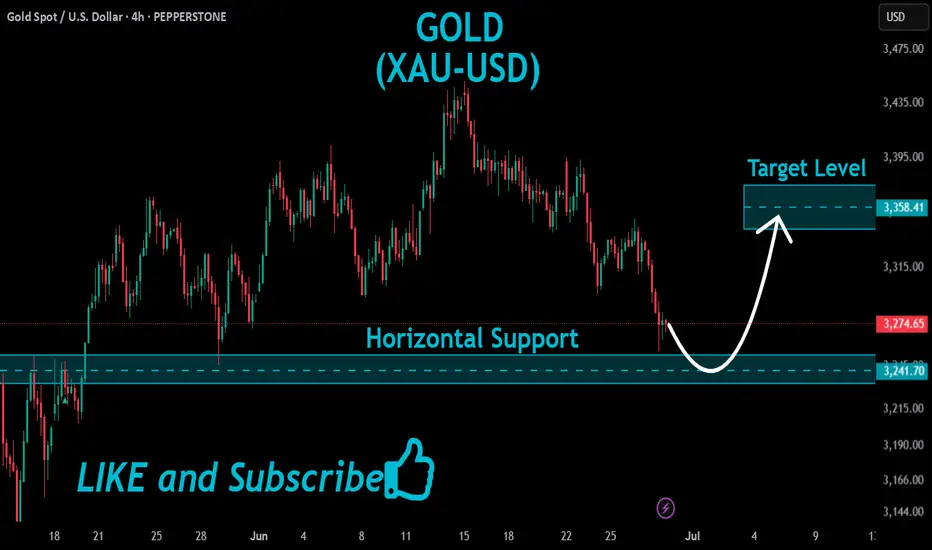
GOLD Support Ahead
HI,Traders !
#GOLD is going down
Now but the pair will soon
Hit a horizontal support
Of 3241.70 from where
We will be expecting a
Local bullish rebound !
Comment and subscribe to help us grow !
The bull market is too fierce. How to solve the short position?📰 News information:
1. Geopolitical situation
2. PMI data
📈 Technical Analysis:
The conflict between Iran and Israel has stopped for a while, but there is a possibility of it breaking out again. There is a possibility of triggering risk aversion in the short term. From a technical perspective, the 4H MACD indicator shows a golden cross, and the moving average and other indicators are also radiating upward, with a strong bullish signal. The 1H chart Bollinger Bands open upward, and the short-term pressure position is at 3340-3345. The short-term data indicators are seriously overbought, and there may be a profit correction in the short term. Therefore, if you want to short in the short term, you can only consider the 3340-3350 range. In the short term, gold will not usher in a large retracement, and the short-term target is only suitable for looking at 3320-3310. As for the long trading point, it is expected to wait for the European and American trading hours.
🎯 Trading Points:
SELL 3340-3350
TP 3320-3310
BUY 3325-3315
TP 3335-3340-3350
In addition to investment, life also includes poetry, distant places, and Allen. Facing the market is actually facing yourself, correcting your shortcomings, confronting your mistakes, and strictly disciplining yourself. I hope my analysis can help you🌐.
TVC:GOLD OANDA:XAUUSD FOREXCOM:XAUUSD PEPPERSTONE:XAUUSD FXOPEN:XAUUSD FX:XAUUSD