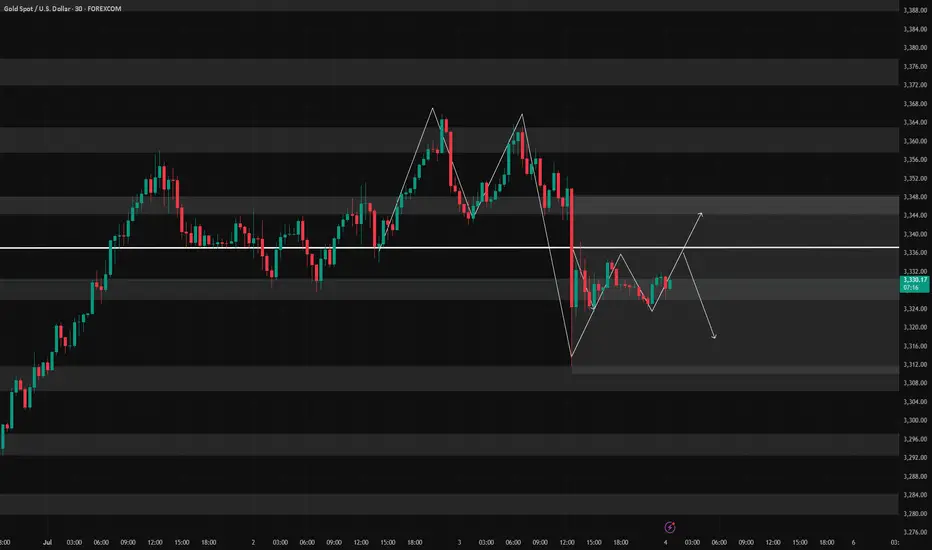
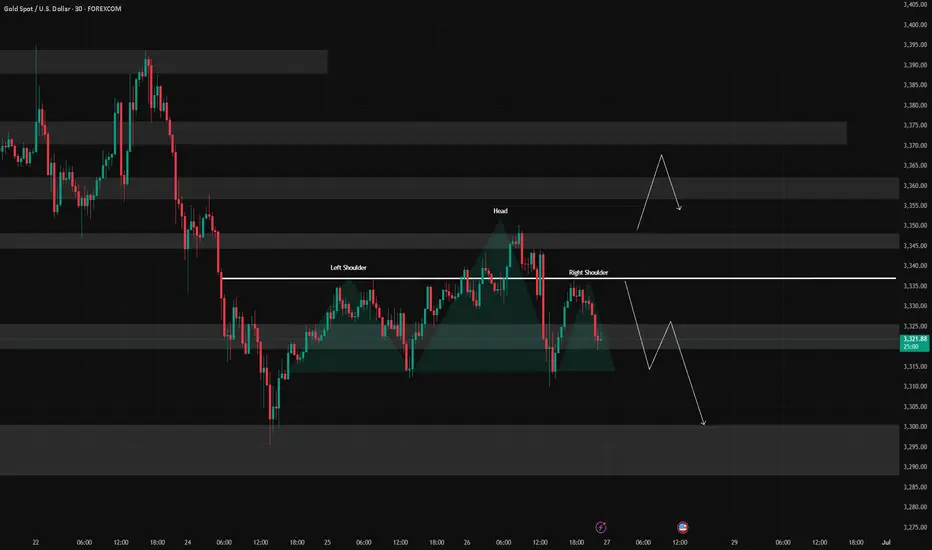
7/4: Trade Within the 3313–3346 RangeGood morning, everyone!
Yesterday’s intraday trades delivered solid profits. Since the U.S. market will be closed today, news-driven volatility is expected to be limited. Therefore, today’s trading focus will primarily revolve around technical setups.
Current structure:
Key support: 3321–3316
Immediate resistance: 3337–3342, followed by 3360
If support holds and resistance breaks, a potential inverse head-and-shoulders pattern may form on the 4H chart, with the next target near 3380
If support breaks, focus shifts to the 3303–3289 support zone
Given the likelihood of range-bound price action today, the suggested intraday range is 3313–3346, with a preference for selling near resistance and buying near support.
If an upside breakout occurs, consider using the MA20 on the 30-minute chart as a guide for pullback entries.
Xauusdsell
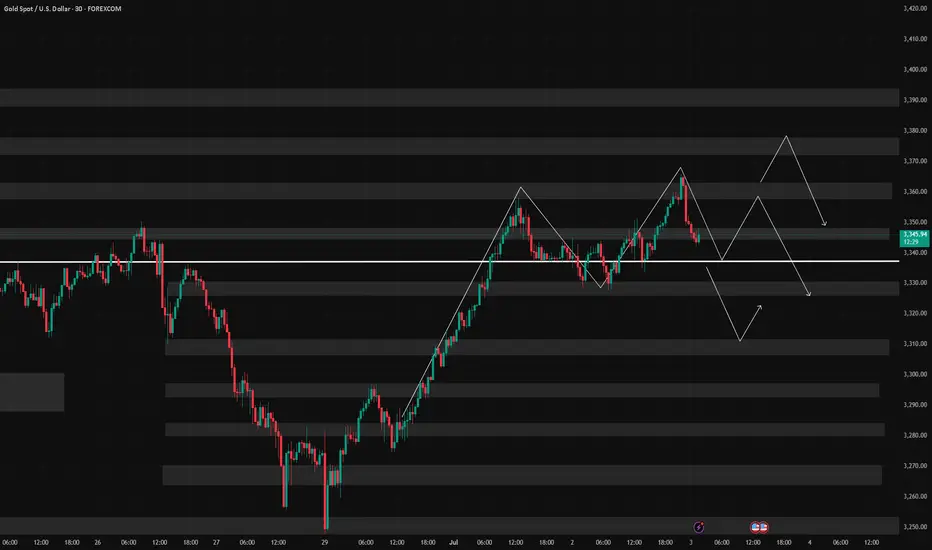
7/3: Focus on Short Positions, Watch Support Near 3320Good morning, everyone!
Yesterday, gold tested support near 3328 but failed to break below it effectively. The price then rebounded toward the 3350 level. At today’s open, gold briefly extended to around 3365 before pulling back.
Technically:
On the daily (1D) chart, the price remains capped by the MA20, with no confirmed breakout yet.
Support levels below are relatively dense, and moving averages are increasingly converging, suggesting a breakout in either direction is approaching.
Key intraday support lies in the 3321–3316 zone.
On the 2-hour chart, we are seeing the first signs of a bearish divergence, indicating a need for technical correction. Much like Tuesday’s setup, there are two possible scenarios:
If 3342–3334 holds, the price may extend slightly higher, intensifying divergence before pulling back;
If 3337 breaks, we could see a drop toward 3320, where correction would occur through a direct decline.
From a fundamental perspective, several high-impact U.S. data releases are scheduled for the New York session, which may increase volatility and make trading more challenging.
Trading suggestion:
For most traders, the safest approach is to wait for data to be released, then look for oversold rebounds or overbought corrections following sharp market reactions.
This style requires patience and strong risk control—avoid being overly aggressive or greedy, as such behavior can easily lead to trapped positions or even liquidation.
GOLD H2 Intraday Chart Update For 3 July 2025Hello Traders,
Main event of is day NFP and all eyes on 3400 Psychological for now, right now market sustains around 3350 Psychological level for downward move GOLD still need to break 3324 level in order to go further down above 3324 LEVEL GOLD is still remains Bullish
Remember: It's NFP day
Disclaimer: Forex is Risky

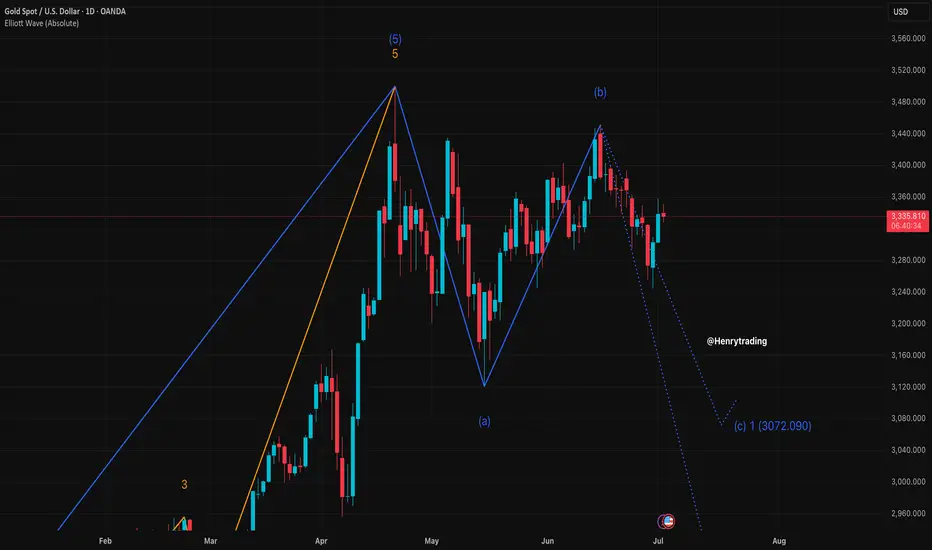
#XAUUSD: +2000 Swing Sell In Making! Get ReadyGold has dropped to the 3330 region but has now reversed and is currently trading at 3350. The next potential move could be at 3380, followed by 3400. Our sell entry is at 3400, where we believe the price will reverse. Our long-term view is that gold will head towards 3100, but our first target will be 3200. Please use accurate risk management when trading gold, as it can cause serious financial issues if not planned properly. This analysis does not guarantee any price movement.
Good luck and trade safely!
Team Setupsfx!
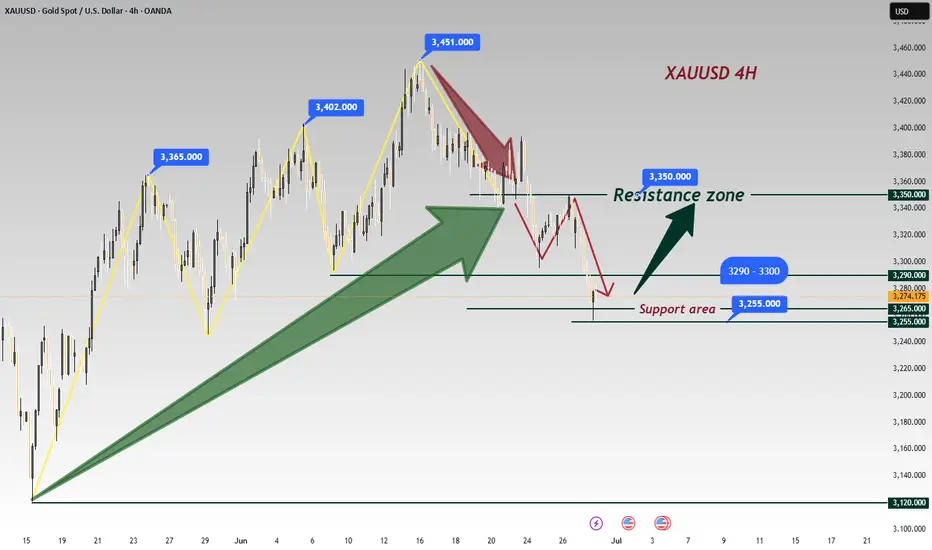
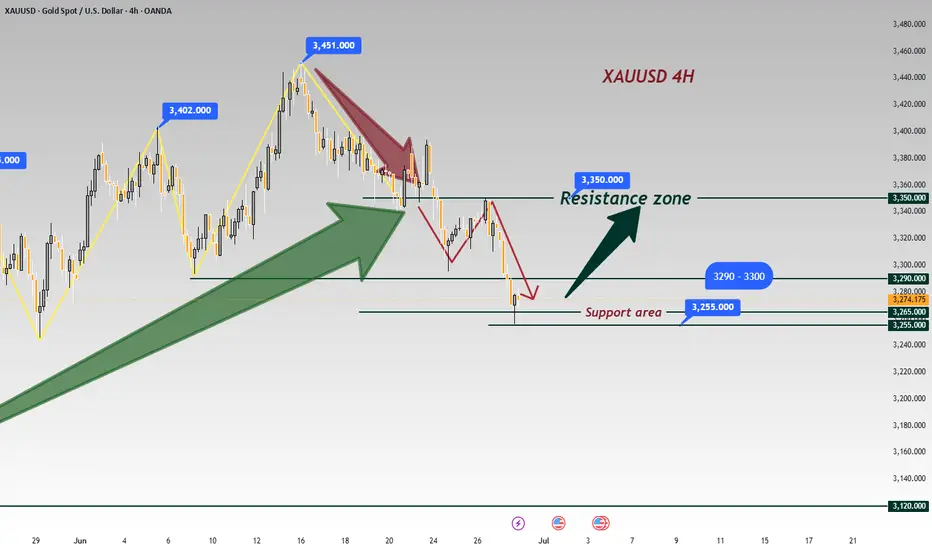
XAUUSD Analysis – July 2–3, 2025: Resistance Holds Gold is currently trading around 3,337 USD, having tested the 3,350 USD resistance zone without a successful breakout. The price remains under pressure from key macroeconomic factors:
- The Dollar Index (DXY) is stable above 106 – a sign of continued demand for the greenback, which weakens gold.
- U.S. 10-year Treasury yields hold around 4.35%, reinforcing the view that the Fed will keep interest rates high.
- The Core PCE report for June remains above the Fed’s 2% inflation target, decreasing expectations of a rate cut in Q3.
- Safe-haven demand is weak, as geopolitical tension in the Middle East and Eastern Europe remains subdued.
➡ Overall, these factors confirm that XAUUSD remains under bearish pressure in both the short and medium term, especially while key resistance remains intact.
1. Technical Analysis – XAUUSD on D1 Chart
- Price recently tested the 3,340 – 3,350 USD resistance zone, a confluence of:
Previous supply zone
- Fibonacci retracement 0.5–0.618 from 3,399 USD
- Key Change of Character (CHoCH) level
- RSI is forming a mild bearish divergence, signaling weakening bullish momentum.
- EMA20 and EMA50 are both sloping downward – confirming the prevailing bearish trend.
This setup is typical of a Sell on Rally pattern, with each retracement being rejected at strong resistance.
2. Key Technical Zones to Watch
Technical Role
- 3,350 – 3,340 Major resistance (Fibo 0.5–0.618 + supply + CHoCH)
- 3,294 – 3,285 Nearest support – previously a resistance-turned-support
- 3,255 – 3,235 Short-term target zone – June low
- 3,223 – 3,205 Strong medium-term support – April low + extended Fibo
3. Suggested Trade Setup
Preferred Scenario: SELL below 3,350
Entry: 3,345 – 3,347
Stop Loss: 3,351
Take Profit 1: 3,335
Take Profit 2: 3,330
Take Profit 3: 3,320
Ps : XAUUSD is retesting a major resistance zone without macro or technical catalysts for a sustained breakout. The best approach remains to sell at resistance and take profit near support, in alignment with the ongoing bearish trend.
The strategy will be updated regularly – don’t forget to save and follow to stay ahead of market opportunities.
The analysis was provided by @Henrybillion
7/2 Trapped Orders from Yesterday Turned ProfitableGood morning, everyone!
Yesterday’s early-entry gold short position encountered some temporary drawdown, but thanks to flexible adjustments, the trade has now moved into profit overall.
Currently, the price is hovering near a key support area. Based on the 1H and 2H charts, there is still room for further downside. At this point, there are two strategic options:
Close the position to lock in current profits;
Hold the position and wait for further decline, keeping in mind that if support holds, the price may rebound back toward the 3350 level, introducing some risk.
You can decide whether to stay in the trade or exit, depending on your risk tolerance and trading plan.
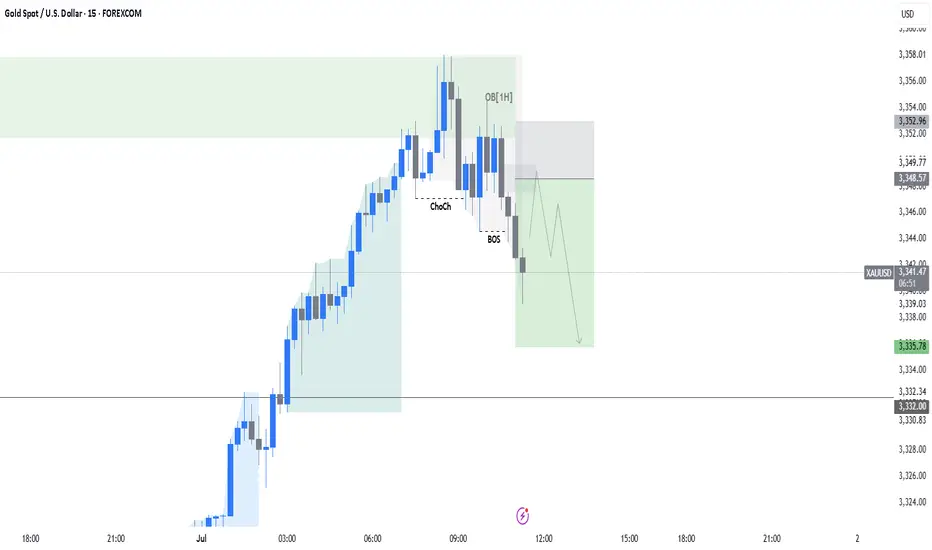
XAU/USD : GOLD AnalysisGold now shifts its direction downward as it was rejected from an hourly Order Block.
I am planning a short position in it, you guys can trade accordingly by managing your risk
#XAUUSD:First Buy, Then Sell Swing! Big Move In Making! Gold failed to decline further as previously predicted in our analysis. Instead, it continues to exhibit bullish sentiment. The current price trading in a critical region between 3350 and 3360, where significant resistance is observed. We anticipate that the price must pass through this region before it can clearly surpass the 3400 mark.
When this occurs, it is advisable to implement precise risk management strategies while trading gold due to its volatile nature. Additionally, the DXY index is experiencing a decline and currently trading at its all-time low since 1976. This development will likely have a substantial impact on the gold price.
We wish you the best of luck and ensure safe trading practices.
Kindly consider liking, commenting, and sharing this idea.
Team Setupsfx_
❤️🚀
#XAUUSD(GOLD)): 29/06/2025 Last Analysis Going Great!Gold has been moving nicely since our last analysis, which we posted. Currently, 750+ pips have been generated, and we expect further price drops. There are still two targets in place, as per our previous analysis. We anticipate a steady decline in the price. We recommend all of you to follow strict risk management. This is not a guaranteed analysis or view, but rather an overview/educational chart analysis.
If you want to support us, you can do the following:
- Like
- Comment
- Share
Team Setupsfx_
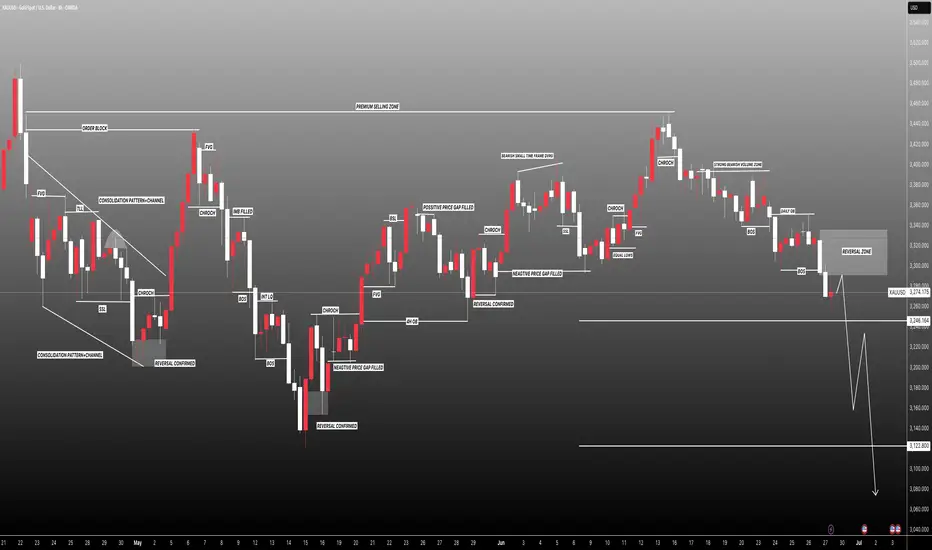
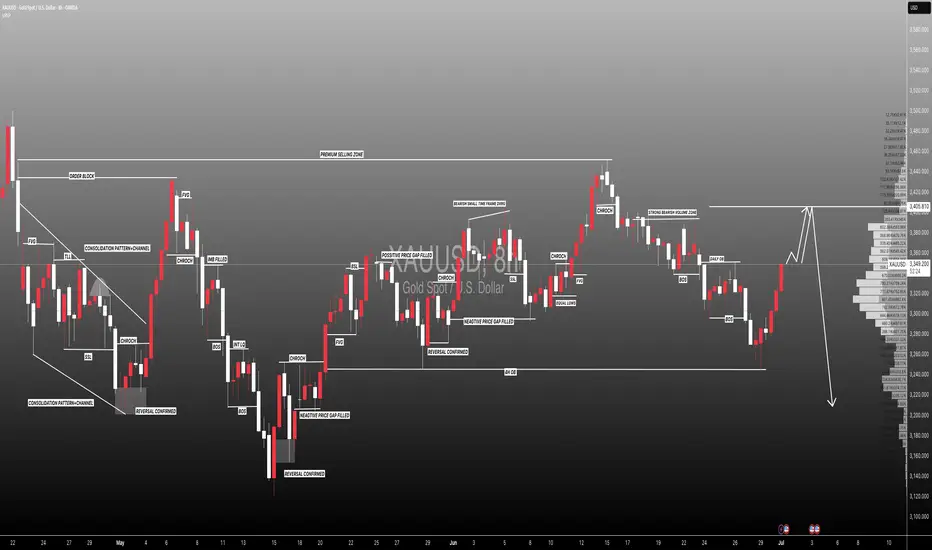
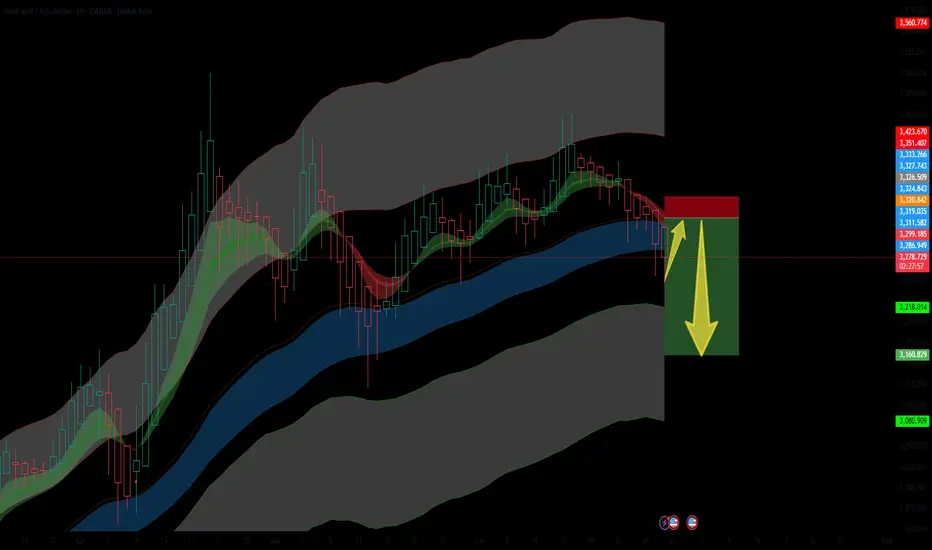
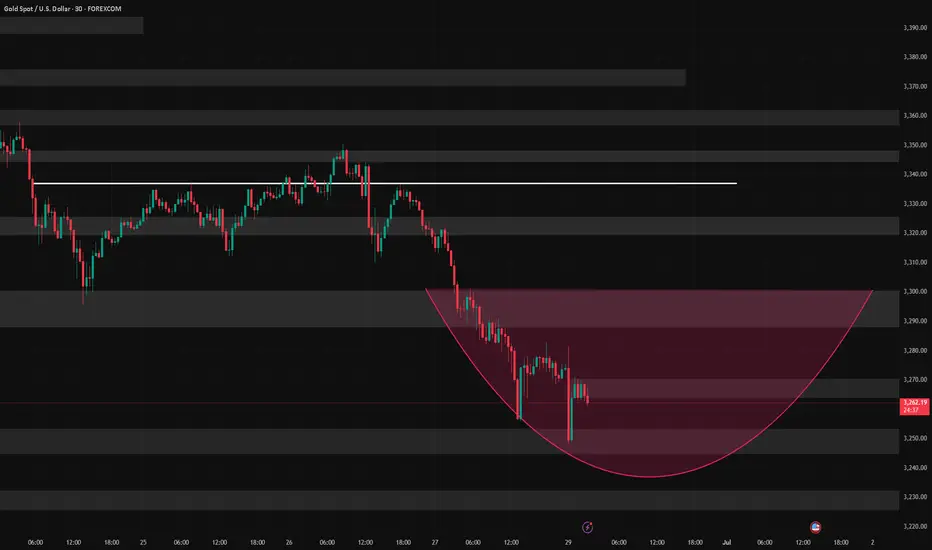
Bearish Setup for GoldGold is currently in a retracement phase after breaking below the mid Keltner channel zone. The small upward arrow marks this temporary relief rally, which I anticipate will be short-lived.
Price is testing the lower band of the inner Keltner channel after rejecting from the upper zones. The structure suggests a classic lower high formation before a potential major sell-off, targeting the deeper liquidity zones around $3,218 – $3,160 and possibly $3,080 if momentum accelerates.
📉 Bias: Bearish
📌 Invalidation: A clean break and close above the red resistance block (~$3,320+)
📌 Target Zones: $3,218 → $3,160 → $3,080
🔔 Look for volume drop and wick exhaustion confirming the next leg down.
This retracement may offer one final short entry opportunity before a deeper correction unfolds.
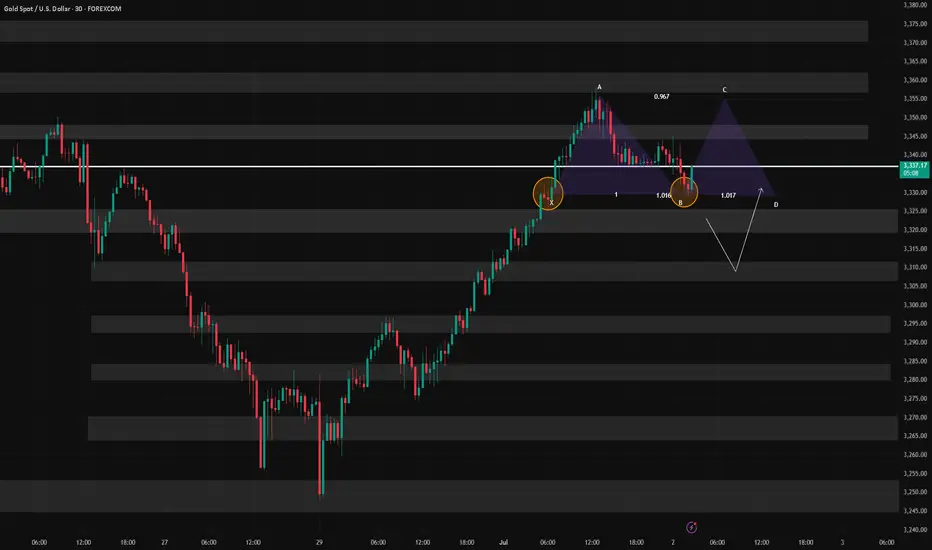
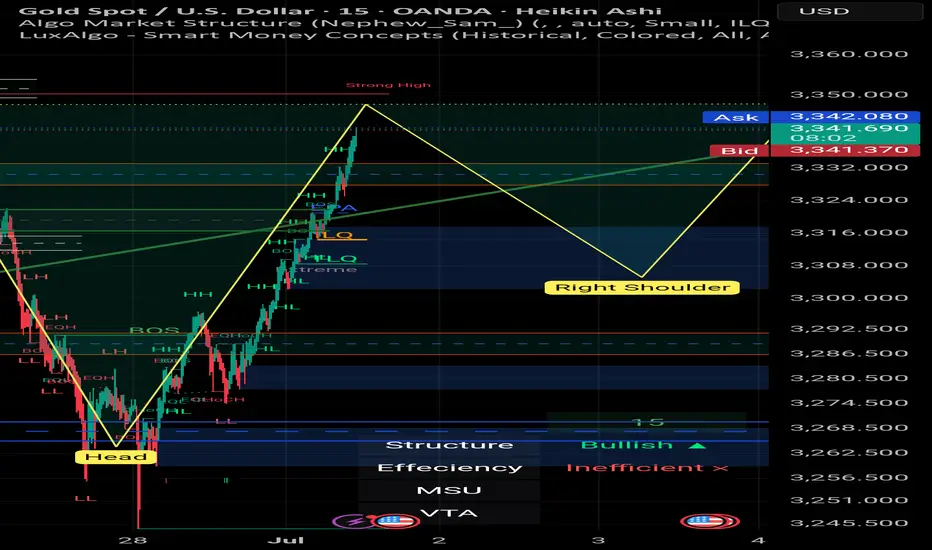
Below of last update of reverse head and shoulder post XAU/USD | 30min | by Mohsen Mozafari Nejad
🔸 **Instrument:** Gold / USD (XAU/USD)
🔸 **Timeframe:** 30min
🔸 **Methodology:** Smart Money Concepts (SMC) + Liquidity + OB + Market Structure
🔸 **Focus:** New Monthly Open Setup
🔍 Market Context:
---
## 🧠 Technical Breakdown:
1. **Strong recovery** after clearing deep liquidity sweep (Head zone)
2. **Bullish BOS** structure confirmed on LTF → Multiple HH and HL formed
3. Price now testing **Key Supply/OB zone at 3300–3315**
4. Above this zone lies a **Strong High (SH) around 3,350**, a potential liquidity magnet
5. Overall bias is bullish unless strong rejection appears from upper OB
---
## 📌 Trade Plan:
| Position | Entry Confirmation Zone | Stop Loss (SL) | Take Profit (TP) |
|----------|--------------------------|----------------|------------------|
|
| Short (scalp only) | Bearish reaction from 3,345–3,350 | Above 3,353 | TP1: 3,310 / TP2: 3,290 |
---
## ⚠️ Risk Factors to Watch:
- 🔺 High-impact USD news (July 1st releases: Manufacturing PMI / employment preview)
- 🔺 Overextension above supply zone without support → trap risk
- 🔺 Bull trap risk if price spikes above 3,340 then sharply reverses
---
## ✅ Summary:
> **Start of July** could fuel volatility and directional momentum.
> The structure is clearly bullish short-term, but upper liquidity zones remain **highly reactive**.
> Smart traders will wait for reaction at the 3,340–3,350 SH zone before overcommitting.
**Structure:** 🔴 bearish momentum
**Efficiency:** ✅ Clean
**Liquidity:** 🔺 Above SH & Below recent HL
📊 Prepared by: **Mohsen Mozafari Nejad**
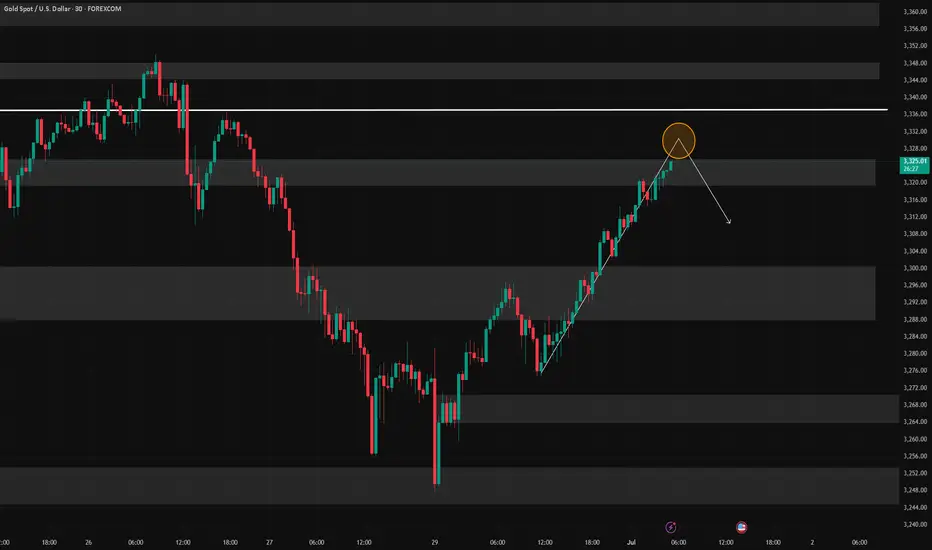
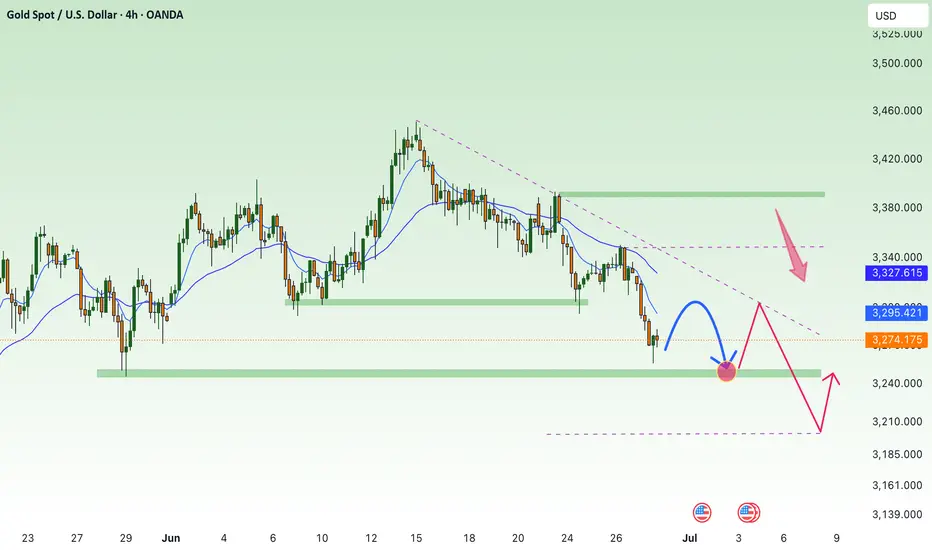
7/1 Gold Analysis and PMI Data Trading StrategyGood afternoon, everyone!
Gold has now entered a resistance zone, and on the 30-minute chart, a technical correction appears likely. This correction typically takes one of two forms:
A direct pullback from current levels;
A minor upward push before the pullback, intensifying the need for correction.
In most cases, the second scenario doesn’t result in a large move—unless it’s accompanied by strong news. Given this setup, today’s trading idea is to:
Start with a small short position near current resistance;
Add to the position if price pushes slightly higher, and patiently wait for a pullback. This strategy has shown over 80% historical success rate.
Key support levels to watch:
If the price rises before pulling back: 3321–3316
If the price drops directly: 3313–3306
On the 4-hour chart, the rebound is not yet complete, so if the pullback finds solid support, there’s still room for buy-side setups in line with the short-term trend.
⚠️ Important: U.S. PMI data will be released during the New York session. Strategy depends on pre-release price positioning:
If price remains below 3312, and the data is bullish → look for long setups.
If price is above 3323, wait for a post-data rally to sell into.
If the data is bearish → consider selling immediately.
Stay flexible, manage your positions wisely, and trade with discipline ahead of the U.S. session.
Gold Is Set to Bottom Out and Rebound This WeekGood morning, everyone!
At today’s open, gold once again dipped into the 3258–3248 buy zone, then rebounded toward 3270. From a structural perspective, gold has clearly entered a downward trend, but this decline is unlikely to be one-directional—short-term rebounds and consolidations are expected along the way.
Based on my experience, below 3250 remains a favorable area for initiating long positions. Whether the price rebounds directly or continues lower before building a stronger base to challenge 3300 again, the broader outlook remains bullish as long as the 3200 support holds. A bottoming reversal this week is still the more probable scenario.
As such, the focus early this week should be on buying near the lows, with short opportunities on rebounds as a secondary strategy. Monitor key support levels for signs of strength.
This week is also packed with important data—including PMI, Non-Farm Payrolls (NFP), and the unemployment rate, in addition to regular economic releases. Given the current macroeconomic backdrop, significant market volatility is expected—bringing both risk and opportunity. Manage your exposure carefully and stay adaptable.
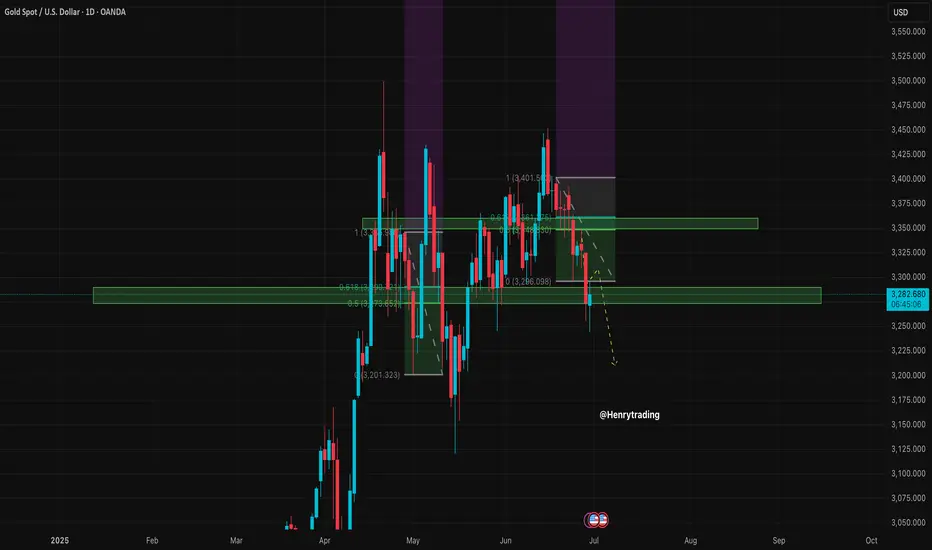
XAUUSD – June 30, 2025: Trade Strategy Right Now – Focus on SellGold OANDA:XAUUSD has been recovering slightly toward the 3,282 USD zone, but macroeconomic headwinds remain strong:
- The U.S. Dollar Index (DXY) TVC:DXY remains above 106.3 – the highest level in a month – making gold less attractive due to increased opportunity cost.
- U.S. 10-year Treasury yields remain firm around 4.35%, reflecting market expectations that the Fed will maintain tight monetary policy.
- Core PCE data for June remains elevated, far from the Fed's 2% target – lowering the likelihood of a rate cut anytime soon.
- Geopolitical tensions are cooling off, reducing demand for safe-haven assets like gold.
➡ These macro factors suggest that the current rebound in gold is more technical than fundamental, and unlikely to signal a major trend reversal.
1. Technical Analysis – XAUUSD OANDA:XAUUSD on D1 Timeframe
- After bouncing from 3,255 USD, price is now testing the 3,285 – 3,295 USD resistance zone.
- This is a Fibonacci retracement zone (0.5 – 0.618) from the previous bearish leg 3,314 → 3,255.
- EMA20 and EMA50 remain downward-sloping, signaling that the dominant trend is still bearish.
- RSI is hovering around 52, suggesting mild momentum but not enough for a confirmed bullish reversal.
➡ The current price behavior aligns with a pullback within a downtrend, with potential for continuation to the downside.
2. Trade Setup – Short-Term Sell Strategy
Primary Setup: Sell the Rally
Entry: Sell near 3,294 – 3,295
Stop Loss: 3,300
Take Profit 1: 3,260
Take Profit 2: 3,244
Take Profit 3: 3,225
Ps: Gold OANDA:XAUUSD is showing signs of a technical bounce, but fundamentals and structure still support the downtrend. Selling at resistance remains the preferred strategy as long as macro pressure persists.
The strategy will be updated continuously – don't forget to save and follow to avoid missing key opportunities.
Analysis by @Henrybillion
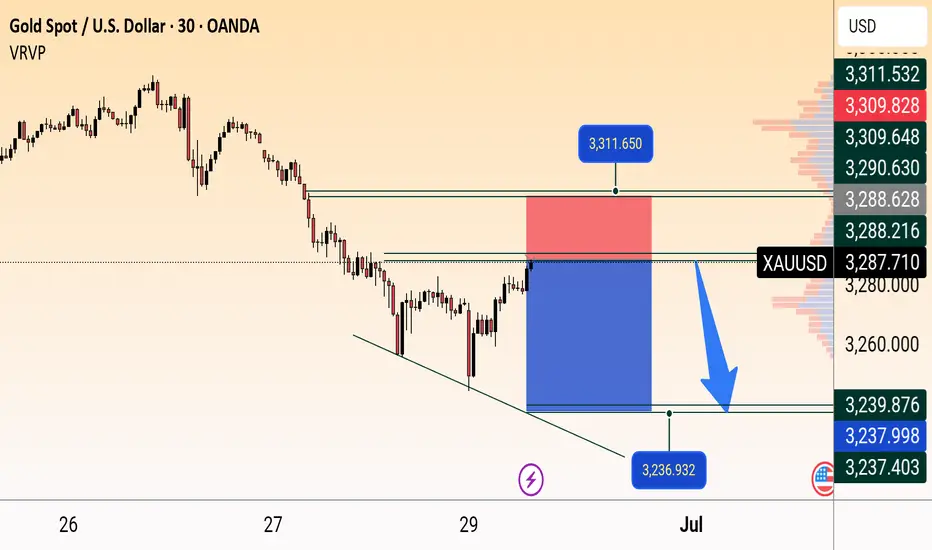
XAU/USD Bearish Rejection Setup Below Resistance ZoneXAU/USD (Gold) is forming a bearish setup on the 30-minute chart. Price is testing a resistance near 3288, with a potential reversal towards the 3236 level. Entry is marked around current price, with a stop loss at 3311 and take profit near 3237, supported by a descending channel.
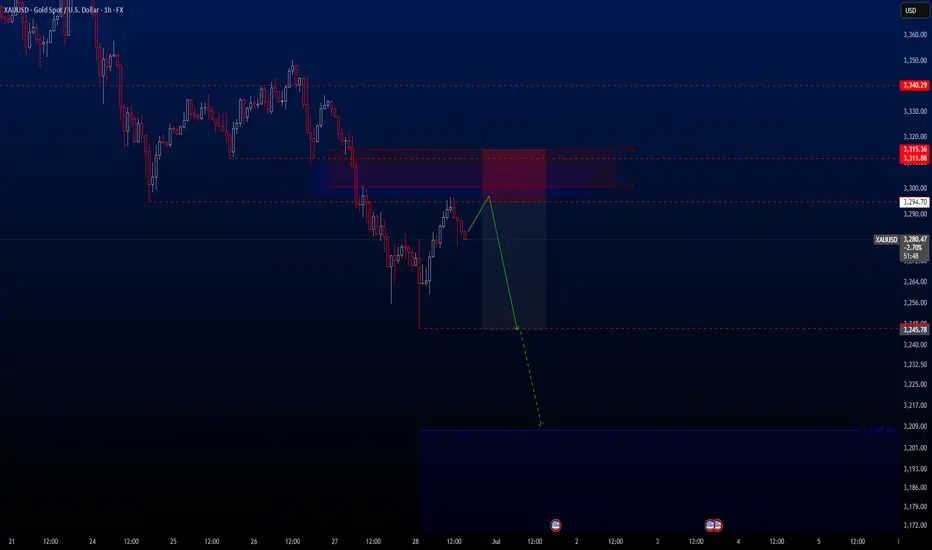
XAUUSD Hello traders. There’s currently a great opportunity for a potential short setup on the XAUUSD pair. We just need a bit of patience. For that reason, this trade will be placed as a Sell Limit.
In the coming days, I expect a moderate pullback in gold. Meanwhile, the S&P 500 has reached a new all-time high, which is quite notable. If the index begins to correct from these levels, we could potentially see a strong rally in gold. Of course, this is just my personal opinion based on current market dynamics.
🔍 Trade Details
✔️ Timeframe: 1-Hour (H1)
✔️ Risk-to-Reward Ratio: 1:3.20
✔️ Trade Direction: Sell Limit
✔️ Entry Price: 3294.70
✔️ Take Profit Targets: 3245.78 / 3207.00 / 3154.00
✔️ Stop Loss: 3315.36
🕒 If momentum weakens or price consolidates in a tight range, I will keep this trade open only until 23:00 (UTC+4). After that, I’ll manually close it—whether in profit or loss—based on how price action evolves.
🔔 Disclaimer: This is not financial advice. I’m simply sharing a trade I’ve taken based on my personal trading system, strictly for educational and illustrative purposes.
📌 Interested in a systematic, data-driven trading approach?
💡 Follow the page and turn on notifications to stay updated on future trade setups and advanced market insights.
XAUUSD Under Pressure: What the Market Is Telling UsGold (XAUUSD) is currently trading with a clear bearish bias, showing sustained downside momentum on the 4H timeframe 🕒. Price has been gradually stepping lower, and the structure continues to favor the sellers.
As expected for early in the week, there’s been a bit of choppy movement ⚖️, but the overall sentiment remains weak. Unless we see a strong shift or catalyst, I’ll be maintaining a bearish outlook.
🧭 I’m watching for price to revisit key resistance levels, and if we get a clean break and retest 🔄, I’ll be looking for potential short setups from areas of previous demand that flip into resistance.
🌐 Keep an eye on broader risk sentiment — if NASDAQ starts pulling back or DXY strengthens, it could fuel further downside in gold.
As always, this is not financial advice, but the detailed breakdown is available in the latest video 🎥.

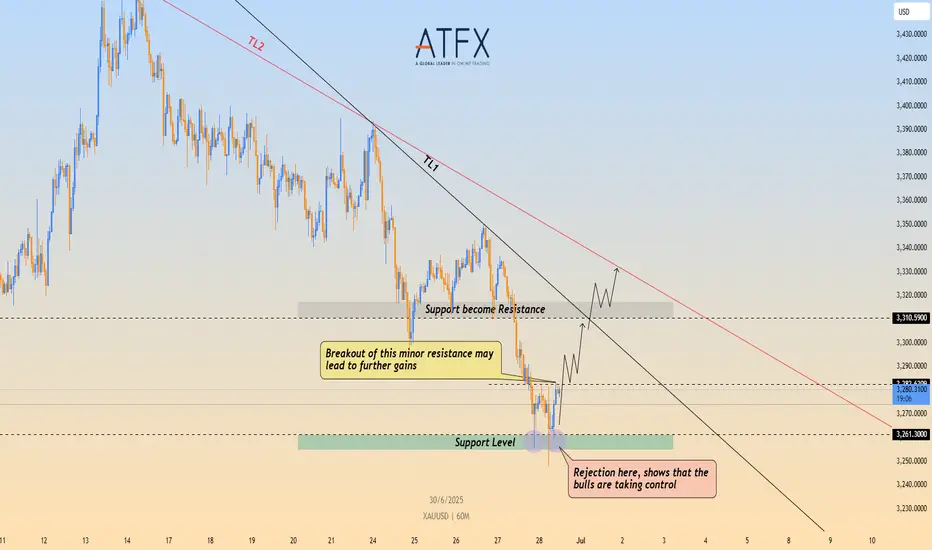
Gold Price Forecast: Bulls Defend Key Support, Eyes on TrendlineTVC:GOLD Gold (XAU/USD) bounced from the $3,261 support zone after briefly dipping to a one-month low around $3,265 in early Asian trade. The rebound came as buyers stepped in at a major demand area, rejecting further downside and suggesting bullish intent.
Macro drivers include reduced safe-haven demand following the US-China trade agreement on rare earths and a temporary ceasefire between Israel and Iran. However, expectations of a Fed rate cut—especially after weaker US consumer spending data—could limit further losses.
Technically, OANDA:XAUUSD gold has formed a double bottom around $3,261, and price action now threatens to break above a descending trendline (TL1). A confirmed breakout above minor resistance at $3,283 may open the door toward $3,311 and potentially the upper trendline near $3,330.
Key Levels to Watch:
Support: $3,261 (defended), $3,250 (monthly low)
Resistance: $3,283 (minor), $3,311 (former support turned resistance), $3,330 (TL2 trendline)
📉 Trendlines: TL1 and TL2 still capping upside; breakout would confirm bullish shift
If bulls can maintain control above $3,283 and push through the trendline, a broader recovery could follow. However, failure to clear this zone may invite renewed selling pressure.
⚠️ Disclaimer: This analysis is for informational purposes only and does not constitute investment advice.
Gold's 3290-3300 Support : Next Week Aims for Gap-Up Retest Last week, gold opened with a gap-up on Monday 🔼, then trended downward 🔽.
⚡ Notably, the 3290-3300 support zone held firmly from Monday to Thursday, demonstrating strong resilience.
🌱 The price plunged to around 3255 on Friday but rebounded promptly.
🔥 For next week, the opening may surge toward the 3290-3300 zone, warranting close attention.
🚀 Buy@3260 - 3270
🚀 TP 3280 - 3290 -3300
Accurate signals are updated every day 📈 If you encounter any problems during trading, these signals can serve as your reliable guide 🧭 Feel free to refer to them! I sincerely hope they'll be of great help to you 🌟 👇
Next Week Aims for 3300 Break💎 Last week, gold opened gap-up on Monday 🔼 but then trended lower 🔽. However, the 3290-3300 support zone remained robust from Mon-Thu ⚡. It plunged to ~3255 on Fri before rebounding 🌱. Next week's open may surge to 3290-3300 🔥!
🚀 Sell@3260 - 3270
🚀 TP 3280 - 3290 -3300
Accurate signals are updated every day 📈 If you encounter any problems during trading, these signals can serve as your reliable guide 🧭 Feel free to refer to them! I sincerely hope they'll be of great help to you 🌟 👇
stable tariffs, gold price impact reduction✍️ NOVA hello everyone, Let's comment on gold price next week from 06/30/2025 - 07/04/2025
⭐️GOLDEN INFORMATION:
Gold prices plunged over 1.5% on Friday as risk appetite strengthened, fueled by a combination of positive geopolitical and economic developments. Easing tensions between Israel and Iran, the formal trade agreement between the United States and China, and continued efforts by Washington to strike new commercial deals with global partners lifted market sentiment—dampening demand for safe-haven assets like bullion.
At the time of writing, XAU/USD is trading at $3,274, having pulled back from an earlier high of $3,328. On Thursday, the White House confirmed the signing of a long-awaited trade pact with China, marking an official end to the protracted trade war. US Commerce Secretary Howard Lutnick also indicated that additional agreements may be finalized ahead of the July 9 deadline
⭐️Personal comments NOVA:
Information on tariff negotiations is gradually becoming stable and favorable. Information on inflation showing signs of increasing, dxy increase is also a temporary pressure causing gold price to return to the 3200 mark.
🔥 Technically:
Based on the resistance and support areas of the gold price according to the H4 frame, NOVA identifies the important key areas as follows:
Resistance: $3307, $3348, $3390
Support: $3248, $3202
🔥 NOTE:
Note: Nova wishes traders to manage their capital well
- take the number of lots that match your capital
- Takeprofit equal to 4-6% of capital account
- Stoplose equal to 2-3% of capital account
- The winner is the one who sticks with the market the longest
Gold Analysis and Trading Outlook – June 27Good morning, everyone!
Yesterday, gold encountered resistance in the 3348–3352 zone and fell back to around 3310 before rebounding toward the 3336 resistance area. Today’s session opened with renewed weakness, and so far, the overall price action has closely followed our expectations. Whether it was selling near resistance, buying after the dip, or shorting the rebound, each opportunity yielded solid profits.
Some traders have asked about my strategy’s win rate. Those who’ve followed consistently already know—the overall win rate has remained above 80%, with very few instances of error. Even in the rare case of a misjudgment, I apply specific recovery strategies to minimize risk and avoid large losses. That’s the core reason why I’m confident I can help many traders.
Technically, the daily chart still shows a bearish trend, and prices are now approaching the key 3300 support zone. While the current geopolitical uncertainty adds complexity, it doesn't prevent us from executing flexible intraday trades. In fact, range-bound markets can still be highly profitable with a disciplined approach.
Key intraday levels to watch:
Dynamic support: 3318–3313
Major support: 3300–3287
Resistance levels: 3336, 3348–3352, and 3370
Today’s trades can continue to focus on these levels, using a sell-high, buy-low strategy with flexibility.
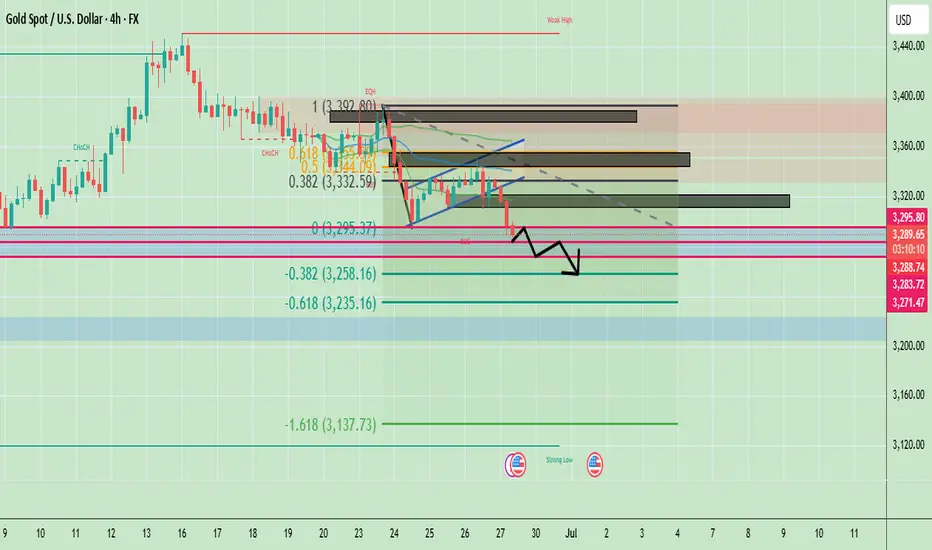
XAUUSD - Gold Bearish Bias Remains StrongXAU/USD remains under bearish pressure on the 4-hour timeframe. Until price breaks and closes above $3,336 with strength, selling the rallies remains a preferred strategy. However, watch for potential bounces near support zones, especially if momentum weakens or reversal candles appear. The price is currently trading below both the 50, 100 and 200 EMA, indicating a short-term downtrend. The recent price action has respected the trendline resistance and failed to break higher, reinforcing sellers’ control.
Price structure has formed a descending channel, which often signals a bearish continuation. However, if price finds a strong reaction from support, a temporary rebound could occur before further downside. Overall sentiment is cautious due to recent geopolitical de-escalation between Iran and Israel, which reduced gold’s safe-haven demand. Dollar strength, driven by hawkish Fed tone, continues to pressure gold.
Key Support Levels :
$3,295 – A minor support where previous candles showed buying interest.
$3,289 – Critical horizontal support and psychological level.
$3,270 – Next significant support if $3,289 breaks.
$3,240 – Major support zone, last line before larger downside moves.
Key Resistance Levels:
$3,310 – Near-term resistance and EMA zone.
$3,320 – Price rejection level from earlier 4H candles.
$3,336 – Strong resistance with previous swing highs.
Note
Please risk management in trading is a Key so use your money accordingly. If you like the idea then please like and boost. Thank you and Good Luck!