Next Week Gold Trend Forecast & Trading TipsDuring this round, the price was sold off sharply from the historical high of 3,500 to 3,120 before rebounding. After consecutive rallies, it faced pressure and fell back to 3,452 due to the fading of market risk aversion. On Friday, it rebounded from a low of 3,340. The daily chart recorded a consolidative bearish candle, with the K-line combination leaning bearish, while the 4H chart showed signs of stopping the decline.
In the short term, it is expected to consolidate below 3,400 next week. For the medium term, attention should be paid to the geopolitical crisis and the Federal Reserve's July interest rate decision. A breakthrough node will be ushered in after confirming the resistance above 3,400.
On the short-term 4-hour chart, the support below is focused around 3,340-45, and the short-term resistance above is around 3,380-85. The key focus is on the suppression at the 3,400-05 level. The overall strategy of going long on pullbacks within this range remains unchanged. For medium-term positions, it is advisable to stay on the sidelines, avoid chasing orders, and patiently wait for entry at key levels.
Investment itself is not the source of risk; it is only when investment behavior escapes rational control that risks lie in wait. In the trading process, always bear in mind that restraining impulsiveness is the primary criterion for success. I share trading signals daily, and all signals have been accurate without error for a full month. Regardless of your past profits or losses, with my assistance, you have the hope to achieve a breakthrough in your investment.
Xauusdsell
6/23 Gold Analysis and Trading ViewsGood morning, everyone!
Over the weekend, former President Trump announced and carried out an attack on Iran's nuclear facilities, triggering a renewed wave of risk-off sentiment in the markets. At today’s open, gold surged to around 3394. Driven by geopolitical tensions, the bearish technical structure has temporarily been disrupted.
Whether the bullish momentum can sustain will depend on how the situation continues to unfold.
Key technical levels to watch today:
Resistance: 3389 / 3407 / 3423 / 3432
Support: 3372 / 3365 / 3356 / 3348
Trading strategy: Given the current news-driven market, a buy-on-dip approach is preferred, with short positions as a secondary option depending on price reaction near resistance zones.
Also, pay close attention to today’s daily close (1D chart). If the price closes below 3355, it could signal profit-taking from the bulls, potentially pulling gold back into a bearish technical trend.
Geopolitical Hedging vs Monetary Policy: Gold Trading TipsGold prices continued this week's correction trend during Friday's Asian trading session, once falling near the one-week low. Although there was a slight rebound afterward, the overall trend remained in a weak adjustment pattern. This correction was mainly affected by the hawkish attitude of the Federal Reserve. At this week's policy meeting, the Fed kept interest rates unchanged, and the dot plot showed that only two rate cuts are expected by the end of 2025, while the rate cut expectations for 2026 and 2027 have been postponed. Even so, the US Dollar Index fell after hitting a weekly high, which provided some support for gold prices. In addition, growing trade concerns and escalating tensions in the Middle East have enhanced safe-haven demand, limiting the decline in gold prices.
From the 4-hour chart of gold, the current bullish momentum is dominant, and the resistance near 3375-3380 is clear. The pullback of gold prices has not broken through the upward channel for the time being, and the medium-to-long-term upward structure remains intact. If the Middle East conflict escalates or trade risks intensify, it may trigger a rebound and repair rally in gold prices. The daily chart closed in a doji star pattern, with prices retesting the middle 轨 of the Bollinger Bands, maintaining a volatile downward rhythm. The hourly chart shows significant downward characteristics, and a bearish strategy can be maintained before the resistance is broken. The resistance range is 3375-3380, and the support range is 3340-3345.
XAUUSD
sell@3070-3075
tp:3360-3350
Investment itself is not the source of risk; it is only when investment behavior escapes rational control that risks lie in wait. In the trading process, always bear in mind that restraining impulsiveness is the primary criterion for success. I share trading signals daily, and all signals have been accurate without error for a full month. Regardless of your past profits or losses, with my assistance, you have the hope to achieve a breakthrough in your investment.
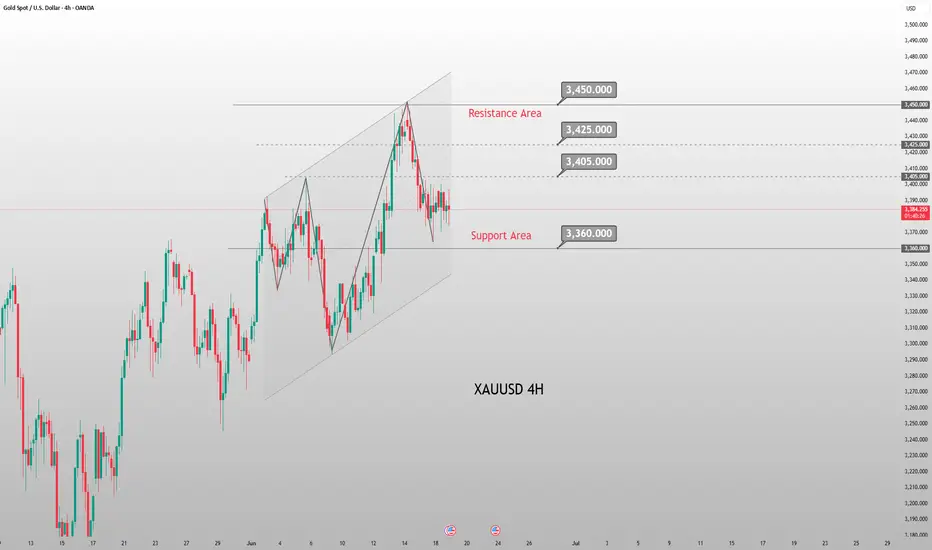
XAU/USD Bearish Pattern Analysis XAU/USD Bearish Pattern Analysis 📉
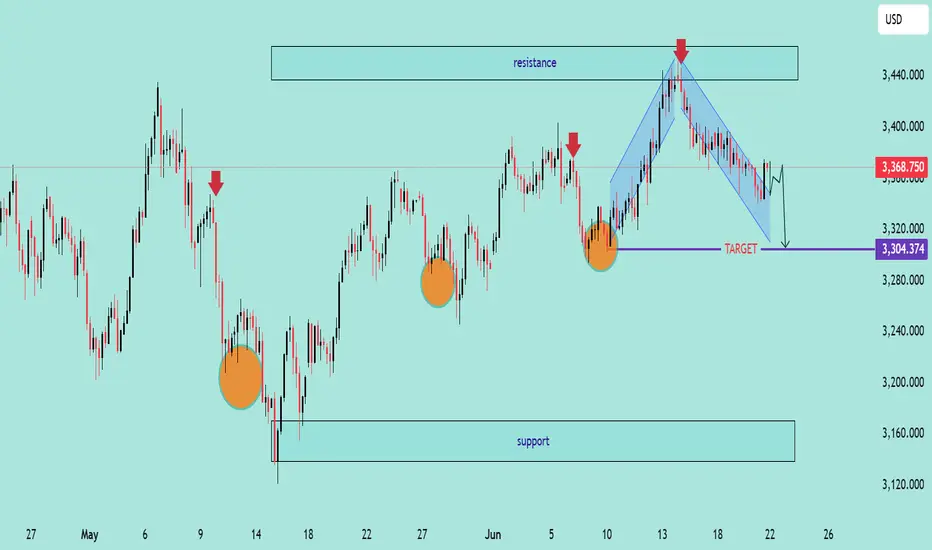
The chart presents a potential bearish continuation setup in the XAU/USD pair, highlighted by technical structures and key price levels:
📊 Technical Breakdown:
🔸 Bearish Rejection from Resistance
Price rejected strongly from the 3,440.000 resistance zone, marked with a red arrow.
This area has acted as a historical supply zone, triggering repeated reversals.
🔸 Descending Channel Formation 📉
A clear bearish flag/channel structure is visible post-rejection.
Price action broke down from the channel, signaling potential trend continuation.
🔸 Target Level 🎯
The expected target is around 3,304.374, aligning with previous support zones and structure lows.
This level coincides with a measured move from the channel breakdown.
🔸 Higher Lows Pattern Before Reversal ⭕
Prior to the current decline, the market formed a series of higher lows, highlighted with orange circles — suggesting a buildup before reversal.
🧭 Key Levels to Watch:
Resistance: 3,440.000 – 3,420.000 🔼
Current Price: 3,368.750
Short-Term Target: 3,304.374 🎯
Major Support: 3,140.000 – 3,160.000 🛡️
📌 Outlook:
The rejection from resistance coupled with the descending channel breakdown indicates bearish momentum. If the market maintains below the recent high, further downside towards 3,304 is expected. Break below this may expose deeper support zones.
📉 Bias: Bearish
⏳ Short-term Action: Watch for breakdown confirmation and momentum continuation.
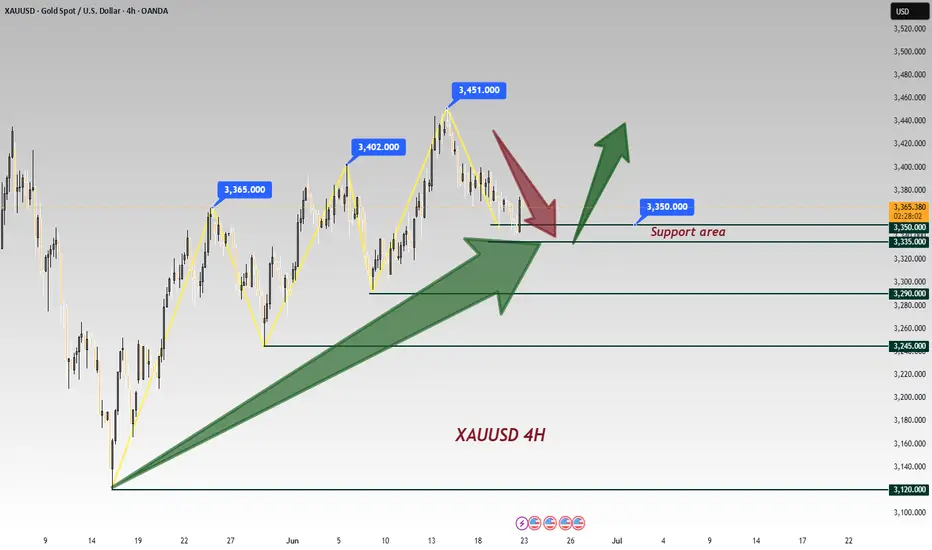
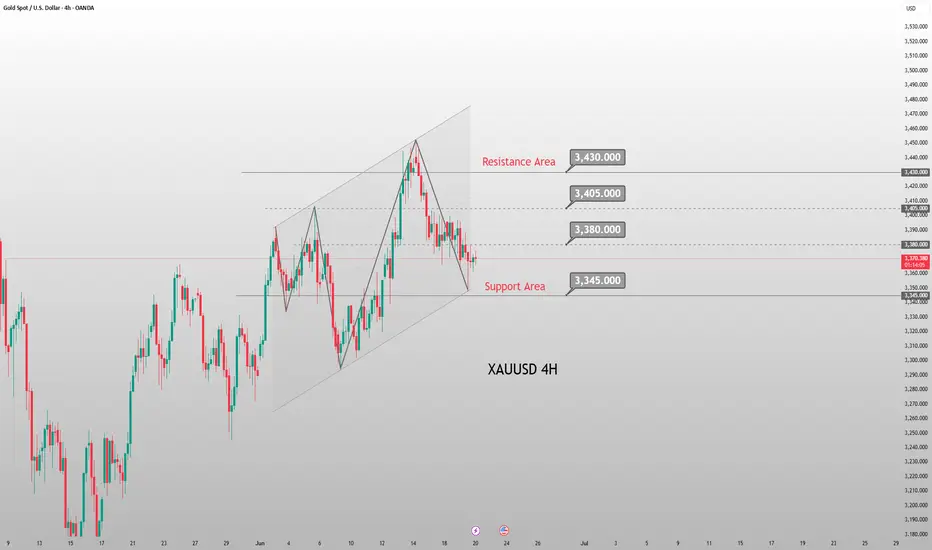
Middle East tensions rise; gold may hit new highs next weekThe Middle East situation has continued to escalate over the weekend, indicating that gold may witness a rally at Monday's opening. On Friday morning, risk aversion surged rapidly, pushing the gold price to around 3,444, followed by a pullback. During the European session, the price quickly retreated to around 3,408 before rebounding—our strategy to go long near 3,410 at the time proved profitable. In the U.S. session, gold mounted a second rally, peaking at around 3,446 before entering a pullback and consolidation phase. However, from a fundamental perspective, the overall trend remains bullish; thus, buying on dips remains the primary trading approach.
From a 4-hour technical view, immediate support lies in the 3,405–15 range, with key support at the recent resistance-turned-support zone near 3,375–80. When gold pulls back, traders should focus on longing near these levels. The critical bullish pivot for short-term traders has shifted up to the 3,345–50 zone; as long as gold holds above this level on the daily time frame, the dip-buying strategy should be maintained.
XAUUSD
buy@3405-3415
tp:3340-3360
Investment itself is not the source of risk; it is only when investment behavior escapes rational control that risks lie in wait. In the trading process, always bear in mind that restraining impulsiveness is the primary criterion for success. I share trading signals daily, and all signals have been accurate without error for a full month. Regardless of your past profits or losses, with my assistance, you have the hope to achieve a breakthrough in your investment.
XAUUSD Trading Signals: Buy Dips at 3335-3345 Amid Bear Trap💡 Trading Framework In-Depth Analysis:
The Fed's policy statement failed to stir volatility (markets had fully priced in dovish expectations 💨);
Weekly market pattern: Asian sessions consistently saw rallies 📈, followed by profit-taking pullbacks in subsequent sessions 📉;
Tactical entry logic: Use intraday highs in Asian trading as resistance references for long positions 🎯.
📊 Technical Validation & Risk Anchors
⚠️ Key Warning: Geopolitical bullish signals ignored → classic "bear trap" characteristics (bear trap 🚫);
⏳ Timing Strategy: Asian session highs form ideal resistance levels—recommend entering on pullbacks to the 38.2% Fibonacci support level 🎯.
⚡️⚡️⚡️ XAUUSD Precision Trading Signals ⚡️⚡️⚡️
🚀 Long Entry Range: 3335-3345 (stop loss can be set below 3325)
🚀 Take-Profit Target Range: 3360-3370 (partial profit-taking at first target 3360 recommended)
📢 Service Value-Added Notes
✅ Core trading signals updated daily in the morning (validated across 4-hour/daily double-timeframes);
✅ Refer to signal logic at any time during trading for sudden situations 🧭 (with historical win-rate statistics attached);
🌟 Wishing you smooth trading Next week — seize pullback opportunities to position 👇
Gold Weekly Friday Trend Analysis and Trading RecommendationsOn Thursday, gold maintained a sideways trend, currently trading near $3,370. It hit a low of $3,347 and then rebounded immediately, while yesterday's Federal Reserve interest rate decision had little impact on market volatility. Since Monday, when bearish forces were stronger than bullish ones, the gold market has been seeing equalized bullish and bearish forces, consolidating as it waits for the next stimulus direction.
Once it stabilizes above $3,400 again, there is likely to be an inflection point, and it will gradually rise to test the upper track at $3,460–3,470. At the 4-hour level, it is currently under pressure at the middle track of $3,405, with support at $3,345.
Gold may break out of the current range on Friday. Intraday trading can focus on range operations between the support of $3,345 and the resistance of $3,400: when the gold price stabilizes above $3,360, you can lightly go long, with targets sequentially at $3,375 and $3,395; if it is resisted below $3,395, you can try to lightly go short.
XAUUSD
buy@3350-3360
tp:3380-3390-3400
Investment itself is not the source of risk; it is only when investment behavior escapes rational control that risks lie in wait. In the trading process, always bear in mind that restraining impulsiveness is the primary criterion for success. I share trading signals daily, and all signals have been accurate without error for a full month. Regardless of your past profits or losses, with my assistance, you have the hope to achieve a breakthrough in your investment.
XAUUSD:Go long before you go short
Yesterday's market is relatively fast, we pay attention to the stop profit point, today's Asian plate fell, technical point of view, this week after the big Yin, there is little strength of the rebound, often after the reverse draw will be recovered, the same down after the rapid counterattack, short-term overall performance for the shock downward trend, the center of gravity moving down.
The trading space is also gradually shrinking, within the day can be around 3340-3370 range to operate.
Trading Strategy:
BUY@3344-49
TP:3365-70
Consider going short at 3370-75
More detailed strategies and trading will be notified here ↗↗↗
Keep updated, come to "get" ↗↗↗

Gold Pullback: Bear Trap or Buy Dip?📊 Chart Analysis: A clear pullback within the established uptrend is visible, testing key support at —a healthy correction that reinforces the bullish structure.
🔍 News Contradiction🌍: Despite escalating Middle East tensions (typically a gold-positive catalyst), prices are trending lower—a classic bear trap scenario 🚫📉. This divergence underscores the importance of buying dips amid emotional sell-offs.
💡 Trading Framework:
Fed policy statement yesterday failed to spark volatility, as markets had already priced in dovish expectations 💨;
Weekly pattern: Asian sessions have consistently seen rallies 📈, followed by profit-taking pullbacks in later sessions 📉;
Tactical entry: Use intraday highs from Asian trading as resistance references for long positions 🎯.
Technical Confirmations:
Risk Warning: Geopolitical bullish signals being ignored suggests deliberate bearish manipulation (bear trap 🚫);
Timing Strategy: Asian session highs serve as ideal resistance markers—look to enter on retracements to 38.2% Fib levels 🎯
⚡️⚡️⚡️ XAUUSD ⚡️⚡️⚡️
🚀 Buy@ 3335 - 3345
🚀 TP 3360 - 3370
Accurate signals are updated every day 📈 If you encounter any problems during trading, these signals can serve as your reliable guide 🧭 Feel free to refer to them! I sincerely hope they'll be of great help to you 🌟 👇
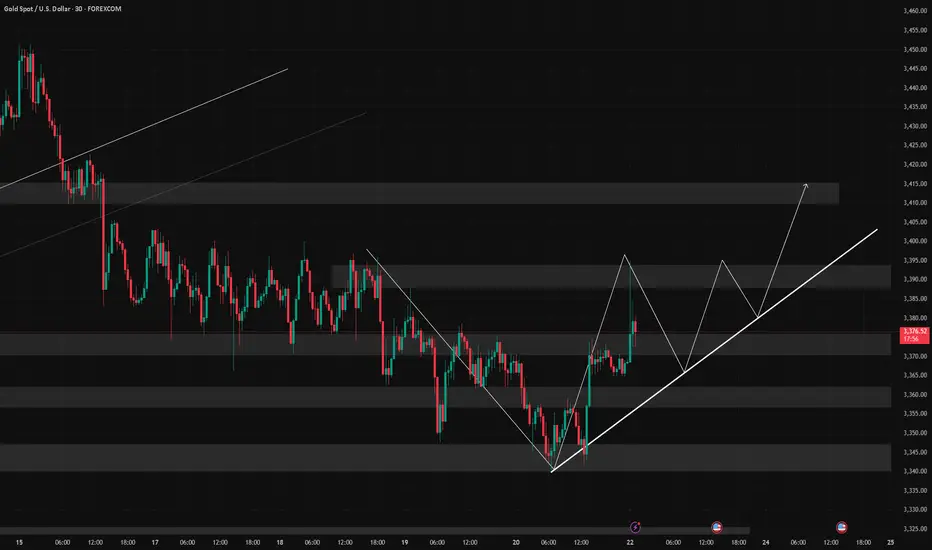
6/20 Gold Analysis and Trading SignalsGood evening, everyone!
After gold rallied to around 3388 yesterday, it began to retrace gradually, providing solid returns for our sell-side strategy.
As of now, gold has dipped to a session low near 3339. On the 30-minute chart, the MACD has formed a bullish crossover, and price has broken above the Bollinger mid-band, indicating short-term bullish momentum. The candle structure supports a potential rebound, but strong overhead resistance remains.
Key resistance comes from the 1H MA60 around 3371, and gold still trades within a broader bearish trend on the daily timeframe. While bulls may attempt a recovery, a complete trend reversal remains unlikely unless significant bullish catalysts emerge.
Hence, our strategy continues to favor selling near resistance levels, while cautiously considering long entries near well-defined supports.
📌 Trading Plan (VIP Focus):
✅ Sell Zone: 3370–3383
✅ Buy Zone: 3338–3321
✅ Flexible Trade Range: 3366-3349
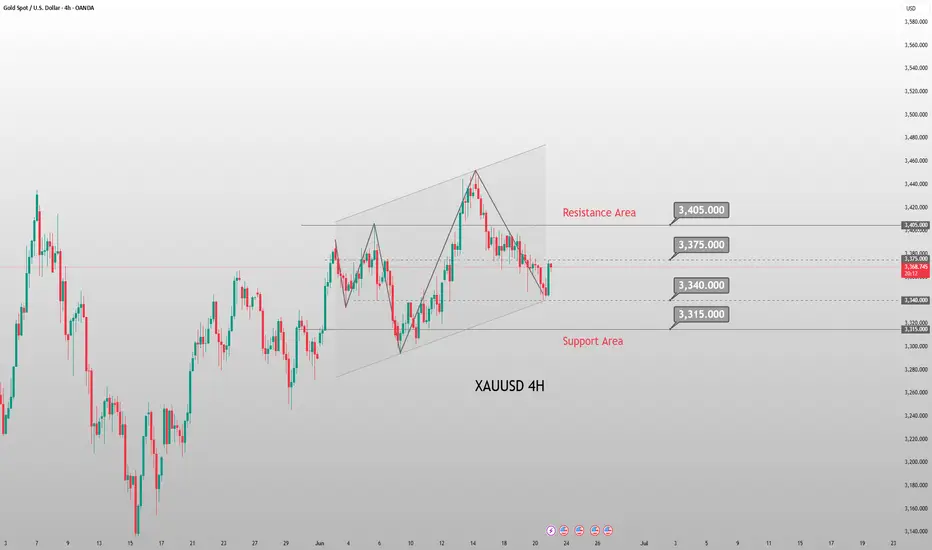
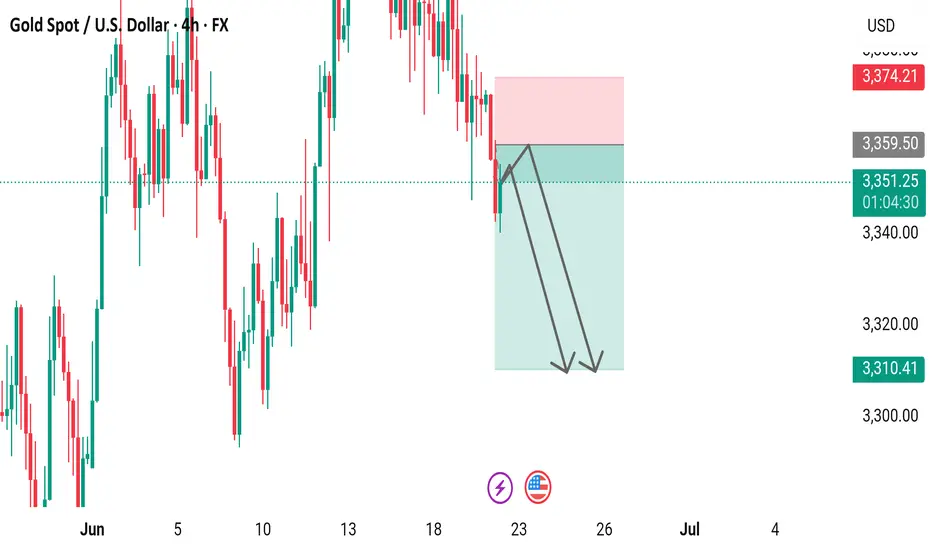
Gold Spot / U.S. Dollar (XAU/USD) 4-Hour Chart4-hour chart displays the price movement of Gold Spot against the U.S. Dollar (XAU/USD) from early June to mid-June 2025. The price, currently at $3,350.76, has experienced a recent decline of $19.76 (-0.59%) as of 01:06:10. The chart highlights a downward trend with a shaded area indicating a potential support or resistance zone between $3,310.41 and $3,374.21. Key price levels are marked, showing fluctuations between $3,300.00 and $3,374.21 over the observed period.
Gold Broke Out – Another Drop Loading?OANDA:XAUUSD TVC:GOLD Gold is attempting a rebound but faces strong resistance near $3,364–$3,368, where previous support converges with the descending trendline (TL1). A clear rejection here could resume the bearish momentum.
Technically, the price is hovering just below the TL1 resistance. The zone around $3,368 is critical — if bulls fail to reclaim this area, we could see a move back toward the $3,326 support, with a deeper target near weekly support at $3,310.
📉 A rejection around current levels = high probability drop
📈 Break and hold above TL1 = potential short-term reversal
🧠 Macro Check:
Despite intensifying Middle East tensions (Israel-Iran conflict escalating, Trump weighing intervention), gold remains under pressure. The Fed’s hawkish hold, persistent inflation, and a strong dollar continue to weigh on bullion in the near term.
🔍 Key Levels:
Resistance: $3,364–$3,368 (structure + TL1)
Support: $3,326 / $3,310
Bias: Bearish below $3,368
Setup Idea: Watch for rejection near resistance for short setups toward $3,326 and $3,310

Gold Pullback in Uptrend Amid Middle East Tensions: Buy the Dip?📊 Clearly visible on the chart: current pullback within an uptrend.
🔍 News paradox: Despite escalating Middle East tensions 🌍, gold is trending lower—a key reason to emphasize buying the dip recently (watch out for bear trap scenarios 🚫📉).
💡 Trading logic breakdown:
Fed statement yesterday caused minimal volatility (market expectations priced in 💨);
This week’s pattern: Asian session rallies 📈 followed by post-Asian pullbacks 📉;
Entry strategy: Use Asian session highs as resistance reference for entries 🎯.
Technical reinforcement:
Risk alert: Geopolitical bullishness ignored → classic bear trap signal (bear trap 🚫);
Timing: Asian session highs form intraday resistance 🎯—look to enter on retracement.
Chart says it all—normal pullback in an uptrend 📊. Ironically, while Middle East conflicts should be gold-positive 🌍, prices are moving lower—a textbook 'buy the panic' setup 🚀. Following this week’s playbook 📅 (Asian session highs followed by dips), focus on Asian session highs as a resistance anchor for entries
⚡️⚡️⚡️ XAUUSD ⚡️⚡️⚡️
🚀 Buy@ 3345 - 3355
🚀 TP 3370 - 3380
Accurate signals are updated every day 📈 If you encounter any problems during trading, these signals can serve as your reliable guide 🧭 Feel free to refer to them! I sincerely hope they'll be of great help to you 🌟 👇

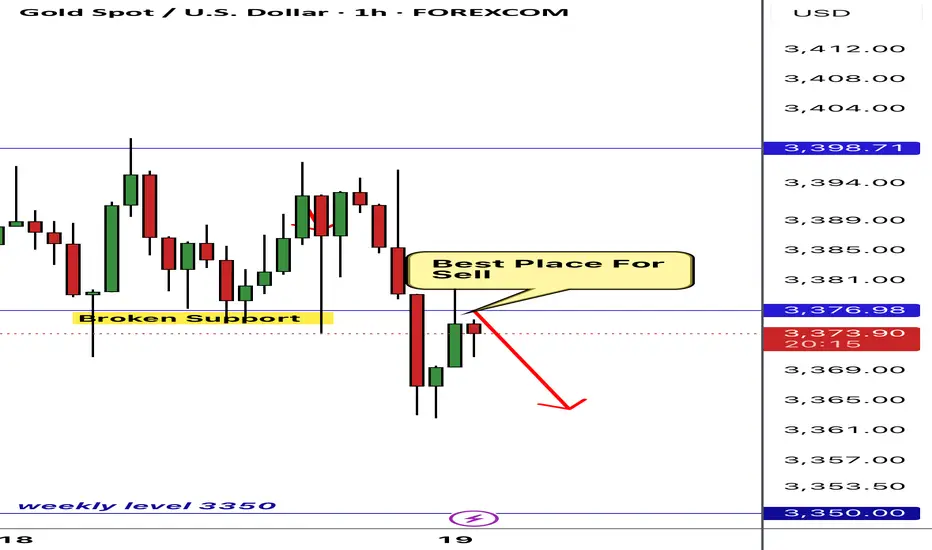
GOLD Finally Breakout , Short Setup Valid To Get 200 Pips !Here is my opinion , after this amazing 4H / Daily Breakout , we should sell Gold From Area Between 3377.00 / 3375.00 And Targeting 250 Pips At Least .
Fed Rate Decision: Gold's 3,400 Threshold as Bull-Bear DivideToday, the market has consolidated in a range throughout the day, with neither price direction nor volatility breaking through the range. However, our trading approach proved accurate: short positions were initiated near 3,400 during rebounds, and long positions were entered near the key level of 3,370 during pullbacks. Investors following our strategy have achieved profits from both directions. With limited price movement currently, the Fed's interest rate decision due to land in an hour will become the core variable dominating the market trend for the rest of the month.
Currently, gold prices continue to trade below the 3,400 threshold, maintaining a weak market structure. The 3,400 level serves as a key watershed between bulls and bears, and the validity of its breakthrough will determine the trend inflection point: if prices effectively hold above 3,400 after the data release, it indicates that gold will break out of its weak pattern, with the potential for an accelerated rally ahead. Conversely, if prices remain suppressed below 3,400, it is highly likely to trigger further downward exploration. It is recommended to closely monitor the breakthrough signal at the 3,400 threshold after the data release, using this as the operational basis for trend switching.
XAUUSD
buy@3370-3380
tp:3400-3420-3450
Investment itself is not the source of risk; it is only when investment behavior escapes rational control that risks lie in wait. In the trading process, always bear in mind that restraining impulsiveness is the primary criterion for success. I share trading signals daily, and all signals have been accurate without error for a full month. Regardless of your past profits or losses, with my assistance, you have the hope to achieve a breakthrough in your investment.
XAUUSD:Today's Trading Strategy
Yesterday, gold prices fluctuated greatly in the US, and around 3400 has become an important pressure level at present. If you want to short, you can consider 3395-3400. At present, the price is near 3362, and the trading idea is mainly long first.
Trading Strategy:
BUY@3357-62
TP:3375-80
↓↓↓ More detailed strategies and trading will be notified here ↗↗↗
↓↓↓ Keep updated, come to "get" ↗↗↗

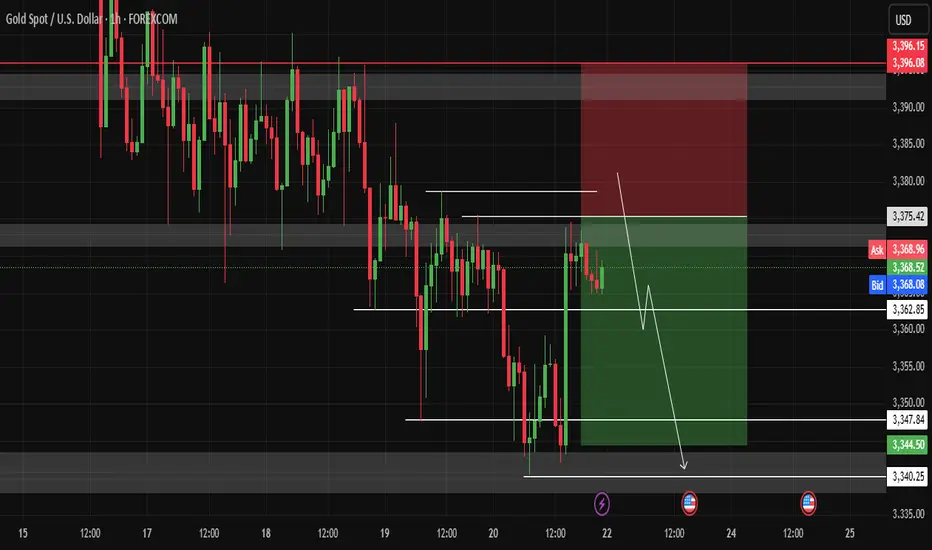
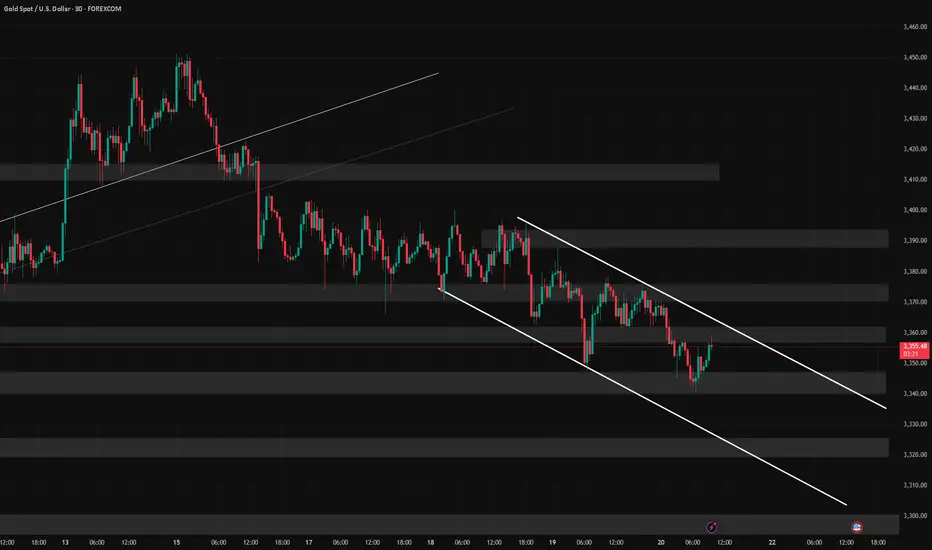
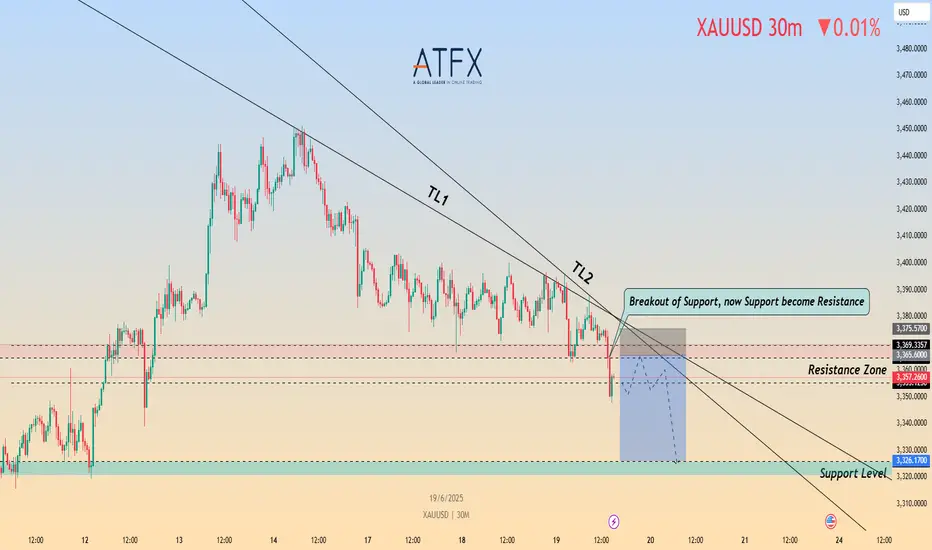
Gold Slips Below Key Support – Is $3,326 Next?OANDA:XAUUSD TVC:GOLD Gold has broken beneath the $3,365–$3,369 support zone, which now aligns with descending trendlines TL1 and TL2 acting as resistance. The 30-minute chart confirms a clean bearish breakout and retest, signalling potential continuation toward lower support near $3,326.
🎯 Short Setup
Entry: $3,365 (retest of broken support / trendline confluence)
Stop: $3,375 (above TL2 and intraday highs)
Target 1: $3,330
Target 2: $3,326
R:R: ~1:3.95
📊 Technical Context
• Price is capped below the $3,365–$3,369 supply zone
• Trendline resistance (TL1, TL2) remains intact from mid-June
• Structure favours continuation lower as long as price stays beneath the retest zone
🌐 Fundamental Backdrop
• Fed held rates steady, but Powell’s tone remained hawkish, warning of “elevated inflation” — supporting USD strength
• Rising Middle East tensions (Israel-Iran conflict) offer safe-haven bids, but not enough to break resistance
• Trump’s tariff threats and criticism of Fed policy add macro uncertainty — mildly supportive of gold in the longer run
📘 Trade Bias
As long as gold holds below $3,365, the bearish thesis remains intact. A sustained push above $3,375 would invalidate the setup and signal a potential reversal or breakout retest.
⚠️ Disclaimer
This analysis is for educational purposes only. Always do your own research and consult a licensed advisor before making financial decisions.
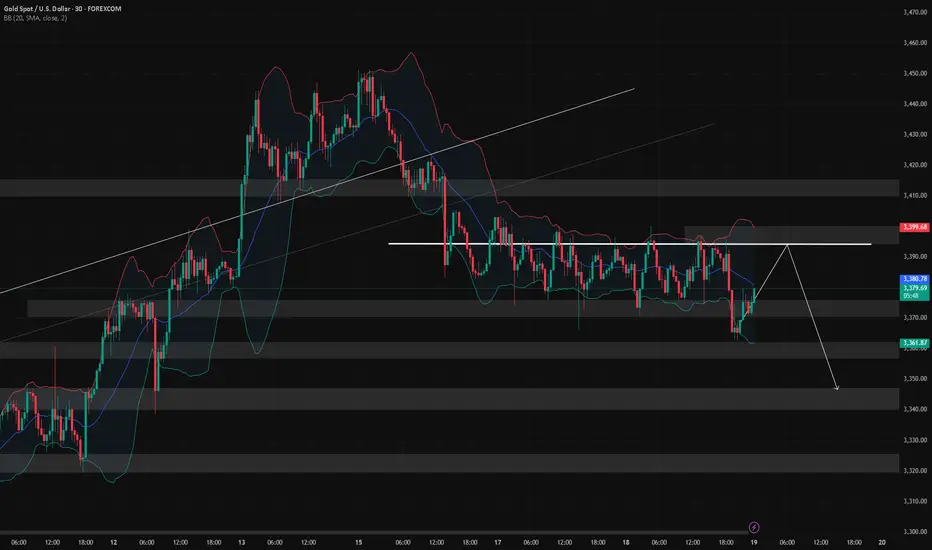
6/19 Gold Analysis and Trading SignalsGood morning!
Yesterday, the Federal Reserve's interest rate decision aligned with market expectations, bringing no major surprises. The market had already priced in bearish sentiment in advance, which led gold to trade within the Bollinger Bands' upper, middle, and lower bounds, with all three bands trending sideways, indicating limited intraday volatility.
🔍 Technical Overview:
On the 30-minute chart, the Bollinger Bands began to tilt downward near the close, with price currently pressured by the middle band;
However, MACD structure suggests the middle band may be broken, with potential for price to challenge the upper band resistance near 3392–3400;
More importantly, on the 1D chart, the MACD is showing signs of a bearish crossover (death cross). If confirmed, it may break the bullish structure, weakening support from the weekly MA5;
If gold sustains below the weekly MA10 at 3317, it could open the door for a broader correction, with a drop toward 3200 becoming increasingly likely.
📊 Fundamental Factors:
Today’s U.S. market holiday means fewer economic data releases. As such, gold will likely be driven by technical structure and geopolitical headlines, especially those related to the Middle East. If no new developments emerge, selling on rallies remains the preferred strategy.
📌 Trading Plan (VIP-Focused):
✅ Sell Zone: 3392–3409
✅ Buy Zone: 3338–3321
✅ Scalp/Flexible Zones: 3387 / 3373 / 3364 / 3356 / 3345
Current Gold Trend Analysis and Trading RecommendationsOn Wednesday, the morning strategy suggested going long on gold at 3,375-3,365, perfectly seizing the pullback low and rebounding to the 3,400 level as expected. Today, there is also the Fed interest rate decision. Before the data release, short positions can be taken if the 3,400-3,405 level remains unbroken. If the 3,405-3,410 level is broken, we will continue to be bullish. Gold is in short-term oscillation, so try not to chase the market. Wait for a good entry opportunity. The upper level has also been repeatedly contested recently, and the Fed data is likely to break the range after its release.
For gold, continue to adopt an oscillating approach. In the 4H cycle, it is operating below the middle band. The short-term range is 3,405-3,365. If it breaks above 3,405, it can continue to target 3,420 and 3,450. Conversely, if it breaks below 3,365, it can fall to 3,350. In operation, prioritize long positions with short positions as a supplement, and adjust the strategy when a breakout occurs.
XAUUSD
buy@3370-3375
tp:3390-3400-3420
sell@3395-3400
tp:3380-3370
Investment itself is not the source of risk; it is only when investment behavior escapes rational control that risks lie in wait. In the trading process, always bear in mind that restraining impulsiveness is the primary criterion for success. I share trading signals daily, and all signals have been accurate without error for a full month. Regardless of your past profits or losses, with my assistance, you have the hope to achieve a breakthrough in your investment.
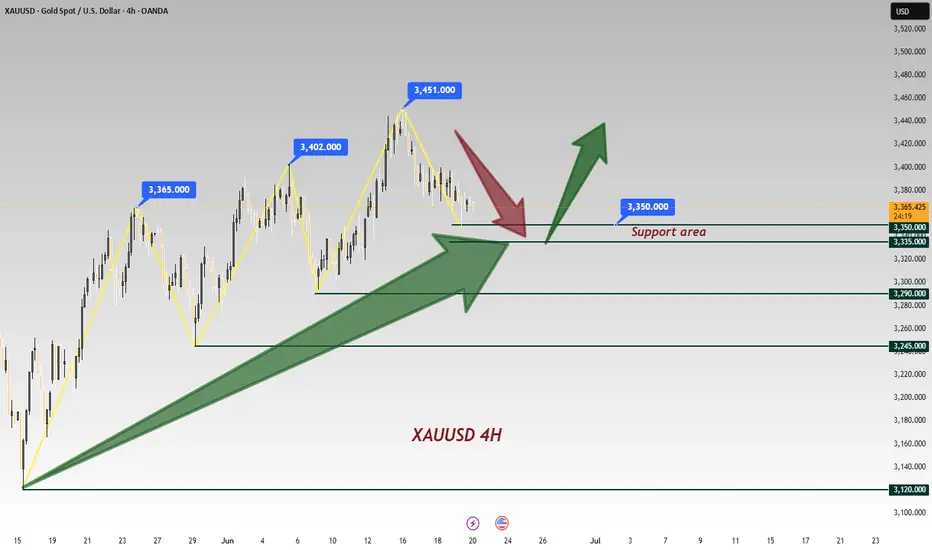
Expect gold to break 3400 for 3430 post-FedIn recent years, after the U.S. economy was hit by a round of high inflation, inflation data has gradually shown signs of easing 📉. Logically, the weakening inflation pressure should have paved the way for the Federal Reserve (Fed) to cut interest rates, but surprisingly, the Fed has chosen to remain on the sidelines and maintain its high-interest-rate policy ⚖️. The Fed's decision to keep rates high has had a significant impact on gold prices and the U.S. dollar 💱. First, high interest rates typically push up the U.S. dollar exchange rate, thereby dampening gold demand 💰↓.
Gold's price movement this week deviated from market news or expectations 📉≠📢. Driven by geopolitical conflicts, gold rallied on Friday 📈, and the momentum continued to simmer over the weekend, leading to a gap-up opening on Monday followed by a steady decline 📉. On the hourly timeframe, the low points are gradually shifting downward, with 3,400 becoming a short-term resistance level 📊. Although gold fell from 3,452, it is clearly oscillating around 3,380 🔄
I think the Fed's interest rate decision this time may cause gold to directly break through 3400 and reach around 3430 🌟📈
⚡️⚡️⚡️ XAUUSD ⚡️⚡️⚡️
🚀 Buy@ 3380 - 3385
🚀 TP 3400 - 3430
Accurate signals are updated every day 📈 If you encounter any problems during trading, these signals can serve as your reliable guide 🧭 Feel free to refer to them! I sincerely hope they'll be of great help to you 🌟 👇

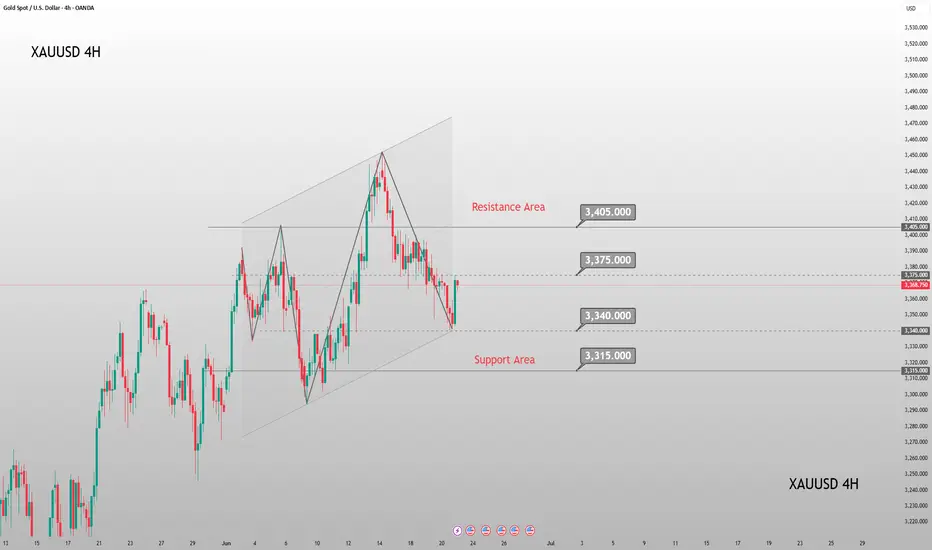
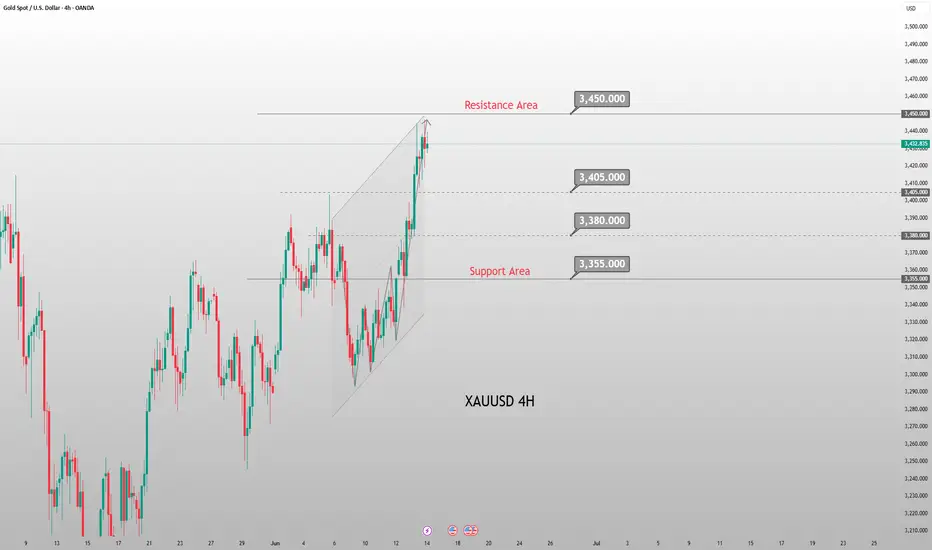
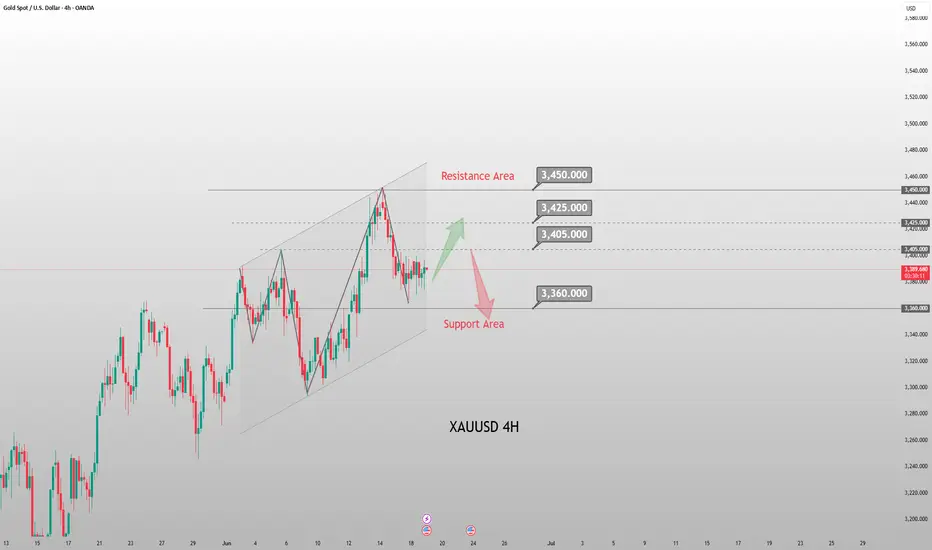
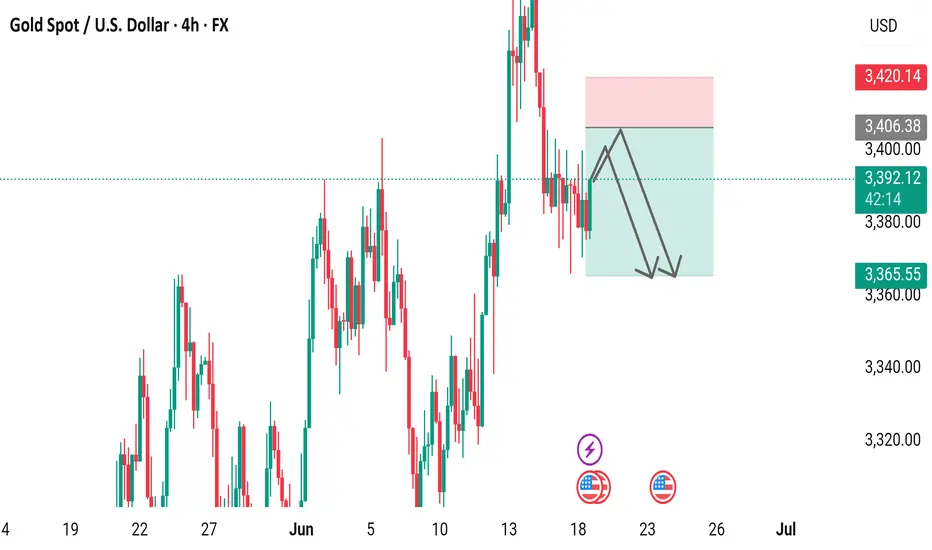
Gold Spot / U.S. Dollar (XAU/USD) 4-Hour Chart4-hour candlestick chart displays the price movement of Gold Spot (XAU) against the U.S. Dollar (USD) from June 4 to June 18, 2025. The current price is 3,391.79, reflecting a +3.61 (+0.11%) change. The chart highlights a recent upward trend with a notable peak, followed by a slight pullback. Key price levels are marked, ranging from 3,320.00 to 3,420.14, with technical analysis indicators such as a resistance zone (pink) and a support zone (light green) overlaid.
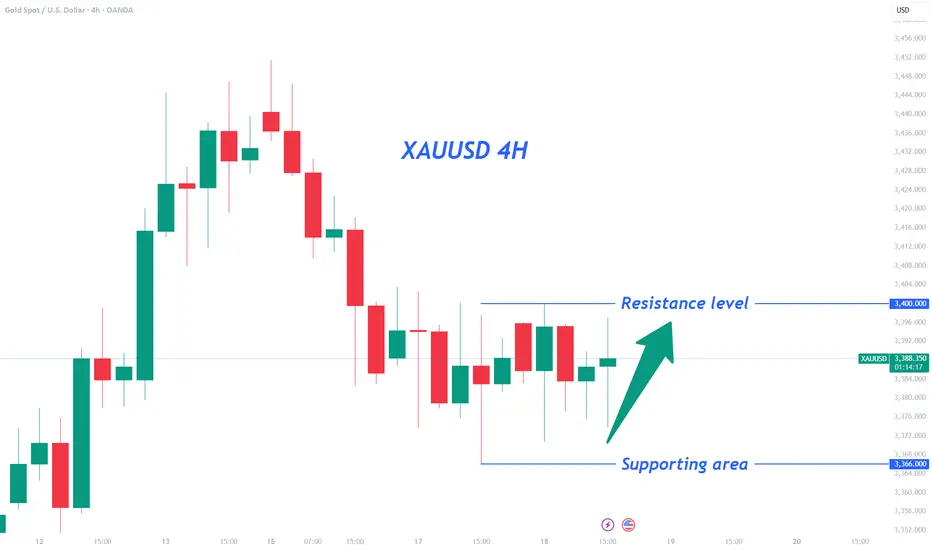
Buy Signal at 3363 Support, Sell Signal at 3400 ResistanceToday's key resistance level for gold remains at 3400.00 🚦, with the support area around 3363.00 🛡️. The current price of gold is 3388, placing it in the middle of the range between the support and resistance levels ⚖️.
We can wait for opportunities to go long when the price drops to around the support area of 3363.00 - 3370.00 📉, accompanied by bullish candlestick patterns (such as a hammer with a long lower shadow 🔦, a bullish engulfing pattern 🐂) or positive fundamental news (such as dovish remarks from the Federal Reserve 🕊️, escalation of geopolitical conflicts in the Middle East 🔥).
Conversely, we can consider going short when the price reaches the resistance zone of 3400.00 - 3405.00 📈, along with negative fundamental news (such as strong U.S. economic data 📊, easing of geopolitical risks 🧘).
Gold Trading Strategies
sell@ 3400-3405
tp:3375-3365
buy@3365-3370
tp:3390-3400
Professional trading strategies are pushed daily 📊
Lock in precise signals amid market fluctuations 🚀
Confused about market trends? Stuck in strategy bottlenecks?
Real-time strategies serve as your "trading compass" 🌐
From trend analysis to entry/exit points, dissect market logic comprehensively
Refer now 📲
Help you move steadily forward in investments ✨
👇👇👇