XAU/USD: Next Week's Trend Analysis and Trading SuggestionsI. Global Central Banks' Gold Purchases Continue to Support Long-Term Gold Uptrend
For instance, China's central bank has increased gold reserves for 7 consecutive months, India's gold reserve ratio has doubled compared to 2021, and countries like Thailand and Brazil followed suit in May. Central banks' gold buying, driven by reserve structure optimization and geopolitical risk hedging, provides long-term support for gold prices via sustained demand growth.
II. Technicals Show Intense Range Battle at $3,400 Key Level
Gold prices, after breaking through $3,400, are oscillating near $3,430. Short-term bulls dominate, but $3,450 acts as a significant resistance. The $3,400 level has turned into strong support— a breakdown could trigger pullbacks. While moving averages show a bullish alignment, overbought technical signals warrant correction vigilance.
III. Geopolitical Conflicts Escalate Sharply
Israel's precision strikes destroyed Iranian nuclear facilities and decapitated high-ranking officials, prompting Iran's immediate retaliation. With multiple Middle Eastern nations now involved, escalating geopolitical risks strongly underpin the rally in gold and crude oil.
Conclusion
Geopolitical tensions will sustain short-term upward momentum for gold, but investors must monitor Middle East developments and Fed policy shifts. Prudent position management based on risk tolerance is advised, with caution against excessive leverage in volatile markets.
Next Week's XAU/USD Trading Strategy
buy@3410-3420
tp:3440-3450
I am committed to sharing trading signals every day. Among them, real-time signals will be flexibly pushed according to market dynamics. All the signals sent out last week accurately matched the market trends, helping numerous traders achieve substantial profits. Regardless of your previous investment performance, I believe that with the support of my professional strategies and timely signals, I will surely be able to assist you in breaking through investment bottlenecks and achieving new breakthroughs in the trading field.
Xauusdsell

Current Gold Trend Analysis and Trading RecommendationsOn Friday, the strategy of going long on gold at relatively low levels was once again precisely fulfilled. The morning strategy clearly suggested opening long positions within the range of 3400 - 3410. As expected, the price of gold once again surged to around the 3445 level, and profits were successfully secured once more.
The hourly chart of gold shows a volatile upward trend. Driven by risk aversion in the early morning, it surged rapidly but fell back for correction after hitting resistance at 3444 during the European session. Before the U.S. session, it stabilized at 3412 and rallied again. The previous large bearish candlestick was more of a minor shakeout—after washing out floating chips, it has now regained its upward momentum.
Maintain a strongly bullish approach for now. The 3415-3410 range forms a key support zone, and long positions can be continued above this level. Upper resistance remains at 3445-3450; a valid breakout could lead to further gains toward 3475 and beyond. However, be aware that a sustained rally may trigger a pullback due to overbought indicators or divergences. For operations, consider going long near support and exercise caution when chasing highs near resistance
XAUUSD
buy@3405-3315
tp:3430-3450
Investment itself is not the source of risk; it is only when investment behavior escapes rational control that risks lie in wait. In the trading process, always bear in mind that restraining impulsiveness is the primary criterion for success. I share trading signals daily, and all signals have been accurate without error for a full month. Regardless of your past profits or losses, with my assistance, you have the hope to achieve a breakthrough in your investment.
Gold: Monitor Middle East Developments Over the WeekendAmid escalating tensions in the Middle East, risk-off sentiment surged,
sending gold soaring past the 3414 resistance and peaking near 3450,
before retracing and rebounding off the 3414 support zone.
⚠️ While this was a high-volume breakout, it was news-driven,
so keep in mind:
📌 If tensions ease over the weekend, a pullback on Monday is highly likely
📌 If tensions escalate, another bullish run would be expected
—
🔍 Technical Outlook:
🧭 4H chart: 9-count nearing completion — overbought signals building
🧭 2H chart: MACD showing early signs of a bearish crossover; potential divergence forming
🧭 1D chart: Breakout with volume confirms bullish trend, but risk of short-term correction remains
—
📌 Key Price Zones:
🔺 Resistance: 3468 – 3487 – 3500
🔻 Support: 3414 (critical) – 3400 – 3392
⚠️ If broken, next downside targets: 3378 – 3367
—
📈 Strategy Suggestions:
As we head into Monday:
✅ Consider selling on rallies if geopolitical tensions ease
✅ If tensions worsen, follow the momentum — but watch for reversal signs
May peace prevail on earthIf geopolitical conflicts continue to fester, gold prices may keep climbing due to safe-haven demand—yet this is far from our wish. 📈
When risk aversion pushes candlestick charts higher, we'd rather see battlefield fires cease by dawn, letting the rhythm of peace replace market volatility. 🌍✨
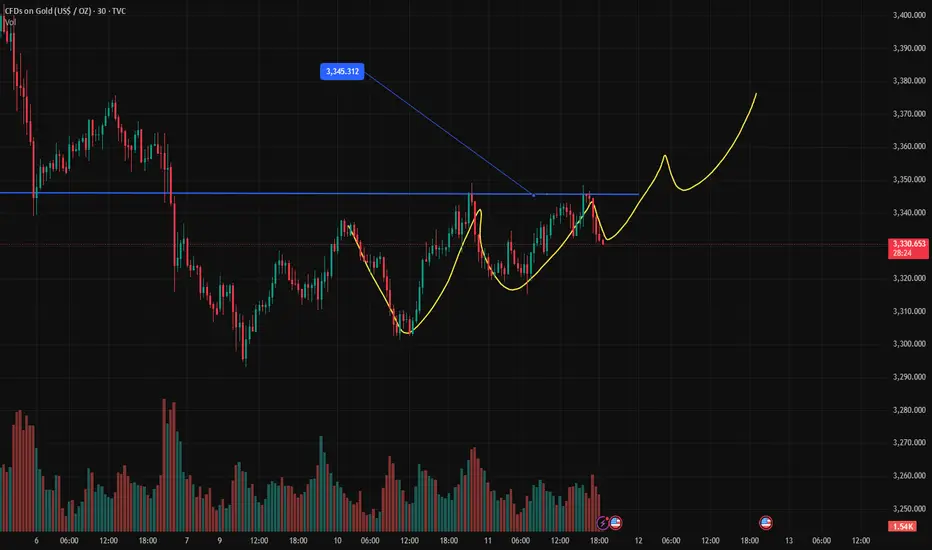
XAUUSD:Buy or SellRegarding the trend of XAUUSD (gold against the US dollar), it is completely in line with my expectations yesterday. The current price has reached the watershed of 3345. If it breaks through, continue to be bullish. If it does not break through. Then wait for the market to fall.
### Key analysis points
1. Confirmation of resistance breakthrough
- The importance of the 3345 level: If this position is a resistance that has been tested many times recently (such as previous highs, Fibonacci retracement levels or trend line suppression), it may trigger short-covering or new buying after the breakthrough, pushing the price further up.
- Verify the effectiveness of the breakthrough: It is necessary to observe the momentum at the time of the breakthrough (such as accompanied by a large positive line, increased trading volume) and whether the closing price can stand above 3345 to avoid false breakthroughs.
2. Upward target
- First target: If the breakthrough is established, the next resistance may look at the 3360-3380 area (previous high or extended Fibonacci level).
- Medium-term potential: If the trend reversal is confirmed, it may even challenge the 3400 psychological level.
3. Pullback risk management
- Support level: If it fails to break through 3345 or falls back after a false breakout, you need to pay attention to the support below (such as 3320-3300), which is the short-term long-short watershed.
- Stop loss reference: The stop loss of long positions can be set below 3300 to protect the safety of funds.
Trading strategy suggestions
- Aggressive strategy (breakthrough trading):
- Entry: Go long when the price breaks through 3345 and then confirms the pullback.
- Stop loss: Below 3320 (adjusted according to volatility).
- Take profit: Close orders in batches (3360, 3380).
- Conservative strategy (retracement trading):
- Wait for the pullback to the 3320-3300 support area to stabilize and then go long, stop loss 3280.
- The target is the same as the breakthrough strategy.
- Short warning:
If the 3345 resistance continues to suppress and a bearish pattern appears, consider shorting with a stop loss above 3360.
Variables to be added
1. Time frame: Is the above analysis based on the daily or 4-hour chart? Short-term trading requires a smaller cycle to confirm the signal.
2. Driving factors: Pay attention to the Fed's policy expectations, the US dollar index, the geopolitical situation, etc., which may suddenly change the technical pattern.
Summary
Whether the current rebound can continue depends on the effectiveness of the breakthrough of 3345. If successful, it can be bullish, but a strict stop loss is required.
If you need a more detailed entry point analysis or position management plan, please feel free to let me know your trading cycle and risk preference, and I will provide you with a customized strategy.

XAUUSD: Buy or sell now?Continuously update good transactions. Let members make rich profits. How to trade XAUUSD today?
Reference suggestions are as follows:
If it retreats to the range of 3318-3328, consider buying. Target 3345-3360
If it falls below 3310, chase the shorts and choose to sell. Target 3280-3265
For reference only. Do not trade independently.
If you need a more detailed entry point analysis or position management solution, please feel free to tell me your trading cycle and risk appetite, and I will provide you with a customized strategy.
XAUUSD: Buy or sell now?The price of XAUUSD has come to the position near 3345 again. The pressure at this position is very controversial. We need to observe. If this position is stable. Then we need to pay attention to the target of 3360-3385. If it is unstable, we will short and wait for the TP of 3320, which still needs to be emphasized. If you are not sure how to trade. Remember to leave us a message. We will lead you to make better and more accurate transactions, expand profits or recover losses. Do not trade independently. Create greater losses.
Remember to continue to pay attention to the core trading strategy updates of swing trading.
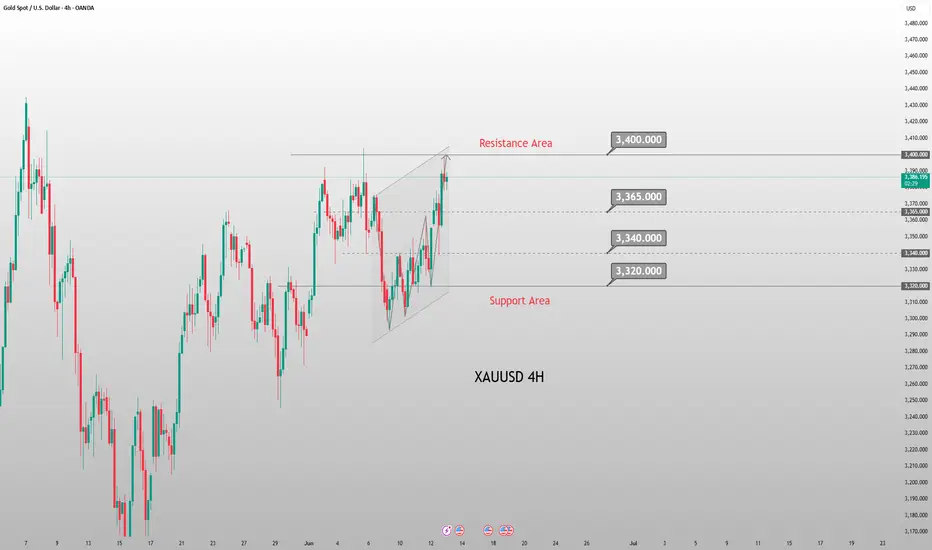
Current Gold Trend Analysis and Trading RecommendationsThe tensions between the U.S. and Iran continue to intensify as the second U.S. nuclear-powered aircraft carrier enters the Persian Gulf. Iran's Defense Minister warned that it would attack U.S. bases if conflict broke out. However, the sixth round of talks between the two sides is scheduled for June 15 in Oman, a development that has raised market expectations for a de-escalation of negotiations. Geopolitical risks are time-sensitive, as if the conflict does not escalate, risk aversion may fade rapidly, and gold could give back its gains.
From a 4-hour technical analysis, the short-term support level below focuses on the 3365 area, with the 3340 level as key support. The main strategy remains to go long on pullbacks to these support levels and follow the upward trend. The key bullish threshold lies at the 3320-3325 zone – any pullback before the daily close breaks below this level presents a buying opportunity, maintaining the primary approach of trend following. We recommend prioritizing long positions on corrections and using short positions on rebounds as a supplement. The short-term resistance above is at the 3400-3405 area, while the short-term support below is at the 3360-3350 range.
XAUUSD
buy@3350-3360
tp:3380-3400
Investment itself is not the source of risk; it is only when investment behavior escapes rational control that risks lie in wait. In the trading process, always bear in mind that restraining impulsiveness is the primary criterion for success. I share trading signals daily, and all signals have been accurate without error for a full month. Regardless of your past profits or losses, with my assistance, you have the hope to achieve a breakthrough in your investment.
6/13 Gold Analysis and Trading SignalsGood morning, everyone!
Gold rallied to around $3399 during yesterday’s session, accurately reaching our preset sell zone at 3385–3403. Since then, the market has started pulling back, and today’s opening shows signs of accelerated downside movement. However, there are several strong support zones below, with immediate focus on 3378–3368, and further support around 3352–3343.
📉 Technical Outlook:
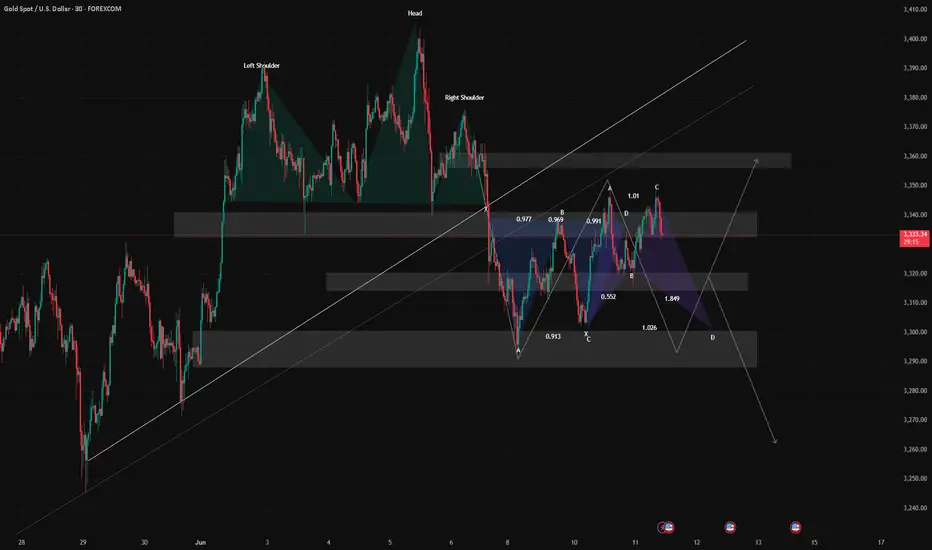
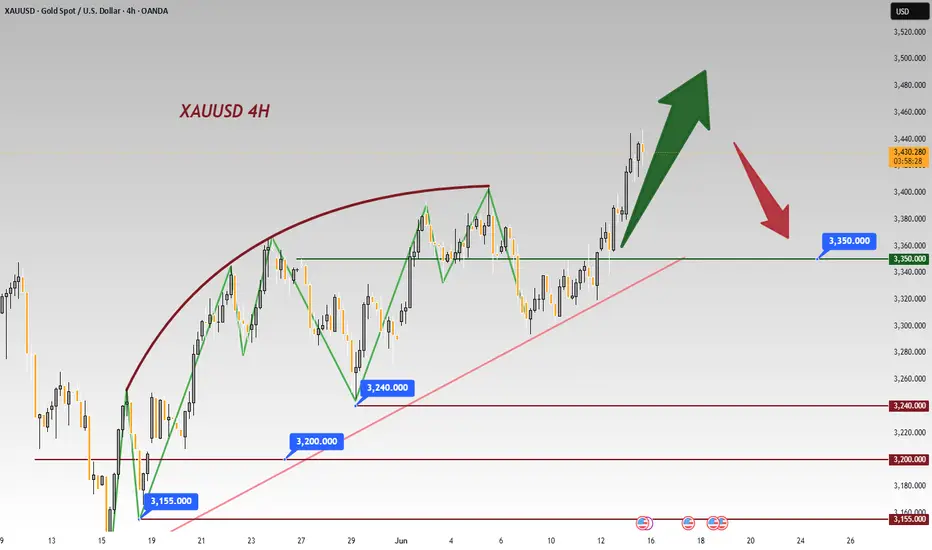
The current price action suggests the potential formation of a Head and Shoulders pattern. If confirmed, this could trigger a deeper correction towards 3340–3330. A break of these levels would significantly weaken the current bullish structure and open further downside risk.
🌍 Fundamental Drivers:
Today’s inflation-related data releases may add significant volatility;
Additionally, stay alert to any developments in the Middle East geopolitical situation, which could quickly shift market sentiment toward risk-off if escalations occur.
📌 Today’s Trading Recommendations:
✅ Sell Zone: 3410–3420
✅ Buy Zone: 3338–3326
🔄 Intraday Key Reaction Levels:
3403 / 3378 / 3362 / 3355 / 3343
🔒 Recommendation: Market is at a technically sensitive zone. Consider entering positions in batches and maintain strict risk control.

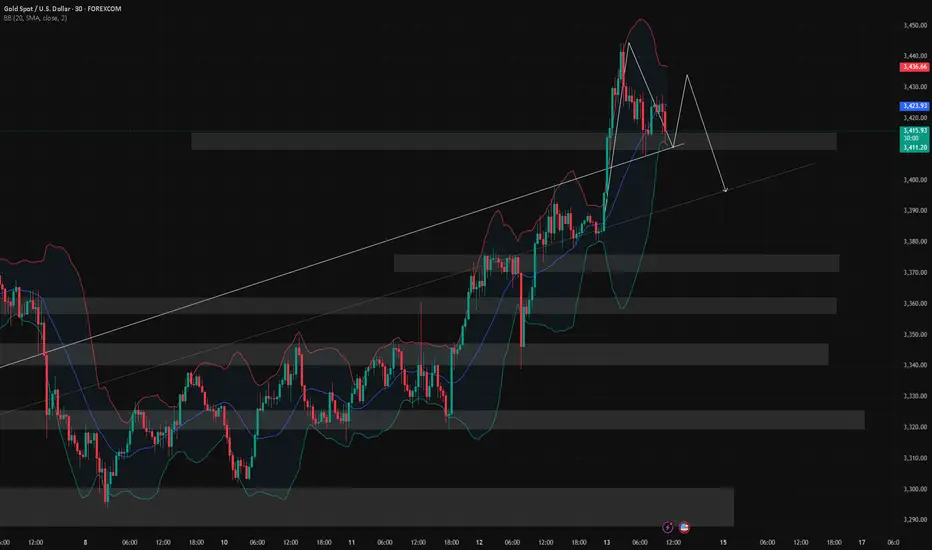
Watch Out for Weekly-Level ResistanceAs news of Israel's strike on Iran’s nuclear facility continues to spread, a surge in risk-off sentiment has driven noticeable gains across safe-haven assets. The escalation of tensions in the Middle East has clearly become a key trigger for current market sentiment. Should the conflict intensify further, oil and other safe-haven assets may see continued upside; conversely, if tensions ease, the retreat of risk aversion could lead to price corrections.
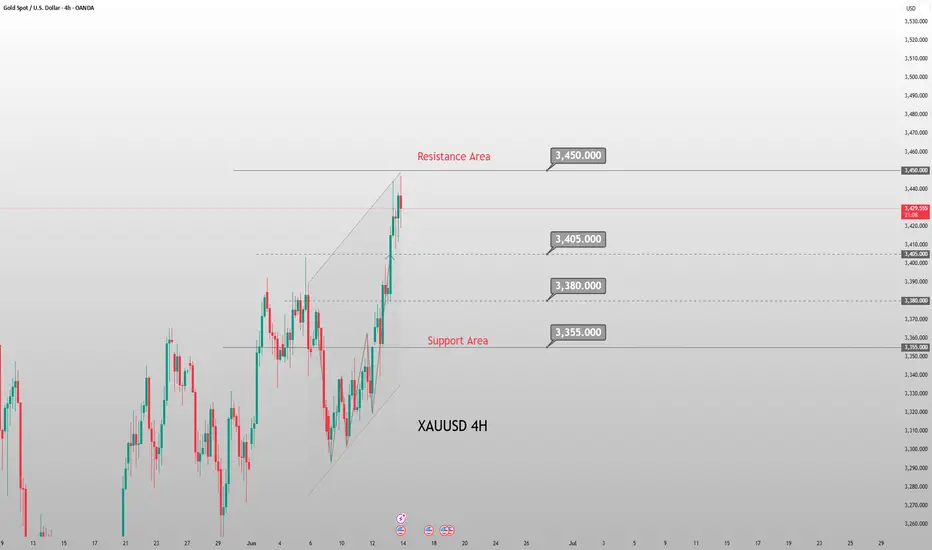
From a technical perspective, gold is currently facing downward pressure from the weekly trendline. If geopolitical tensions persist, gold may potentially rally toward the 3500–3550 range. However, without stronger fundamental support, a significant correction could follow once that level is reached.
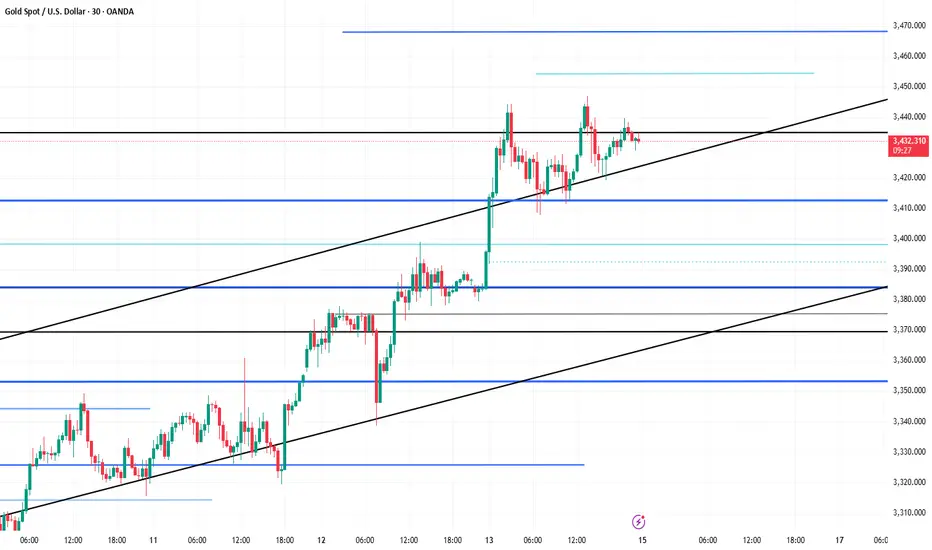
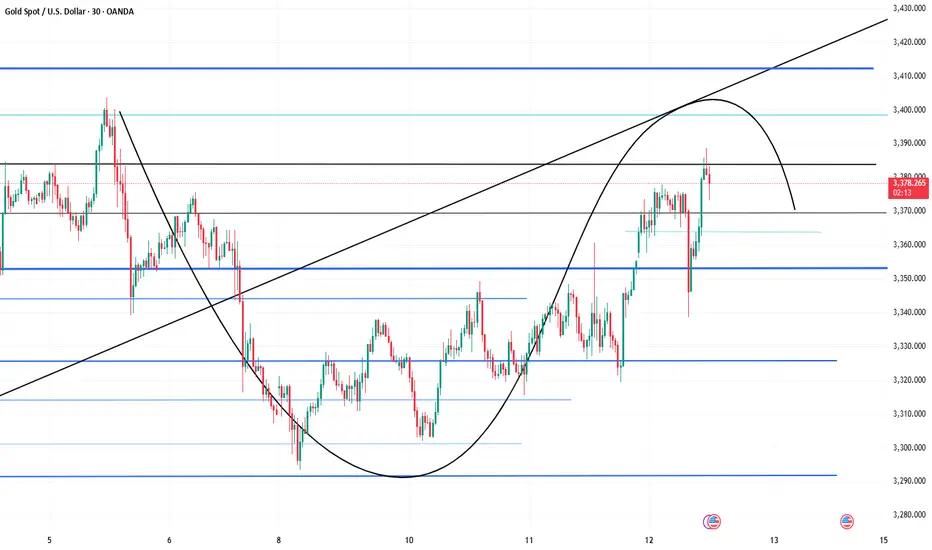
On the intraday chart, the price has now broken below the middle Bollinger Band on the 30-minute timeframe and is near lower band support around 3413. MACD and moving average alignment suggest there may still be room to test the 3396–3388 trend support zone. The 1-hour chart remains in a consolidation phase, and while a short-term rebound is possible, selling at higher levels appears to be the safer strategy for today.
As it is Friday and given the geopolitical uncertainties, the potential for weekend risk is significantly higher. It is recommended to reduce exposure before the market closes. If you choose to hold positions over the weekend, be sure to set appropriate stop-losses to mitigate unexpected developments.
Stick to shorting gold and aim for the target area.Gold has not broken through 3400 after accelerating its rise, and the upper suppression effect still exists; currently gold is fluctuating in a narrow range below 3390, showing signs of stagflation to a certain extent. Therefore, the accelerated rise of gold is not for the short-term impact of 3400, but for a deep retracement, eliminating more scattered funds in the market by sweeping up and down.
So in the short term, I think it is difficult for gold to continue to break upward under the suppression of the resistance area near the short-term high of 3402, but to test the lower support area of 3375-3365 before breaking upward. So I have shorted gold as scheduled according to the short trading plan mentioned above, and aimed at the lower target area of 3375-3365.
At present, our short position has made a certain profit, but I still look forward to profiting from gold hitting TP! Let us look forward to gold falling back to the target area as expected!

Middle East Tensions Drive Gold Back to $3,400Today, after pulling back to around $3,340, gold broke through $3,380 and has since fluctuated in a narrow range of $3,370-$3,400. With the Middle East tensions escalating, Iran has stated that even if its current nuclear facilities are damaged, it will continue to build new sites and is determined to rebuild them to safeguard its security. Israel will by no means tolerate this, dimming the hopes of the Trump administration's peace initiative.
Short positions are now infeasible. Although rallies to new highs are often followed by pullbacks, the risk of wiping out accounts entirely makes shorting too dangerous.
We recommend gradually building long positions near $3,350-$3,370, setting stop-loss orders 10-15 dollars below the entry price to avoid heavy losses from major shifts in the situation.
I am committed to sharing trading signals every day. Among them, real-time signals will be flexibly pushed according to market dynamics. All the signals sent out last week accurately matched the market trends, helping numerous traders achieve substantial profits. Regardless of your previous investment performance, I believe that with the support of my professional strategies and timely signals, I will surely be able to assist you in breaking through investment bottlenecks and achieving new breakthroughs in the trading field.
Gold Market Analysis and Trading Recommendations for TodayYesterday, gold surged then pulled back in a washout move triggered by CPI data, before rebounding again in the evening on news-driven sentiment, closing the daily chart bullish. This morning's opening saw further rally breaking new highs, confirming strong bullish momentum. Today's strategy remains buying on dips with the uptrend.
On the 4H chart, gold stabilized at the mid-Bollinger band before rebounding with consecutive bullish candles. Moving averages are bullishly aligned and Bollinger bands are widening—all signaling strong bullishness. However, as the triangle consolidation range remains unbroken, chasing the rally is unadvised. Focus on dip-buying: key supports at 3,345–3,340 and 3,325; resistances at 3,385 and 3,400, where potential shorting opportunities may be considered based on price momentum.
XAUUSD
buy@3340-3350
tp:3370-3380
Investment itself is not the source of risk; it is only when investment behavior escapes rational control that risks lie in wait. In the trading process, always bear in mind that restraining impulsiveness is the primary criterion for success. I share trading signals daily, and all signals have been accurate without error for a full month. Regardless of your past profits or losses, with my assistance, you have the hope to achieve a breakthrough in your investment.
6/12 Gold Analysis and Trading SignalsGood morning, everyone!
Gold rebounded after dipping to around $3320 yesterday, following a pullback from our previously defined sell zone (3358–3373). Early today, price broke above 3360, reaching a high of 3373, exactly within the resistance zone we expected. The initial rejection from this level aligns well with our plan.
📈 Technical Analysis:
Watch closely whether 3373 can be broken with strong volume. If so, the next key resistance lies around 3385.
However, if price reaches this level without first testing the 3352–3346 support, a rejection is likely. In such case, 3385 may serve as a temporary top and a potential short entry point.
🧭 Trend Structure:
On the 4H timeframe, the bullish momentum remains intact. The last two candles suggest strong buying pressure. If today's fundamentals are supportive, a test of 3400 or higher is possible.
On the 1D chart, the market is still in a technical correction phase. The bounce near 3300 was supported by the long-term trendline. However, if price drops back below 3340 and stays there, a trend reversal becomes more likely.
Focus on the 3314–3296 support zone. If that breaks, a deeper drop is likely, possibly $100 or more, pushing price toward 3200–3190. The decline may unfold as a slow grind or sharp breakdown.
📊 Fundamental Watch:
Today’s Initial Jobless Claims data could have greater-than-usual impact due to the recent CPI release.
The Federal Reserve's Quarterly Financial Accounts Report is also due today and may affect broader market sentiment.
📌 Today’s Trading Recommendations:
✅ Sell Zone: 3385–3403
✅ Buy Zone: 3331–3321
🔄 Intraday Scalping Levels:
3376 / 3358 / 3346 / 3334

Beware of Bear Traps — Avoid Chasing Prices Blindly!Today, gold rallied up to 3380, then retraced to retest the 1H MA60 (around 3340),
before making another strong upward breakout, surpassing the earlier Asian session high.
📌 This upward move was driven by a combination of key factors:
🔸 Trump’s announcement of new tariffs to be imposed within two weeks
🔸 Rising geopolitical tensions in the Middle East, fueling safe-haven demand
🔸 A weaker-than-expected CPI yesterday
🔸 And an upcoming PPI release later today
📉 Current Price Outlook:
🔺 Strong resistance at 3392, closely watched
🔺 Next resistance zone: 3403–3414
🔻 Key support zones: 3360–3350
⚠️ Also note: the 3289 price gap remains unfilled,
which means downside risks haven’t been fully eliminated — avoid chasing rallies blindly!
✅ Trading Strategy:
Stick with the approach:
📌 Buy near key support, sell near known resistance
📌 Stay alert for news-driven bull traps, and manage risk wisely
XAU/USD: Ushering in a Critical Node of Long-Short GameYesterday, while CPI data boosted gold, the Middle East situation remained on the brink of explosion.
The regional tensions in the Middle East have escalated sharply. Religious differences and historical disputes have deepened the contradictions between the two nations, while the nuclear issue has further intensified the conflict. Iran insists its nuclear program is for peaceful purposes, but Israel has long alleged that Iran is secretly developing nuclear weapons, posing a significant threat to Israel's national security.
Recently, CBS News cited U.S. sources reporting that Israel is fully prepared to launch military operations against Iran. If Israel strikes Iran, Iran will inevitably fight back, potentially igniting all-out war in the Middle East. As a major global oil-producing region, turmoil in the Middle East will inevitably trigger sharp fluctuations in international oil prices, thereby impacting the global economy and drastically escalating market risk aversion.
Against this backdrop, gold, as a traditional safe-haven asset, has been hotly pursued by investors. Given that the current tension between Israel and Iran far exceeds previous levels, if all-out war breaks out, gold's safe-haven properties will be further activated, with prices likely to break through previous highs and continue to rise sharply. However, if the situation is controlled or eased in the short term, gold prices may drop rapidly as risk aversion subsides.
After breaking through the resistance of the narrow range at $3,350 and hitting $3,360 yesterday, gold prices pulled back to around $3,320. The current trading range is $3,330 - $3,380.
With the recent stable breakout, shorting is not advisable for now. The optimal strategy is to go long on pullbacks.
XAU/USD
buy@3340-3350
tp:3370-3380-3400
sl:3320
I am committed to sharing trading signals every day. Among them, real-time signals will be flexibly pushed according to market dynamics. All the signals sent out last week accurately matched the market trends, helping numerous traders achieve substantial profits. Regardless of your previous investment performance, I believe that with the support of my professional strategies and timely signals, I will surely be able to assist you in breaking through investment bottlenecks and achieving new breakthroughs in the trading field.

Gold: Rebounding and Stabilizing Near 3340Gold Market Outlook: Watching Inflation, Technical Pressure Builds
Markets are squarely focused on the upcoming U.S. Consumer Price Index (CPI) release, which could serve as a pivotal moment for shaping Federal Reserve policy expectations ahead of the September meeting. Current market pricing suggests a roughly 52% probability of a rate cut, but this is highly sensitive to how inflation data unfolds. The consensus anticipates headline CPI growth of 0.2% and core inflation at 0.3%. Any deviation—especially a softer reading—could significantly sway sentiment in favor of monetary easing, thereby reinforcing gold’s appeal as a defensive asset.
Beyond the macroeconomic calendar, broader geopolitical undercurrents continue to influence the landscape. Optimism stemming from recent progress in U.S.-China trade discussions has buoyed risk appetite, yet this is tempered by lingering concerns after a court ruling upheld former President Trump’s authority to maintain certain tariffs. This legal development introduces fresh layers of ambiguity, keeping the U.S. dollar on the defensive and lending indirect support to gold prices.
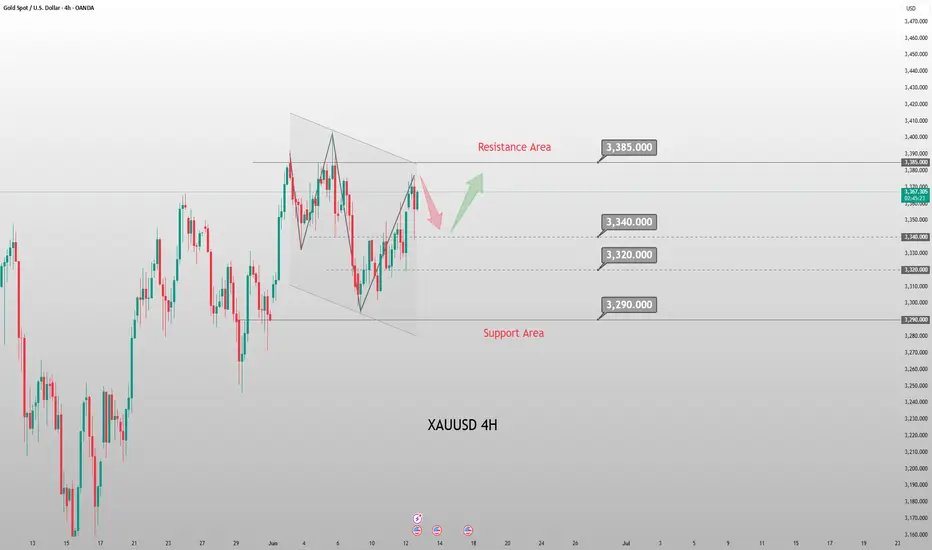
From a technical standpoint, gold remains confined within the narrowing bounds of a symmetrical triangle pattern—a classic sign of consolidation and potential volatility ahead. The price action reflects a broader indecisiveness prevalent across multiple asset classes, as traders await clearer macro signals before committing to directional moves.
Key support lies at 3301, 3330, and 3340, while resistance is seen at 3349, 3361, and 3375. Special attention should be paid to the critical 3330–3340 range, which has acted as a magnet for price in recent sessions. A decisive break and sustained hold above this zone—especially if supported by softer inflation data—could hand the bulls a tactical advantage, opening the door for a push toward higher resistance areas and renewed bullish momentum.
In summary, gold is at a technical and fundamental crossroads. Inflation data will likely determine whether the metal can break free from its current consolidation or remain range-bound amid ongoing uncertainty.
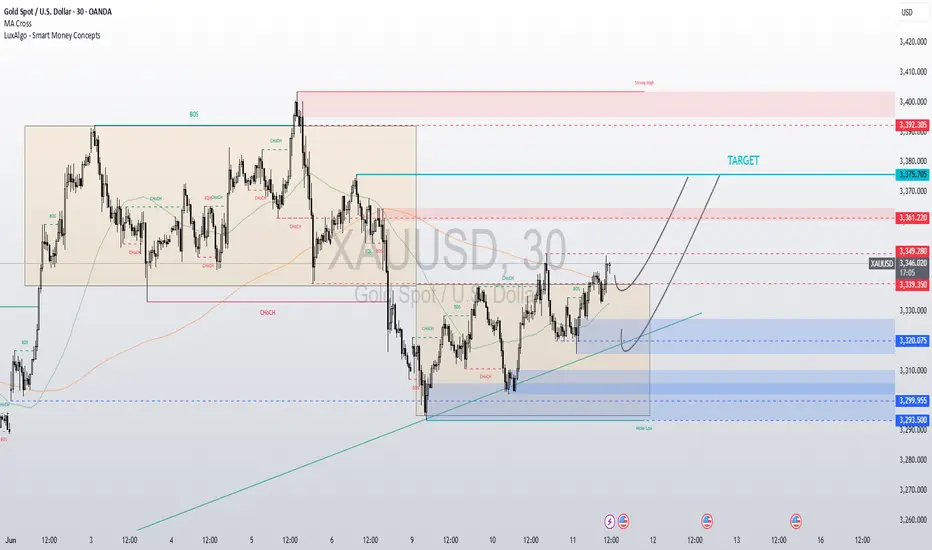
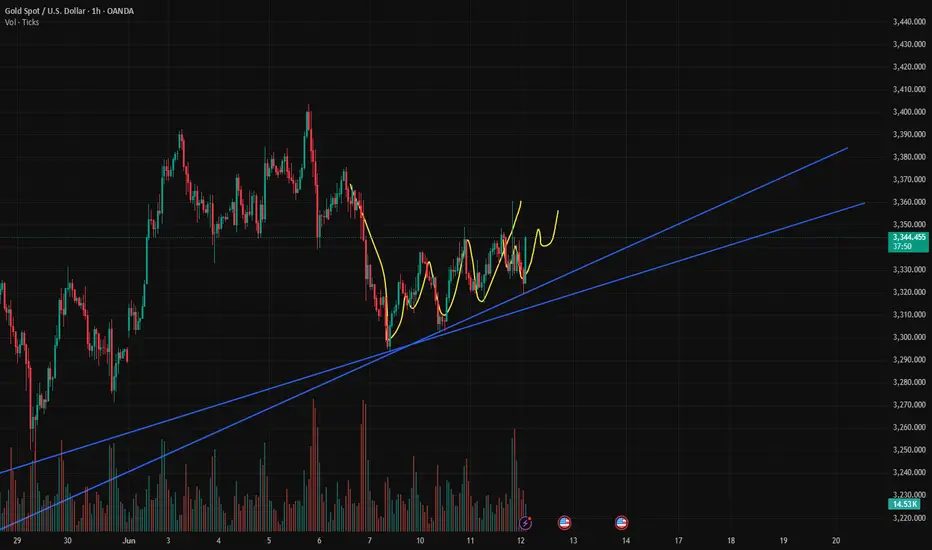
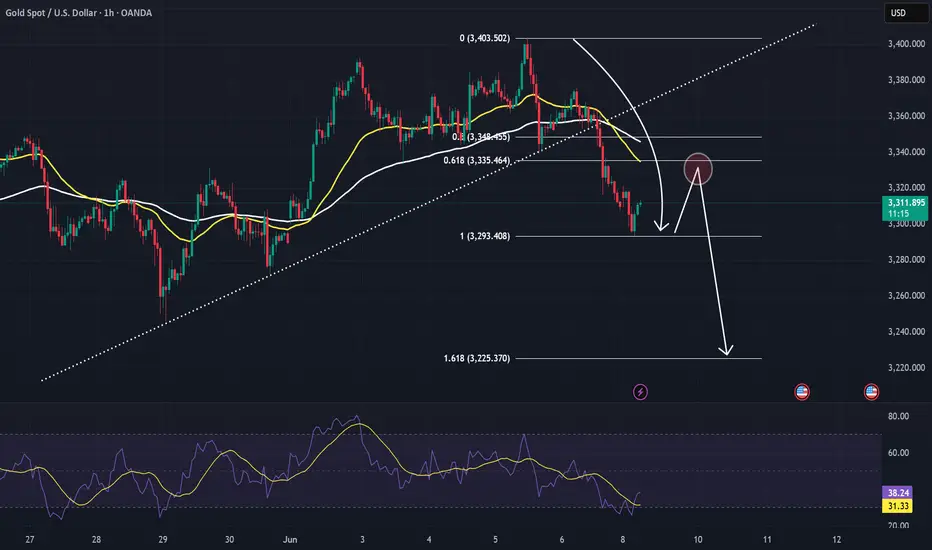
XAUUSD analysis - potential for pullback and continuationOANDA:XAUUSD is currently consolidating near $3,310 after a decisive breakdown below the ascending trendline, signaling a shift in the short-term structure from bullish to bearish. This breakdown was accompanied by strong bearish momentum, indicating that buyers have temporarily lost control of the market.
After the initial drop, the price is now attempting to retrace toward the 0.5–0.618 Fibonacci zone, with the 0.618 level located around $3,335. This zone also coincides with dynamic resistance from short-term moving averages (EMA cluster), making it an important confluence area. A rejection from this level would confirm a bearish retest, supporting the idea of a continuation toward the 1.618 Fibonacci extension near the $3,225 level.
However, if the price breaks and holds above $3,348, the bearish scenario will be invalidated, potentially signaling that buyers are regaining strength and may aim to reclaim higher resistance levels.
Traders are advised to wait for confirmation, such as a bearish engulfing candle, rejection wicks, or a surge in volume, before entering short positions. As always, this is a personal viewpoint, not financial advice. Trade with appropriate risk management.
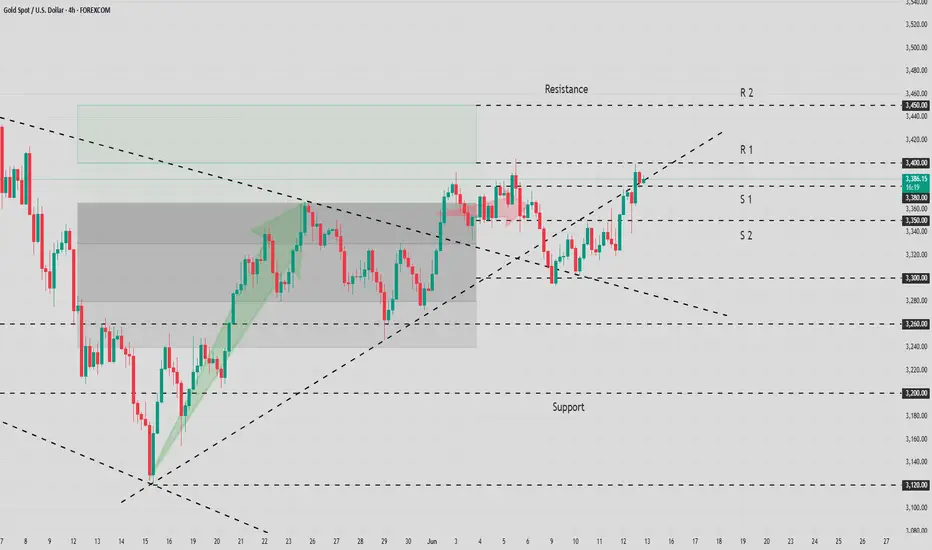
Analysis of Current Gold Trends and Trading RecommendationsYesterday, the daily K-line closed as a shooting star Doji with a long upper shadow, confirming a wide consolidation range between 3,300 and 3,350 for gold prices. In the short term, gold stabilizing above 3,250 is expected to maintain a mildly bullish trend within the consolidation, with focus on the 3,345-3,350 resistance zone today.
From a 4-hour perspective, support lies at 3,315-3,320. On pullbacks to this level, long positions can be considered for rebound continuation, while resistance stands at 3,350. The trading strategy remains centered on "buy low, sell high" within the 3,350-3,315 range.
Critical Monitoring: Closely track the progress of Sino-US trade negotiations and today's CPI data release, as both events may exacerbate market volatility and influence short-term trend direction.

XAUUSD: Volatile Uptrend Breaks Through Narrow RangeTechnical indicators are just references for the trend of gold, and the real market movement is driven by market sentiment.
The CPI data released today was lower than expected, which is a bullish signal for gold. The information on the U.S. 10-year Treasury bond auction released in the evening is bearish based on the data. In addition, news about various geopolitical conflicts are all influencing and driving market sentiment.
In the long term, gold is definitely trending upward. For short-term operations, technical analysis needs to be combined with the current market sentiment.
Today's various data have caused gold to show a volatile upward trend. After breaking through the resistance of the narrow range at $3,350 and reaching $3,360, it retracted to around $3,320. The current trading range is $3,300-$3,380.
XAU/USD
buy@3310-3320-3330
tp:3350-3360-3370
sell@3380-3370-3360
tp:3345-3335-3325
I am committed to sharing trading signals every day. Among them, real-time signals will be flexibly pushed according to market dynamics. All the signals sent out last week accurately matched the market trends, helping numerous traders achieve substantial profits. Regardless of your previous investment performance, I believe that with the support of my professional strategies and timely signals, I will surely be able to assist you in breaking through investment bottlenecks and achieving new breakthroughs in the trading field.

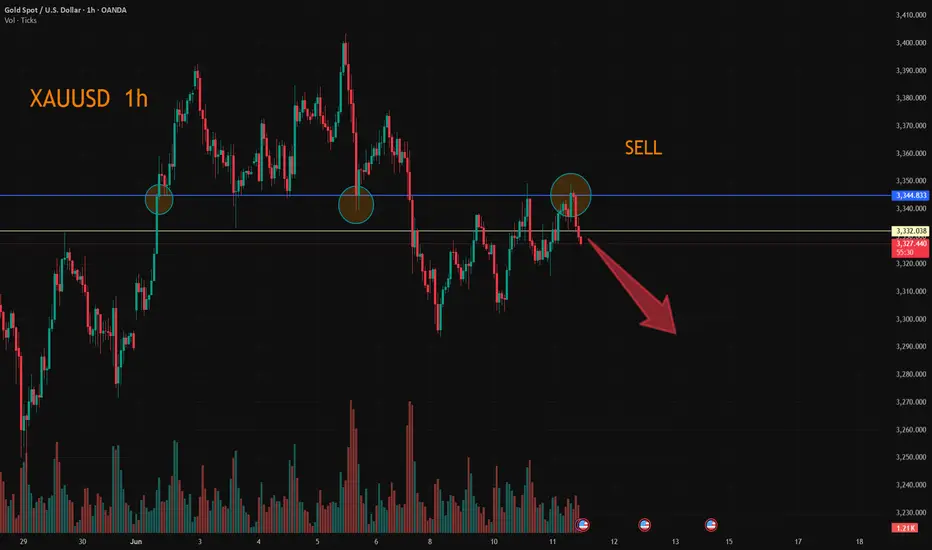
XAUUSD:Take a short position
Gold is currently under pressure around 3345 has been out of the decline, so today or the first short, the follow-up need to pay attention to a wave of decline after the rebound.
The current 3330-32 is also a short point.
Trading Strategy:
SELL@3330-32
TP:3315-10
↓↓↓ More detailed strategies and trading will be notified here ↗↗↗
↓↓↓ Keep updated, come to "get" ↗↗↗
How to plan for the positive effects of CPI data?📰 Impact of news:
1. CPI data is profitable
2. The US CPI rose slightly in May, and Trump's tariff effect has not yet fully emerged
📈 Market analysis:
The CPI data is bullish. The current gold price has risen to around 3360. We took profits at the 3330 level and exited the market, which once again confirmed the forward-looking nature of our trading vision. From a technical perspective, the RSI indicator in the short-term hourly chart is close to the overbought area. In the short term, pay attention to the upper resistance line of 3360-3365. If it rebounds to the 61.8% position and encounters resistance and pressure, consider shorting at high levels. On the contrary, if it effectively breaks through and stabilizes above, it is expected to touch the 3400 line. In the short term, pay attention to the lower support line of 3340-3330.
🏅 Trading strategies:
SELL 3360-3365
TP 3340-3330
If you agree with this view, or have a better idea, please leave a message in the comment area. I look forward to hearing different voices.
TVC:GOLD FXOPEN:XAUUSD FOREXCOM:XAUUSD FX:XAUUSD OANDA:XAUUSD

6/11 Gold Analysis and Trading SignalsGood afternoon, traders!
Gold remains capped below the key resistance at 3350, with repeated failed breakouts. Meanwhile, strong support zones below are keeping the price range-bound in a narrow consolidation channel.
📉 Technical Outlook:
As higher lows continue to form, the trendline support is gradually shifting upwards. On the 30-minute chart, we now observe a potential double top pattern forming. If confirmed, it would signal a bearish reversal with the possibility of further downside.
🔍 Key Support Levels:
Watch for the 3330 level as initial support. If it’s broken decisively and the market fails to recover quickly, this may confirm the short-term double top and open the door for more aggressive selling.
On a broader timeframe, focus on 3320 as a critical support area.
📊 Fundamental Focus:
The key event today is the release of U.S. CPI data, which carries significant market-moving potential. A strong reading could be bearish for gold, supporting a shift in sentiment toward the downside.
📌 Today’s Trading Plan:
✅ Buy Zone: 3289–3272
✅ Sell Zone: 3358–3373
🔄 Intraday Levels for Flexible Scalping:
3348 / 3332 / 3319 / 3307 / 3293
Trade cautiously ahead of the CPI report, and keep position sizes moderate to mitigate volatility risk.