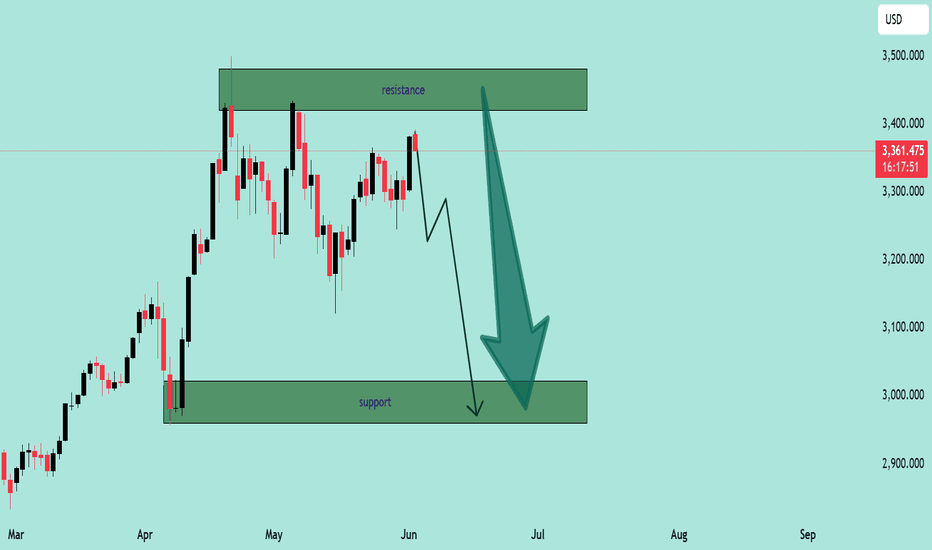
XAU/USD Bearish Rejection at Resistance – Potential Drop Ahead!XAU/USD Bearish Rejection at Resistance – Potential Drop Ahead! 💥
🔍 Technical Analysis:
Instrument: Gold vs US Dollar (XAU/USD)
Timeframe: Daily
Current Price: $3,363.26
Resistance Zone: $3,380 – $3,470
Support Zone: $2,970 – $3,100
🧠 Market Context:
Gold has recently approached a well-defined resistance zone near the $3,380–$3,470 range. Price action shows multiple rejection wicks and failed attempts to break above this level, indicating strong selling pressure from bears. 🐻
The current candlestick structure suggests the market is printing lower highs, which may indicate a transition from a consolidation phase into a potential bearish trend.
📉 Projection:
The chart projects a move down toward the support zone, around $2,970–$3,100, possibly due to:
Repeated rejections at the resistance zone 🔄
Lack of bullish momentum near highs ⚠️
Bearish engulfing or reversal candlestick formations 🔻
✅ Key Levels to Watch:
Level Type Price Zone Action
🔴 Resistance $3,380 – $3,470 Strong rejection expected
🟢 Support $2,970 – $3,100 Major demand zone; potential bounce
🧭 Trading Outlook:
⚠️ If price fails to break above the resistance zone, short opportunities may develop with a target near the support zone. A confirmed break and close below $3,300 would strengthen bearish sentiment.
📌 Bearish Bias Maintained Until Resistance Breaks
Xauusdsetup
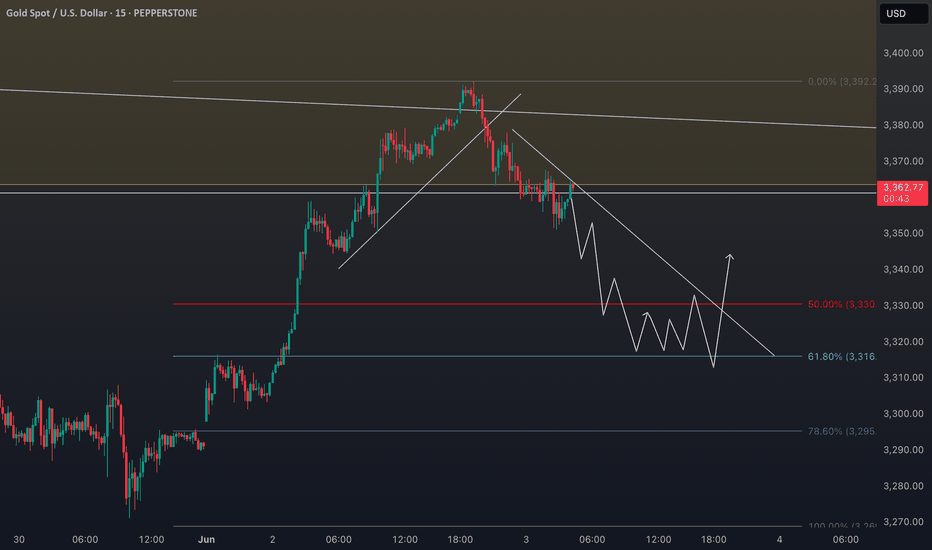
Buy or Sell XAUUSD Gold? How the Stock Market Could Decide!🚨 Market Breakdown: Gold (XAUUSD) 🪙📉📊
At the moment, I’m closely monitoring XAUUSD (Gold) 🔍. Before diving in, it's crucial to zoom out and gain a macro perspective 🌍. This means analyzing key support and resistance levels on the weekly and daily timeframes 📅 using price action as our primary guide.
📈 Gold has seen a strong rally — it’s overextended at this point. A deeper pullback could be on the cards. If we get that retracement alongside a bullish break of structure, I’ll be eyeing a potential long setup 🛒.
However, this bias is conditional 🔄. If the stock market pulls back, that could strengthen the case for a gold buy. On the flip side, if equities continue to rally, I’d likely shift toward a bearish stance on gold 🐻.
🎥 Everything is broken down clearly in the video.
❗️Disclaimer: This is not financial advice. The analysis shared is for educational and informational purposes only. Always do your own research and manage your risk accordingly.
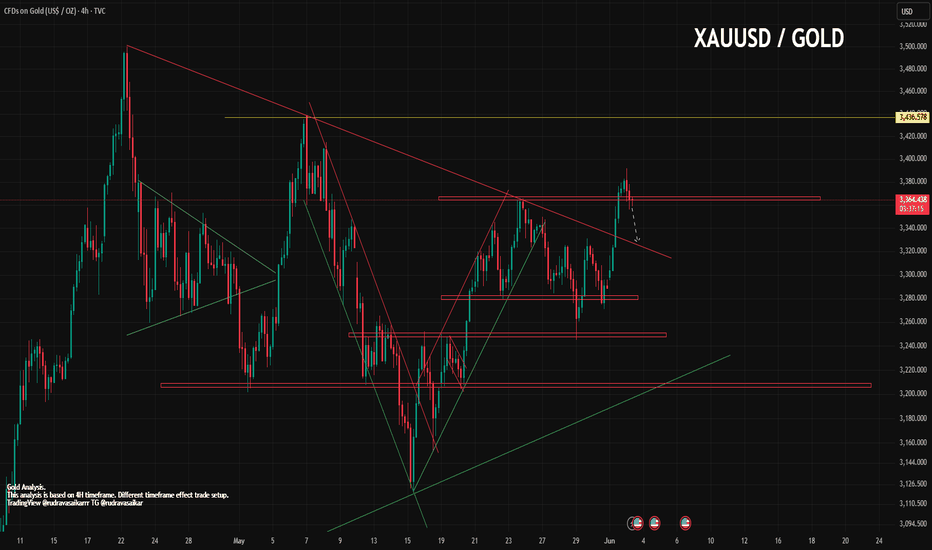
XAUUSD/Gold on 3rd May 2025As yesterday I posted that golds is in major uptrend and it is still active. On daily timeframe gold made breakout upward direction of channel and 3382. As I said gold made gap wile opening on Monday so it was strongly bullish, now we want it to fill the gap. And did it is first rejection and coming down. No gold is trading at 3360-65 range, and it is support, soon if it get's break toward downward then price can surge to 3323-3330. Waiting for confirmation and then execute trade.
Key point.
Support - 3364, 3330, 3313
Resistance - 3386, 3400, 3414
If you like it do follow and share.
Any Query Reach Us or comment down.
Follow for more updates.
Rudra Vasaikar Wishes You A Great And Very Amazing Trading Life. Trade Safe, Trade Right.
RISK WARNING 🔴 🔴 🔴
There is high risk of loss in Trading Forex, Crypto, Indices, CFDs, Features and Stocks. Choose your trade wisely and confidently, please see if such trading is appropriate for you or not. Past performance is not indicative of future results. Highly recommended - Information provided by Pro Trading Point are for Educational purpose only. Do your investment according to your own risk. Any type of loss is not our responsibility.
HAPPY TRADING.
#gold #xauusd #xauusdtrading #goldtrading #goldanalysis #forextrading #forex #trendline #goldsignals #goldnews goldlatestanalysis #xauusdtradesetup #forextradingguide #fxgold
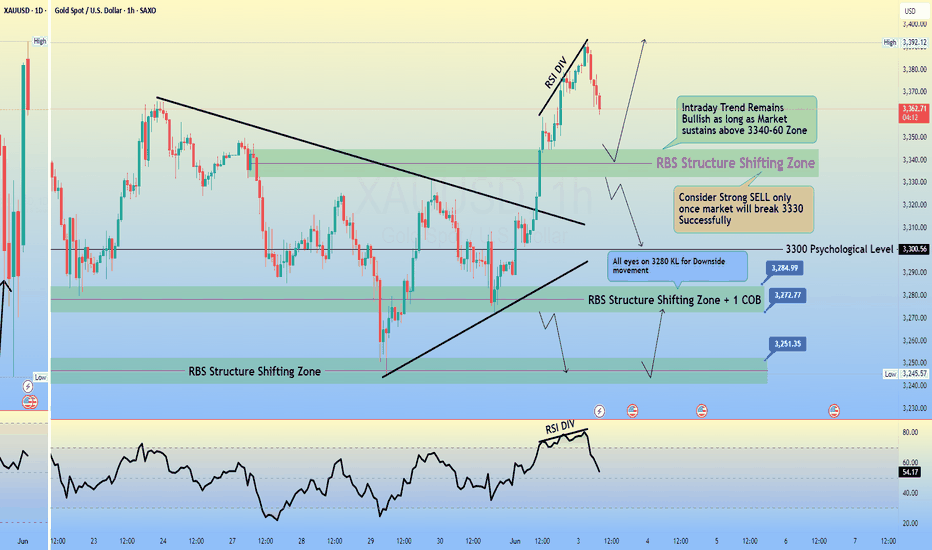
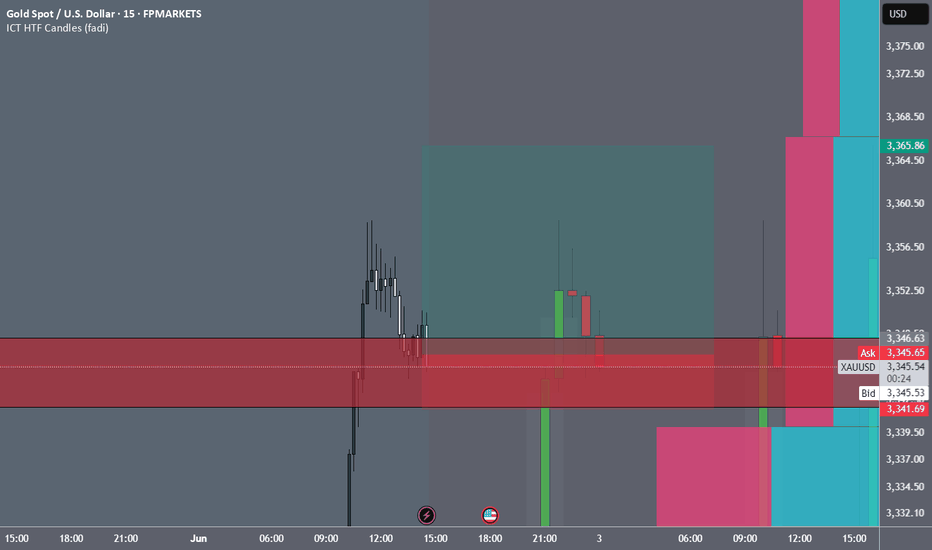
GOLD H1 Intraday Chart For 3 June 2025Hello Traders,
GOLD is in mid term Bullish Trend for now as we already captured nice pips yesterday with directional sequence
but now all eyes on 3400 Psychological Level Breakout once it will break market will move towards 3430
for market in is consolidation zone between 3340-60 and expected to move back towards 3380 or even 90
if market breaks 3330 successfully today then it will move towards 3330 Psychological Level
Disclaimer: Forex is Risky
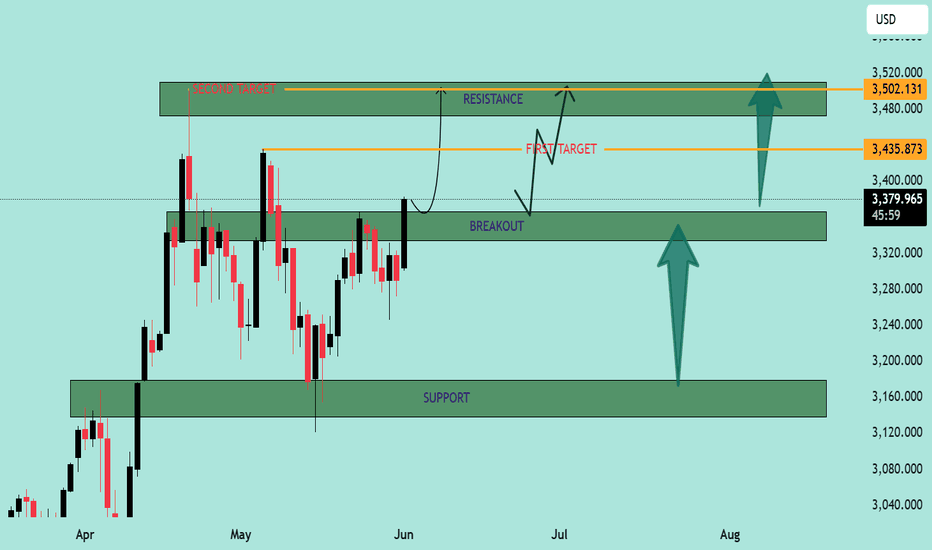
XAU/USD Price Action Analysis – Bullish Breakout Setup XAU/USD Price Action Analysis – Bullish Breakout Setup 🚀
🔍 Chart Overview:
This chart illustrates the price movement of XAU/USD (Gold vs USD) on a mid-term time frame, highlighting a potential bullish breakout scenario from a key resistance zone.
🟩 Key Levels:
Support Zone: 🛡️
➤ $3,140 – $3,200
This zone has acted as a strong support multiple times, preventing further declines and serving as a springboard for bullish moves.
Breakout Zone (Current Level): ⚡
➤ $3,340 – $3,390
Price is currently testing this crucial resistance-turned-potential-breakout zone. A successful close above this level could confirm bullish continuation.
First Target: 🎯
➤ $3,435.87
This intermediate resistance aligns with a previously tested high. It may act as the first barrier after the breakout.
Second Target: 🥇
➤ $3,502.13
This is the major resistance zone. If bulls maintain momentum, this area will likely be tested.
🧭 Market Structure & Bias:
Price is forming higher lows, signaling growing bullish strength.
The chart shows a bullish breakout of a sideways consolidation zone.
The upward arrows and curved projection suggest a potential pullback-retest scenario at the breakout level before rallying towards targets.
🧠 Trading Plan (Illustrated by Chart):
📈 Breakout Entry:
Wait for confirmation above $3,390 with strong bullish candles and volume.
🔁 Retest Opportunity:
If price pulls back to the breakout zone ($3,340 – $3,390), this may serve as a solid re-entry point for long positions.
🎯 Profit Targets:
TP1: $3,435
TP2: $3,502
🛑 Invalidation:
A strong close back below $3,320 may invalidate the bullish bias.
📌 Conclusion:
The chart indicates a bullish continuation setup for XAU/USD with clearly defined breakout, retest, and target zones. Traders should monitor price action closely around the breakout area for confirmation before entering long positions. Risk management remains key. 🧮⚖️
6/2 Gold Analysis and Trading SignalsGood evening, traders!
Gold surged more than $70 today, reaching an intraday high of 3363.
If you held short positions from last Friday’s close based on my plan, I hope your SL protected you from major losses.
📉 Technical Insight:
The rapid rally has triggered overbought signals and correction pressure
Watch for pullback support levels at:
3342
3328–3321 zone
If these hold, price might retest 3400 tomorrow
🎯 Trading Plan:
📉 Sell around 3360–3372 (with tight stop)
📈 Buy near 3328–3318 (if price stabilizes)
🔁 Scalp zones:
3332 / 3338 / 3343 / 3352 / 3366
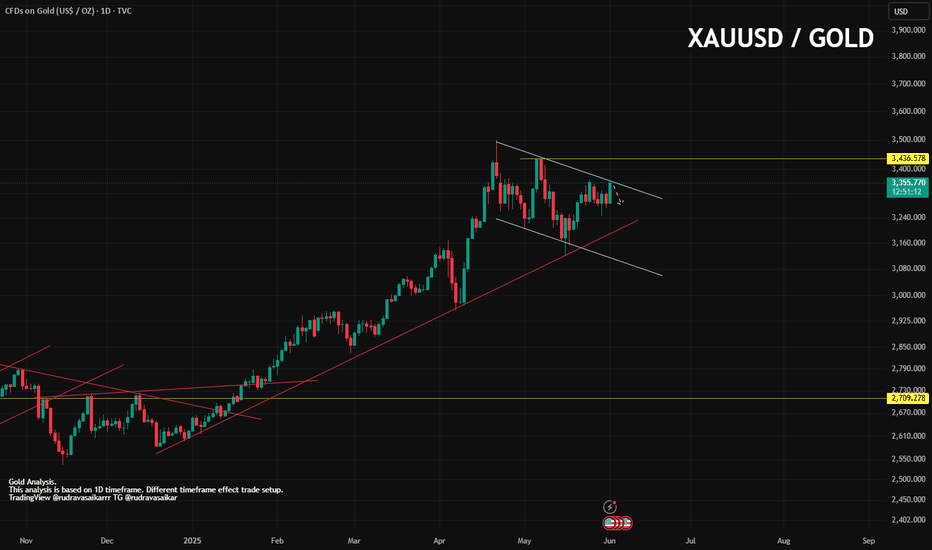
Gold 1D timeframe. What Next Moment?Hello everyone, I am back after 3 years. Finally I have decided to continue my trade journey in forex and crypto professionally.
Here is the analysis of XAUUSD/Gold.
Gold has taken a big bold moment of Uptrend since strong resistance breakout on march of 1st, 2024. Since that time Gold didn't looked back & continued it's rally in uptrend. So our major trend is Uptrend in 1D and 4H timeframe. Gold did some downtrend and sideway rally and again took another uptrend rally on Dec of 18th, 2024. Gold break all top high and made new high 3500.
If I talk in 1D timeframe gold is trading in bullish flag, and I am not wishing it right now to break upward. But has you know it is gold anything can happen. While today is Monday and market opening was in gap. So it needs to fill the gap after that we can execute a trade. Still now needs some confirmation that it will come down. So have patience and watch the market carefully.
Key point.
Resistance - 3356, 3369, 3396
Support - 3343, 3323, 3304
Any Query Reach Us or comment down
Rudra Vasaikar Wishes You A Great And Very Amazing Trading Life. Trade Safe, Trade Right.
RISK WARNING 🔴 🔴 🔴
There is high risk of loss in Trading Forex, Crypto, Indices, CFDs, Features and Stocks. Choose your trade wisely and confidently, please see if such trading is appropriate for you or not. Past performance is not indicative of future results. Highly recommended - Information provided by Pro Trading Point are for Educational purpose only. Do your investment according to your own risk. Any type of loss is not our responsibility.
HAPPY TRADING.
#gold #xauusd #xauusdtrading #goldtrading #goldanalysis #forextrading #forex #trendline #goldsignals #goldnews goldlatestanalysis #xauusdtradesetup #forextradingguide #fxgold
Here's a weekly buy-side analysis🟢 Bias: Bullish (Buy)
Gold remains in a long-term uptrend, with fundamental and technical factors supporting continued upside.
50 & 100 EMA: Price is well above both EMAs, confirming bullish momentum.
RSI: Around 60–70 on the weekly; no bearish divergence yet.
MACD: Histogram ticking upward with bullish crossover in play.⚠️ Risk Factors
Sudden USD strength due to surprise Fed hawkishness.
Strong U.S. labor or inflation data that pushes bond yields higher.
Gold profit-taking near ATH could cause sharp but temporary pullbacks.
GOLD H1 Chart Update For 2 June 25As you can see that there are some important zones mentioned on the chart
First read all details carefully market is in sideways for now once market will break 3330 level then it will move further higher towards 3360 even 3370
3300 Psychological Remains in focus once market breaks 3300 then it will try to fill the OPENING GAP which is due on 3289
for today if market sustains below 3280 level then it will move towards 3240-50 zone
Scalping or shorter term range in 3295-3320
Remember always use SL
Disclaimer: Forex is Risky
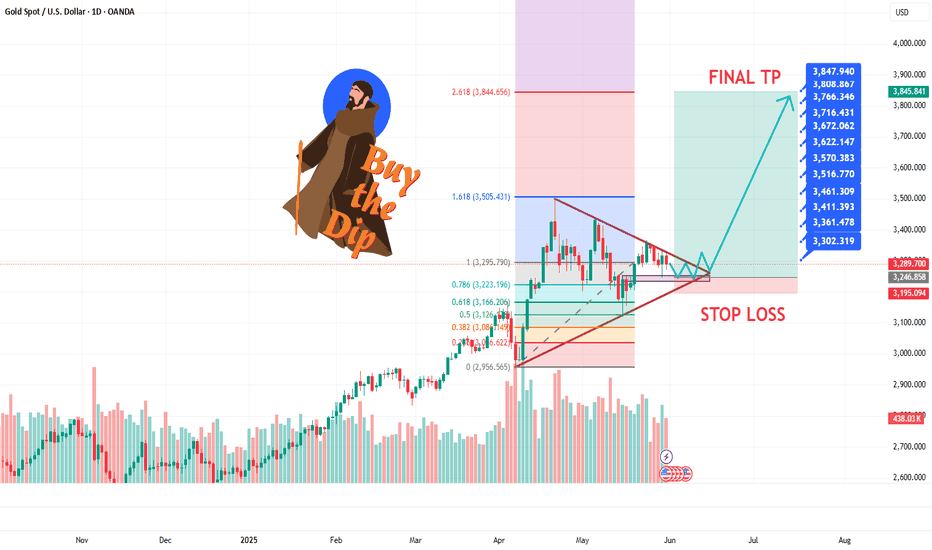
GOLD AND WAR NEXT TO 4K$Hello traders
as i can see gold is trading in a Decending Triangle zone and it had tested Fibo 0.61 ratio in month of may dip as we can see gold close monthly candle above 3280 zone which is a clear sign that big players and banks are still prefer Safe haven we can see US econmey in a bad recession zone unemployment and higher inflation is a big problrm for $ and on all these things Mr. Trump Tariffs is a game changer in commodities markets if we see Geopolitical issues around the world it esculating more war in diffrent regions of the world.. Now Israiel & US have a new biggest problem Iran which is showing us a attack on Iran can be happen incoming days as we can see 6 meetings was unsucessful in Oman for a Deal to Stop Iran's Nucler Enrichment Program which is not good... other then fundamental Charts are crystal clear and showing us a clear view for a New ATH on Gold our Risk reward ratio is prefect for us have a proper research before taking any trade its just an trade idea share your thoughts with us it will help many other traders Comments are open we love your comments and support the channel so it can diliver to many other new traders Stay Tuned for new updates ..
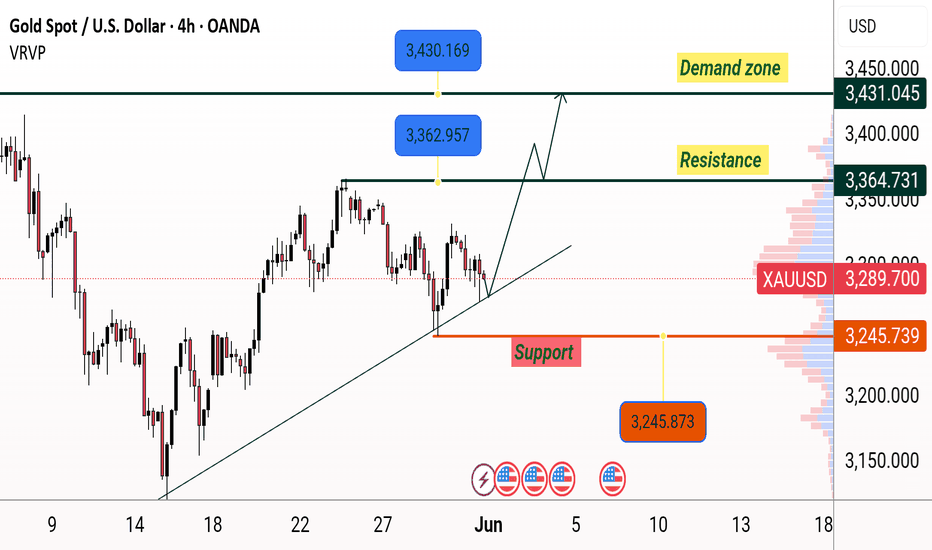
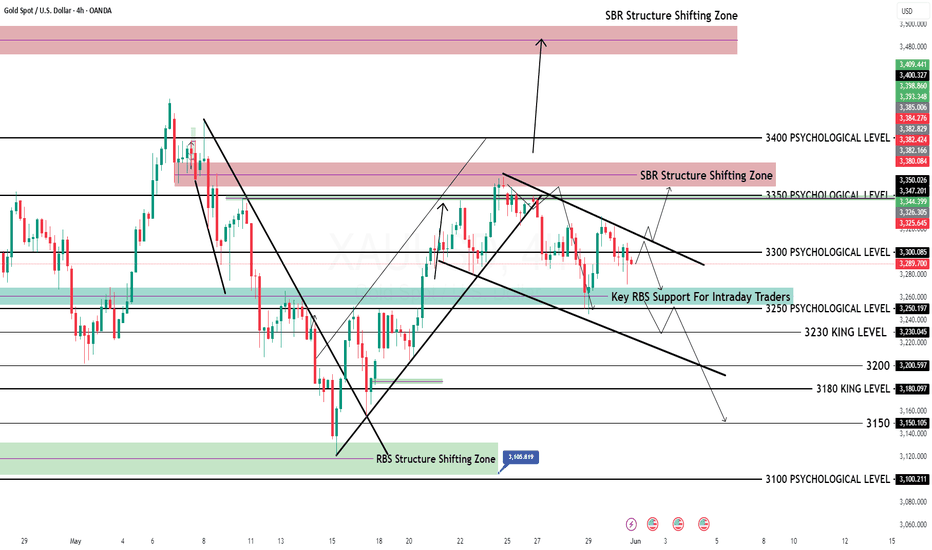
GOLD H4 Weekly Chart Update For 2-6 June 25Good day Traders,
as you can see that there are important zones mentioned
right now market is in sideways, key resistance zone for the upcoming week is 3350-70, market breaks resistance zone then it will move towards 3430
key support zone is 3240-50 for now, if market breaks support zone then it will move towards 3200 or even 3150
always Trade with SL
Disclaimer: Forex is Risky
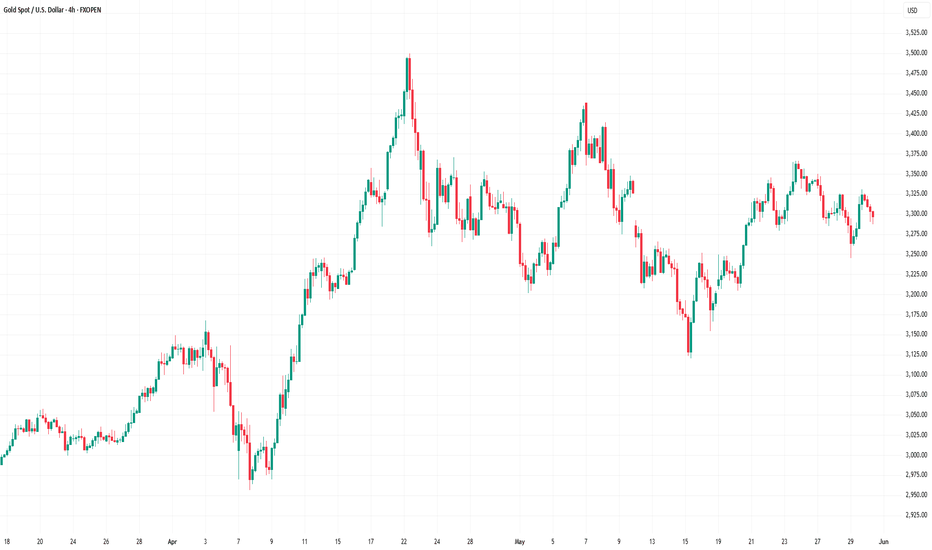
XAU/USD Chart Analysis: Gold Price Stabilises Around $3,300XAU/USD Chart Analysis: Gold Price Stabilises Around $3,300
Throughout May, a turbulent news backdrop — involving both international trade tariffs and armed conflicts — led to the formation of a peak around $3,430 and a low near $3,130 on the XAU/USD chart. As of today, the price per ounce stands around $3,300 — roughly the same level as at the beginning of the month.
This suggests that supply and demand forces are largely balanced, keeping the price contained between these extremes. The XAU/USD chart provides further confirmation, emphasising the significance of the $3,300 level.
Technical Analysis of the XAU/USD Chart
From a bearish perspective: The A→B→C→D→E sequence forms lower highs and lower lows — a clear sign of a downtrend. This trajectory is marked in red, with the upper line acting as resistance.
From a bullish perspective: Since the beginning of 2025, the gold price has been moving in an uptrend,indicated by a blue channel, with its lower boundary serving as key support (highlighted with arrows).
Notably, these support and resistance lines are converging, forming a narrowing triangle — an indication that supply and demand are balancing, finding consensus around the $3,300 level, where the axis of the triangle lies.
Given this, it is reasonable to assume that in June, the gold price on the XAU/USD chart may continue to fluctuate within this triangle — unless an extraordinary event causes a significant shift in the current balance.
This article represents the opinion of the Companies operating under the FXOpen brand only. It is not to be construed as an offer, solicitation, or recommendation with respect to products and services provided by the Companies operating under the FXOpen brand, nor is it to be considered financial advice.
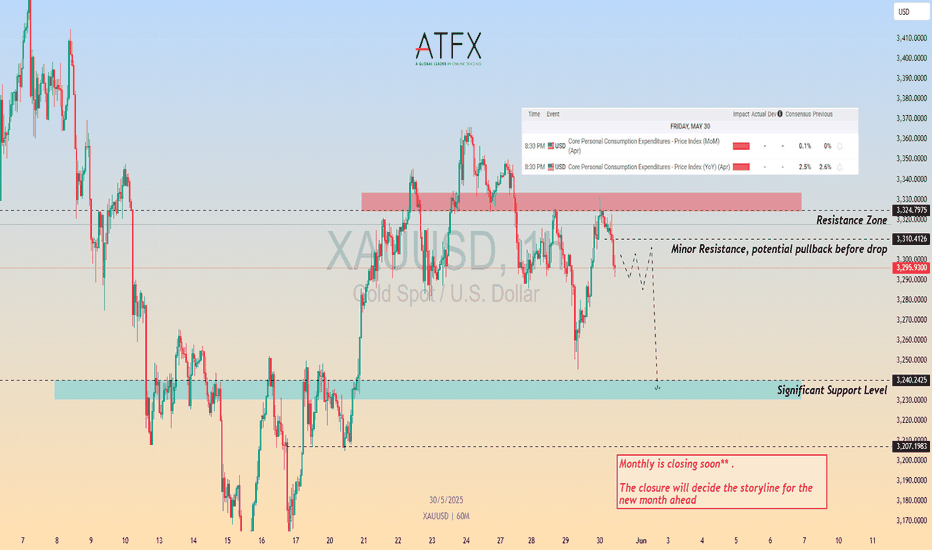
XAU/USD Awaits PCE Catalyst – Rejection or Breakout?Gold prices are trading around $3,297 after rejecting the $3,324 resistance zone. The market is currently showing signs of exhaustion near a minor resistance, and price action suggests a potential short-term pullback. Attention now shifts to today's U.S. Core PCE data, a key inflation metric for the Fed, which may dictate near-term direction and shape the monthly close.
OANDA:XAUUSD TVC:GOLD Gold tested the $3,324 resistance area but failed to break higher, forming a lower high. A potential bearish setup is developing as price reacts to minor resistance around $3,310. If bears regain control, a drop toward the key support level at $3,240 is likely. A break below this level could open the door to further downside in the upcoming sessions. Conversely, if bulls manage to reclaim $3,324 and establish a strong daily close above, we could see a retest of $3,350 and higher.
Key Event Today:
At 8:30 PM GMT+8, the U.S. will release April's Core PCE Price Index – the Fed’s preferred inflation gauge:
MoM: Expected at 0.1%
YoY: Expected at 2.5% (Previous 2.6%)
A softer-than-expected reading could increase rate cut expectations and offer bullish momentum to gold. Stronger data, however, may renew USD strength and pressure XAU/USD lower.
Resistance: $3,310 , $3,324
Support: $3,240 , $3,207
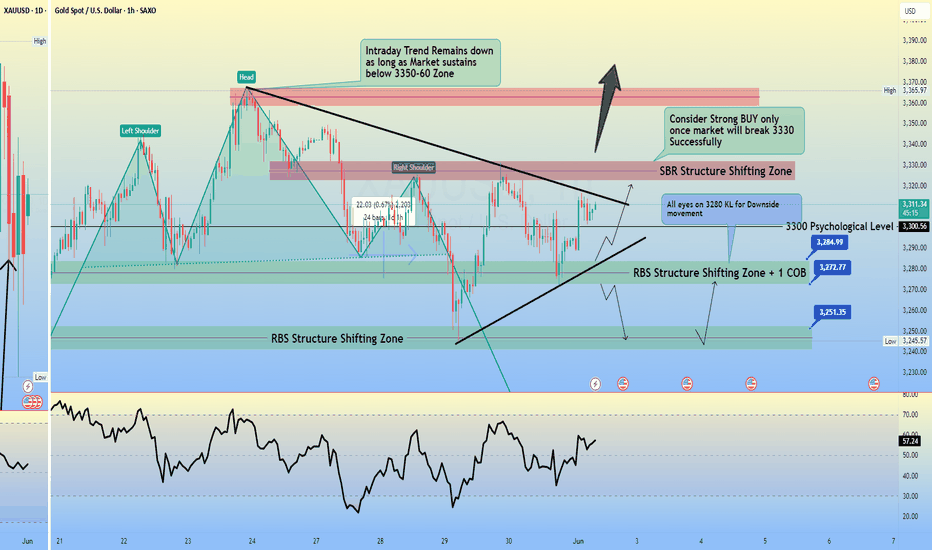
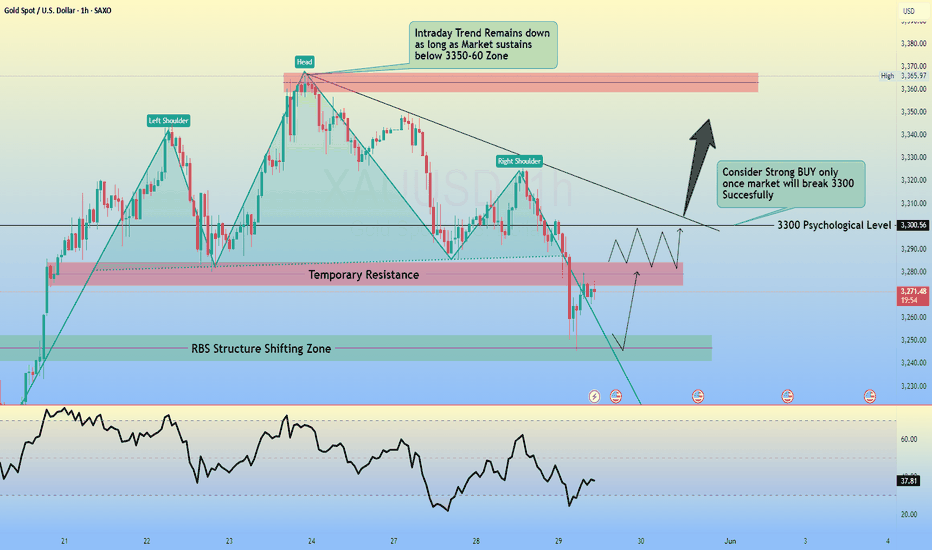
GOLD H1 Intraday Chart Update For 29 May 2025As you can see that there are some strong zones mentioned in chart
Intraday Trend remains down because market sustains below 3300 Psychological level
once market will break 3300 psychological level successfully then move towards 3335
Scalping Range is 3250-3280
if Market breaks 3250 level it will move towards 3200
Disclaimer: Forex is Risky
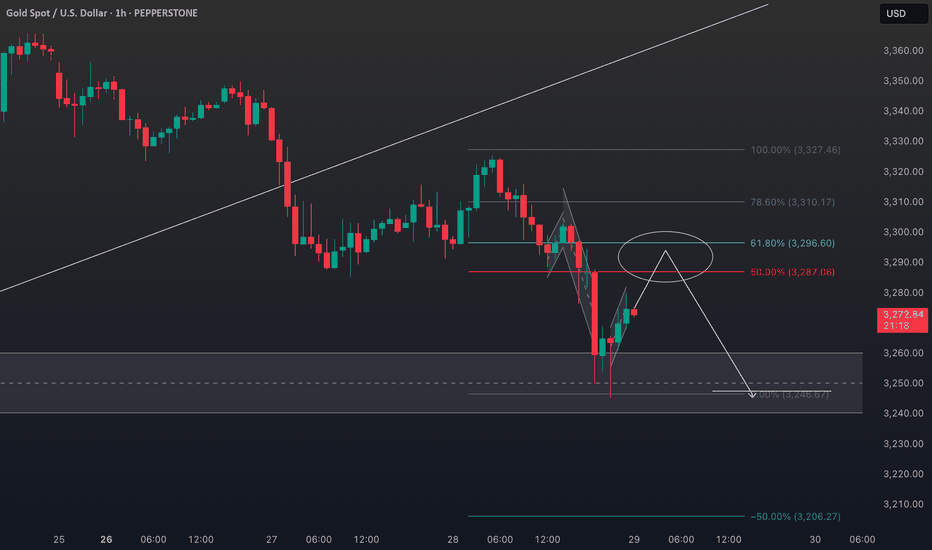
XAUUSD Idea: Structure, Fibonacci Setup & S&P 500 Correlation📉 XAUUSD Trade Outlook 🧠🔍
Currently analyzing Gold (XAUUSD), and things are getting interesting. On the daily timeframe, we’ve seen a clear bearish break of market structure, and this shift is also evident on the 4-hour chart. 🕰️📉
I’m watching closely for a bullish retracement into my key Fibonacci 61.8% level, where I’ll be looking for confirmation of a bearish structural break to initiate a short position. 🎯🔽
When we compare this setup to the US500 (S&P 500), it becomes even more compelling. The indices have rallied hard and appear overextended — a correction seems likely. 📊🧾
If we do get that pullback in the indices, gold may rally temporarily, but my overall bias remains bearish. If the indices resume their uptrend after a pullback, I expect gold to weaken further, aligning with my current short-side outlook. ⚠️📉
🛑 This is not financial advice. Always do your own analysis and manage risk according to your trading plan.
💬 What are your thoughts on gold right now? Are you leaning bullish or bearish? Let me know in the comments! 👇
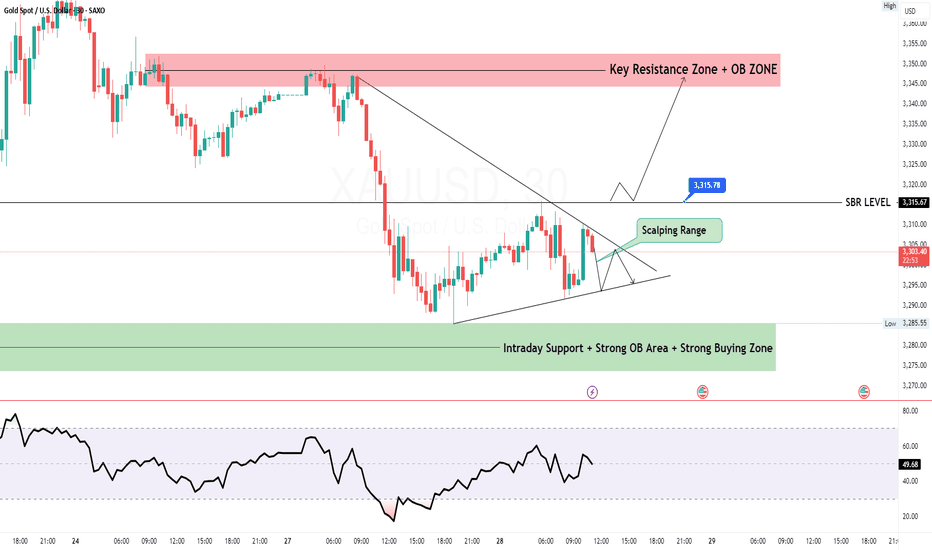
GOLD M30 Intraday Chart Update for 28 may 2025Hello Guys, as you can see that GOLD intraday chart just shared with levels
you may do some scalping in the ranging zone, however today strong zone is 3265-3280 which also buying zone but must check confirmation before enter
as well as once market will break SBL level then you may also look long position
Remember always trade with SL
Disclaimer: Forex is Risky
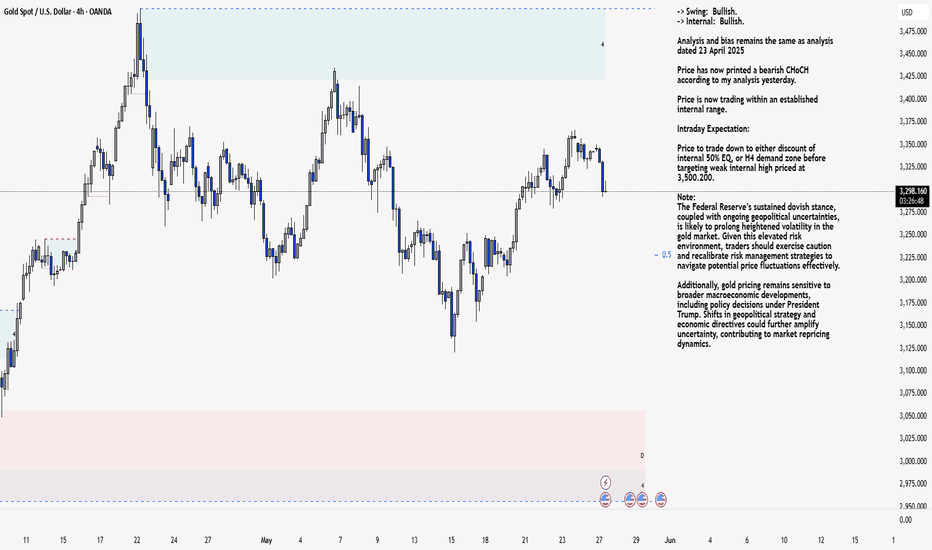
XAU/USD 27 May 2025 Intraday AnalysisH4 Analysis:
-> Swing: Bullish.
-> Internal: Bullish.
Analysis and bias remains the same as analysis dated 23 April 2025
Price has now printed a bearish CHoCH according to my analysis yesterday.
Price is now trading within an established internal range.
Intraday Expectation:
Price to trade down to either discount of internal 50% EQ, or H4 demand zone before targeting weak internal high priced at 3,500.200.
Note:
The Federal Reserve’s sustained dovish stance, coupled with ongoing geopolitical uncertainties, is likely to prolong heightened volatility in the gold market. Given this elevated risk environment, traders should exercise caution and recalibrate risk management strategies to navigate potential price fluctuations effectively.
Additionally, gold pricing remains sensitive to broader macroeconomic developments, including policy decisions under President Trump. Shifts in geopolitical strategy and economic directives could further amplify uncertainty, contributing to market repricing dynamics.
H4 Chart:
M15 Analysis:
-> Swing: Bullish.
-> Internal: Bearish.
Analysis and bias remains the same as analysis dated 22 May 2025.
In my analysis from 12 May 2025, I noted that price had yet to target the weak internal high, including on the H4 timeframe. This aligns with the ongoing corrective bearish pullback across higher timeframes, so a bearish internal Break of Structure (iBOS) was a likely outcome.
As anticipated, price targeted strong internal low, confirming a bearish iBOS.
Price has remained within the internal range for an extended period and has yet to target the weak internal low. A contributing factor could be the bullish nature of the H4 timeframe's internal range, which has reacted from a discounted level at 50% of the internal equilibrium (EQ).
Intraday Expectation:
Technically price to continue bullish, react at either premium of internal 50% EQ or M15 demand zone before targeting weak internal low priced at 3,120.765.
Alternative scenario:
Price can be seen to be reacting at discount of 50% EQ on H4 timeframe, therefore, it is a viable alternative that price could potentially print a bullish iBOS on M15 timeframe.
Note:
Gold remains highly volatile amid the Federal Reserve's continued dovish stance and persistent geopolitical uncertainties. Traders should implement robust risk management strategies and remain vigilant, as price swings may become more pronounced in this elevated volatility environment.
Additionally, President Trump’s recent tariff announcements are expected to further amplify market turbulence, potentially triggering sharp price fluctuations and whipsaws.
M15 Chart:
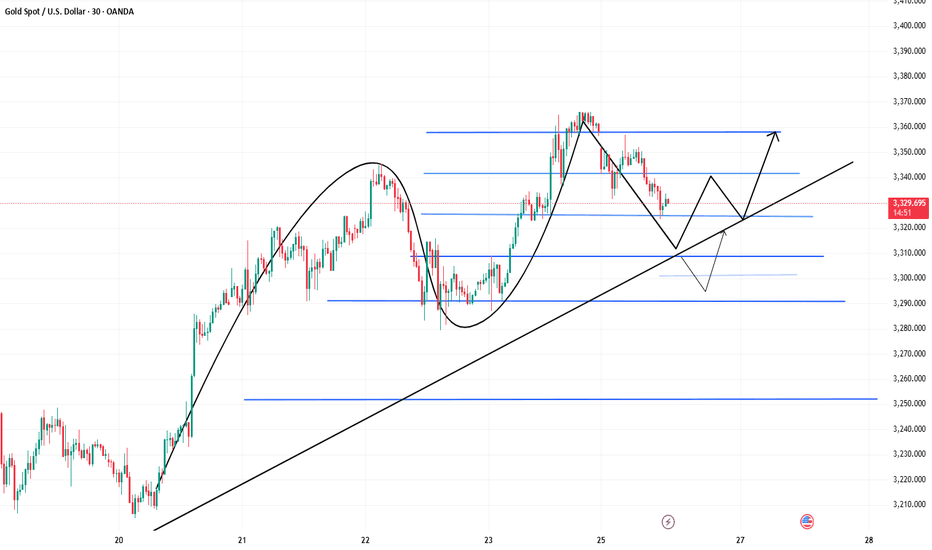
Gold Pullback as Expected, Range Trading ContinuesAs I clearly stated last Friday, key resistances are located at 3366 and the stronger zone between 3376–3391. On Friday, the price peaked near 3366 without touching the second resistance band, followed by a pullback — a natural result of recent buying pressure being released and previous trapped positions being closed out.
🎯 Congratulations to those who carefully followed and executed the strategy — you should have captured solid profits from this retracement!
🔍 Current Technical Outlook:
✅ A wave of selling has already been absorbed. Now we watch:
Support strength — if key levels hold, scalping on dips remains valid;
Rebound momentum — short-term indicators favor a bounce, though medium-term structures are still being repaired;
Focus zone: 3355–3357 is a newly created gap resistance, critical for today’s action;
Previously broken supports (3346–3338 and 3324–3318) now serve as resistance and should be watched during any upside attempt.
📈 Trading Strategy:
Today’s price range is relatively contained — stick to selling near resistance, buying near support. If there are any major changes or new developments, I’ll update everyone in time.
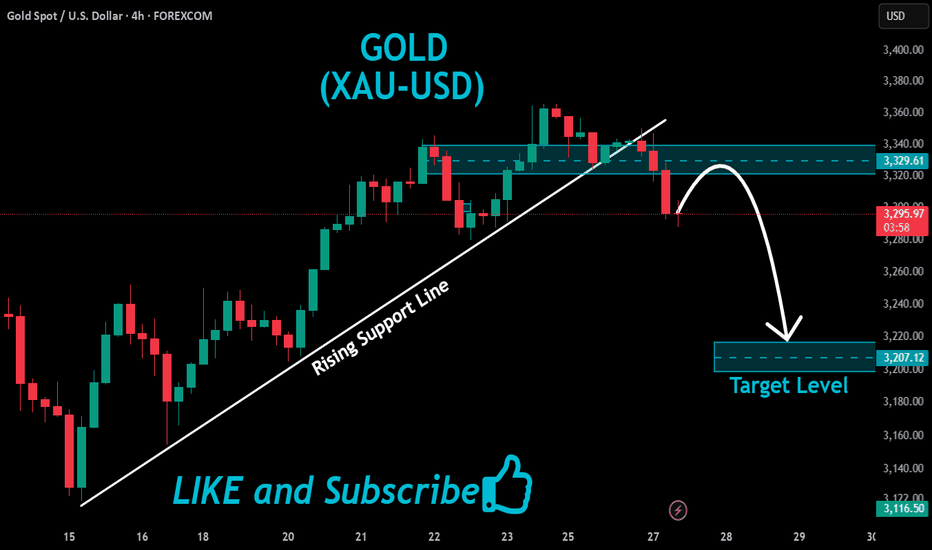
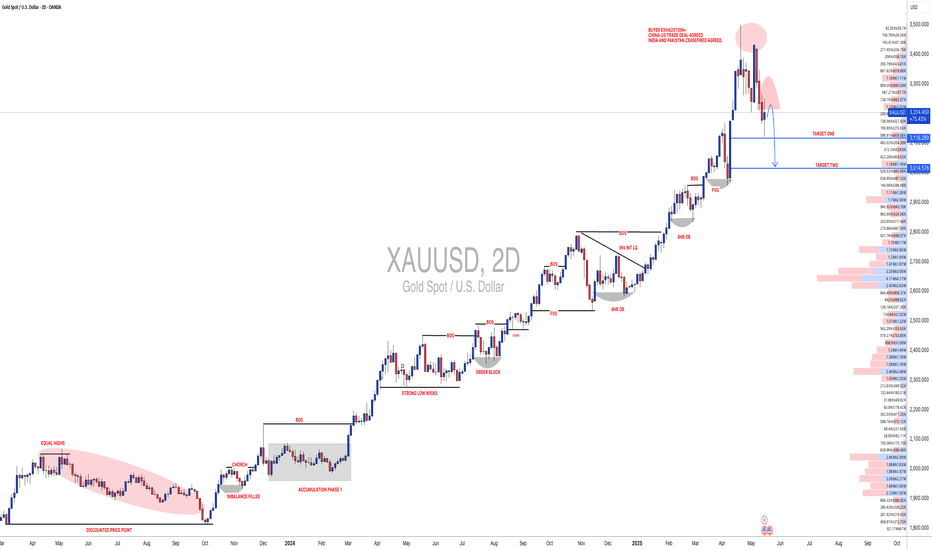
#XAUUSD: +2000 Pips Correction US-China Trade Deal ConfirmedGold has experienced a significant decline in recent days, primarily due to fundamental market factors that have caused its price to fall from 3430 to 3209, resulting in a loss of approximately 2210 pips. Consequently, we recommend that you consider selling Gold if it aligns with your analysis and assessment. It is imperative that you implement strict risk management measures while trading Gold.
It is important to note that this analysis does not guarantee a price decline or that the market will behave as described. Therefore, we strongly advise you to conduct thorough trade planning before making any trading decisions.
We extend our sincere gratitude for your unwavering support over the years.
Our primary objective is to assist you in making well-informed decisions. Therefore, we encourage you to contact us if you have any inquiries or require further information.
Additionally, we would be delighted to receive your insights on which cryptocurrency pair you would like to explore next. Please do not hesitate to share your preferences.
Best regards,
Team Setupsfx_
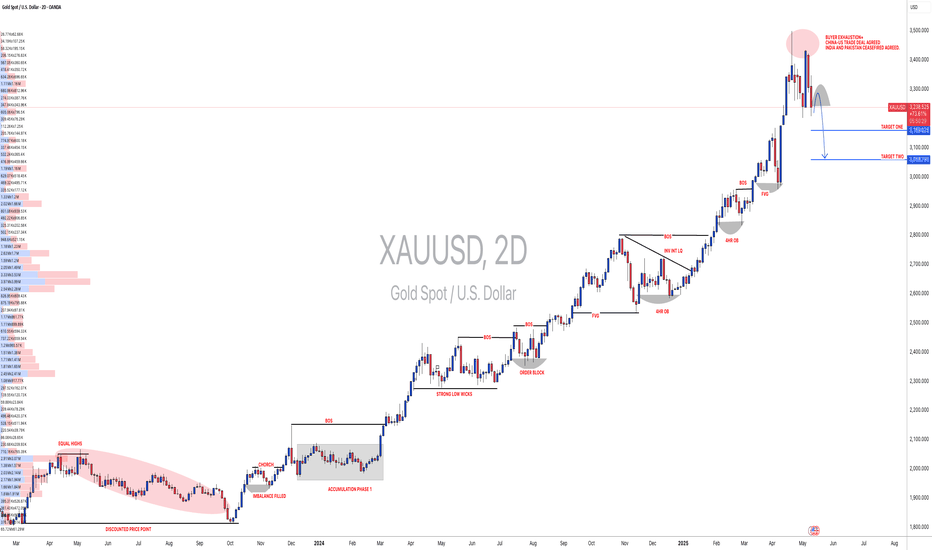
XAUUSD[GOLD]: Another Possible Swing Sell Happening! Swing MoveGold rejected twice as we had described in our last two analyses on Gold. We remain heavily bearish on Gold and expect a swift bearish move within the next week or following week. We are eyeing two targets. Please use this analysis accordingly and avoid overtrading. This is not a confirmation, and do not use the marked arrow as an entry or exit point. The marked red area drawn there represents a potential reversal zone from which price may reverse.
As always, this analysis does not guarantee that price will move as described in the chart. Please use your own knowledge and trading plan while trading Gold. Good luck and trade safely.
Want to support us? Do the following ❤️
-LIKE THE IDEA
-COMMENT YOUR VIEW
-SHARE IF YOU AGREE
Much love ❤️
Team Setupsfx_
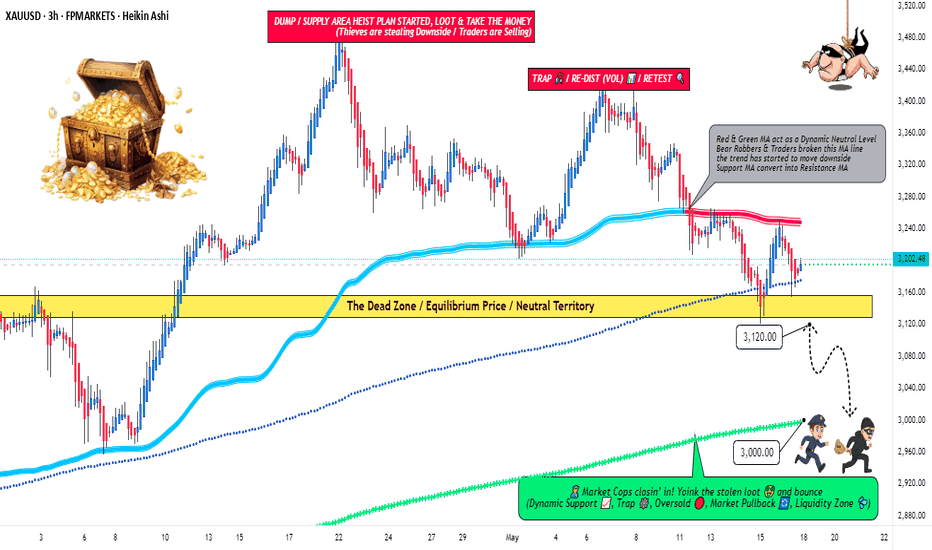
Gold Heist Blueprint: "XAU/USD" Short Setup!?Greetings, wealth snatchers and market bandits! 🤑💸
Welcome to the Thief Trading Style, where we combine slick technicals and crafty fundamentals to pull off the ultimate XAU/USD heist. This is our plan to raid the "Gold" market with a short entry, targeting the high-stakes GREEN MA Zone. Expect a risky, oversold setup with consolidation and a potential trend reversal—a trap where bullish robbers get outplayed. 💪🎯 Stick to the chart, execute with precision, and treat yourself to the spoils! 🍾
Why This Trade? 💰
XAU/USD is showing a neutral trend with a bearish tilt as of 18 May 2025, driven by:
📊Technicals: Price is testing a key support zone (~3120) after a breakout from a consolidation pattern on the 30-minute chart. Oversold RSI signals a potential reversal, with the Pink MA (50-period) acting as dynamic resistance.
📰Fundamentals: Recent COT reports indicate reduced speculative long positions, hinting at weakening bullish momentum. Quantitative analysis suggests gold’s correlation with USD strength is tightening, supporting a bearish outlook.
😇Sentiment: Intermarket analysis shows rising Treasury yields pressuring gold, while market sentiment leans cautious ahead of upcoming economic data releases.
💡Data Point: Gold’s average daily range (ADR) over the past 5 days is ~35 points, aligning with our target and stop-loss levels for a day/scalp trade.
Entry 📈: Set your trap at 3120 post-breakout.
Option 1: Place sell stop orders below the support breakout level (~3115) for confirmation.
Option 2: For pullback entries, set sell limit orders near the swing low/high on a 15/30-minute timeframe.
Pro Tip: Set an alert to catch the breakout in real-time. Don’t miss the heist! 🚨
Stop Loss 🛑: Protect your loot!
Place your stop loss above the nearest swing high (~3270) on the 30-minute chart for day/scalp trades.
Adjust based on your risk tolerance, lot size, and number of orders.
Note: If using sell stop orders, wait for breakout confirmation before setting your stop. Risk is yours—play it sharp! 🔥
Target 🎯: 3000 (120-point move, aligning with ADR and support zones).
Trading Alert 🚨:
News Risk: Upcoming economic releases (e.g., CPI, FOMC minutes) could spike volatility. Avoid new trades during high-impact news and use trailing stops to lock in profits.
Position Management: Scale out at key levels (e.g., 50% at 3060) to secure gains.
Join the Heist! 💥
Hit the Boost Button to power up our robbery squad. With the Thief Trading Style, we make markets bleed profits daily. 🏆 Stay sharp, follow the plan, and let’s stack those wins! Another heist is coming soon—keep your eyes peeled. 🐱👤💰
Check fundamentals, COT reports, and intermarket trends for deeper insights.
check linkkss..🔗
Happy thieving! 🤝🚀
