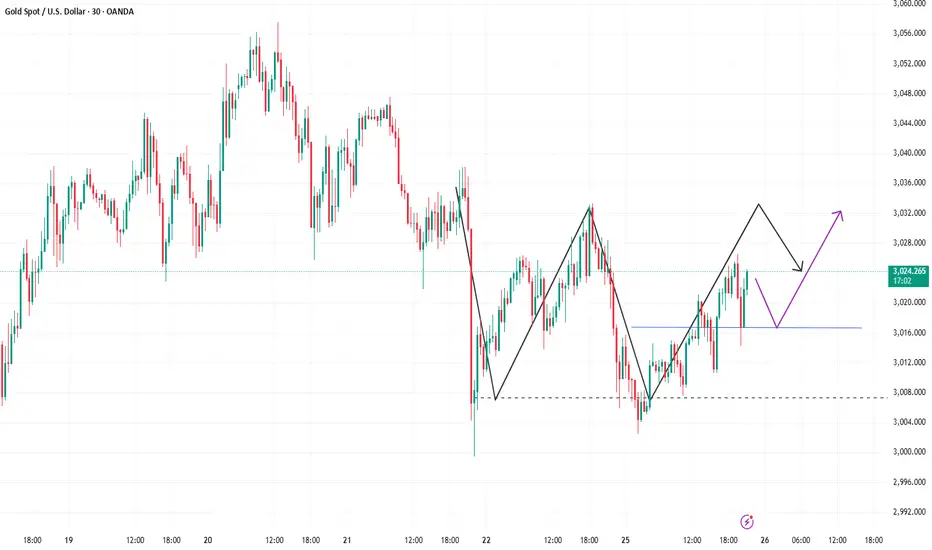
Gold signal: Go long first and then go shortThe gold 3H chart shows signs of upward movement, and the 30M chart forms a double bottom. Currently, the resistance near 3023 is also trying to break through. You can try to go long, and pay attention to the support in the 3018-3013 area.
Xauusdsetup
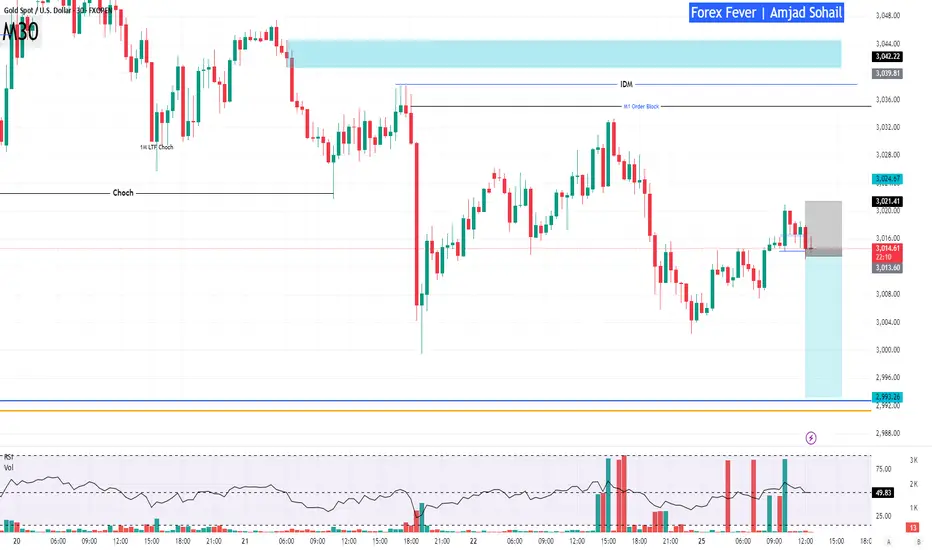
XAUUSD, Expecting sell now XAUUSD, I am expecting Gold sell now at the price 3015, with the targets of 3004 & 2992 area respectively,
good luck
Current Analysis and Forecast of Gold PriceOn Monday, the price of gold exhibited relatively subdued behavior, largely oscillating within a narrow trading band.
During the European trading session, the yellow metal briefly ascended to test the $3,033 resistance level. Subsequently, in the US trading session, it encountered a significant pullback, with prices temporarily dipping to a low of $3,002.
Despite the emergence of a rebound, the momentum behind it appears lackluster. Looking ahead, in the subsequent trading, gold is anticipated to consolidate within the range of $3,000 - $3,030.
XAUUSD
sell@3025-3035
tp:3010
buy@3000-3010
tp:3030
I will share trading signals every day. All the signals have been accurate for a whole month in a row. If you also need them, please click on the link below the article to obtain them.
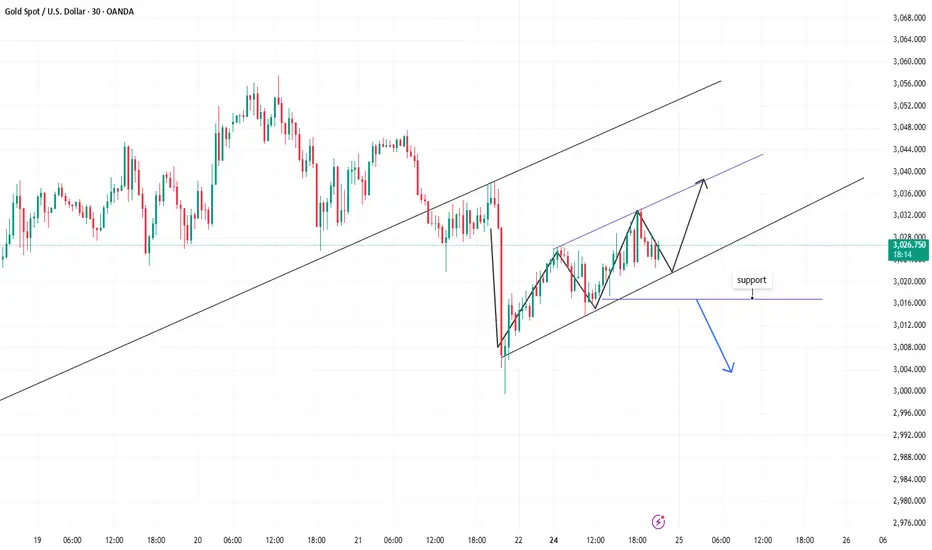
3/25 Gold Signal: 3009-3023 short, 2996-2982 longThe gold price rose above 3012. The long orders entered near 3004-2996 before the closing are currently profitable. From the trend pattern, there is still room for rebound, but it will take some time. During this process, the price may fluctuate. For friends who have already made profits, it is not worthwhile to bear the risk of profit taking, so this order can be closed first. Of course, if you don’t mind this risk, you can continue to hold it. I expect the rebound resistance to be around 3018.
In terms of the current big trend, the better long opportunities may be more inclined to the 2996-2982 area, because this is the starting point of the previous rise, and it can be regarded as a strong support platform. Usually in this case, the probability and amplitude of the rebound will be higher. Of course, if there is a reverse impact from news, asymmetric fluctuations are also possible.
Today’s main focus is the integer support of 3000. If it falls below, consider the support of the large range of 2996-2982, and the second is the resistance of the range of 3015-3023 during the current rebound.
The overall trading plan is that if the price falls below 3000, long positions will be opened in batches in the 2998-2986 range. If the rebound cannot break through 3023, short positions will be traded in batches in the 3009-3021 range.
I will update the specific transaction details in real time, so you can check them in time. If you have any questions, please leave a message at any time.

Gold: New York session, longIn the New York session, gold is mainly low-long. Pay attention to the support level. If it falls below, close the order in time.
Is Gold Ready to Drop? Key Levels & Strategy for the Next Move!📉🔥 Right now, XAUUSD (Gold) is pulling back from the highs and consolidating in a range. I'm watching for a buy opportunity if price breaks below the current range low and retraces into the previous swing equilibrium.
🎯 In the video, we dive into imbalances as key pullback targets, analyze price action and market structure, and discuss a potential trade setup—if the market presents the right conditions.
🚨 Not financial advice—trade smart! 🚀

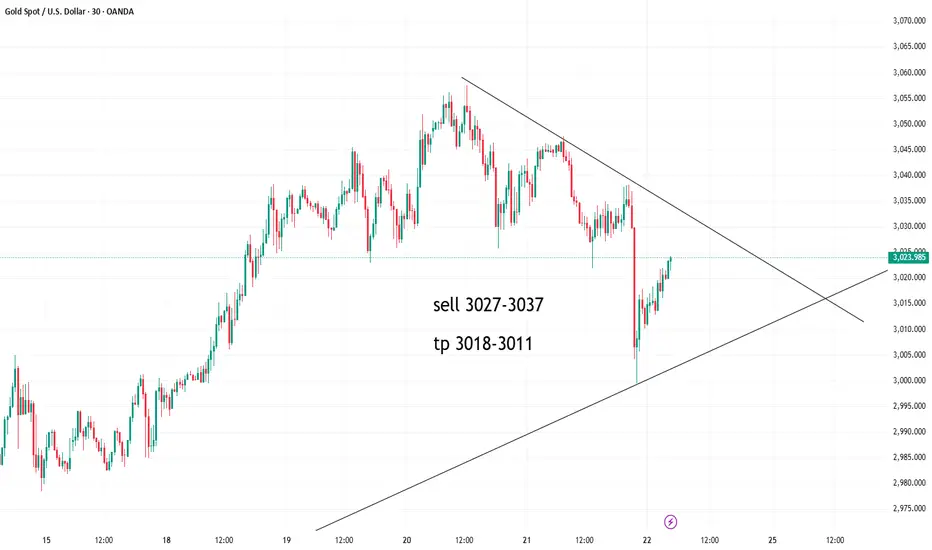
Golden Signal: Go Short in the 3027-3037 AreaLast Friday, gold rebounded to near resistance. Although the indicator in the 30M level chart shows that there is still some rebound momentum, the space is not very large, because the head and shoulders pattern has appeared in the early stage, and the pressure on the bulls is still very large.
Therefore, in the intraday trading on Monday, we can focus on short trading around the resistance area of 3027-3040. The single needle bottoming provides good support, so TP does not need to be set too large for the time being. The previous rising point of 3007 is used as a reference support, and TP is controlled in the range of $10-$16. Personally, it is expected to be in the 3018-3011 area.
I will update the specific trading information during the intraday, please pay attention to the content of the intraday update. If you have any questions, you can leave me a message, and I will reply to you in time when I see it.
I wish you all a prosperous new week!
3/24 Gold Trading Signal: 3027-3037 Range ShortThe market has opened. As mentioned in the previous article, gold still has a rebound. Under the current circumstances, our main focus is the resistance area of 3027-3037. I personally think that the probability of a direct breakthrough is not high, so we maintain the trading idea of shorting in this range.
During the decline, 3018/3015/3011/3007 are the support levels that need to be paid attention to.
If you have any questions, you can leave me a message. I will reply in time after I see it. In the new week, I wish you all a lot of money!


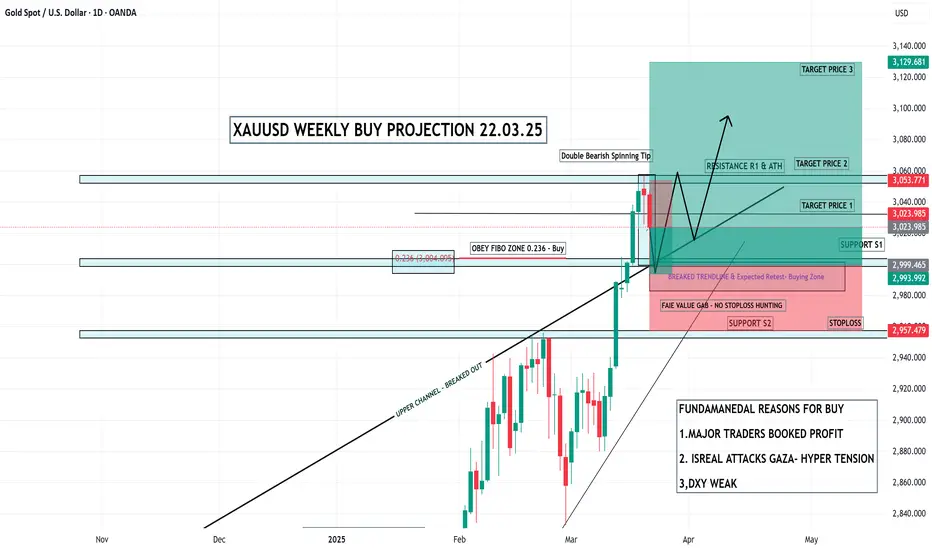
XAUUSD/GOLD WEEKLY BUY PROJECTION 23.03.25Gold's recent bullish trend is largely driven by factors like geopolitical uncertainty, inflation concerns, and central bank actions, which lead investors to seek the perceived safety of gold as an asset.
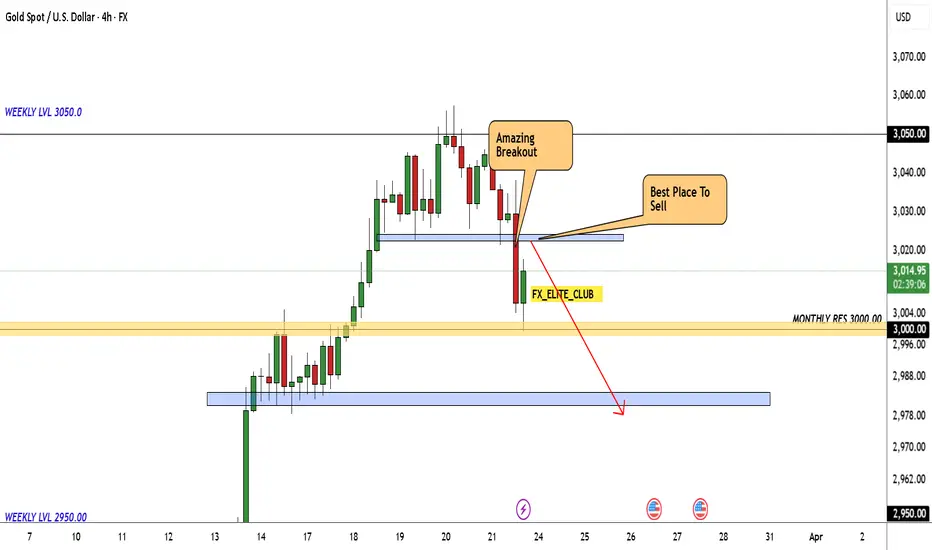
GOLD Finally Gave Bearish P.A , Short Setup Ready For You !Here is my opinion on Gold , and now the price closed below my support , and i`m waiting the price to retest it to enter a sell trade to take this 500 pips .
This Is An Educational + Analytic Content That Will Teach Why And How To Enter A Trade
Make Sure You Watch The Price Action Closely In Each Analysis As This Is A Very Important Part Of Our Method
Disclaimer : This Analysis Can Change At Anytime Without Notice And It Is Only For The Purpose Of Assisting Traders To Make Independent Investments Decisions.
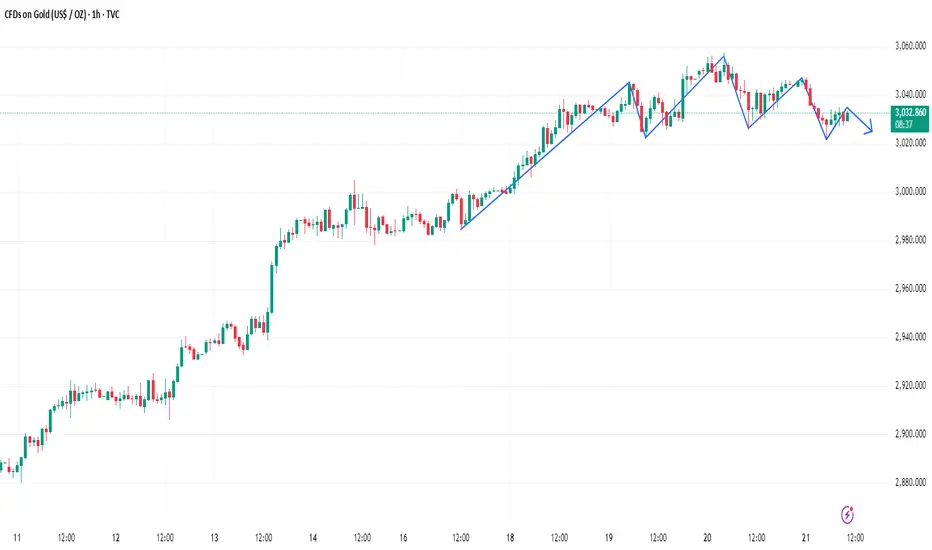
Can gold be shorted directly?The 1-hour moving average of gold has begun to turn slightly downward, and the strength of gold bulls has been suppressed. The 1-hour gold has now formed a head and shoulders pattern. If the strength of gold's rebound is limited, then the room for further decline of gold will increase.
Trading idea: short gold around 3032, stop loss 3042, target 3022
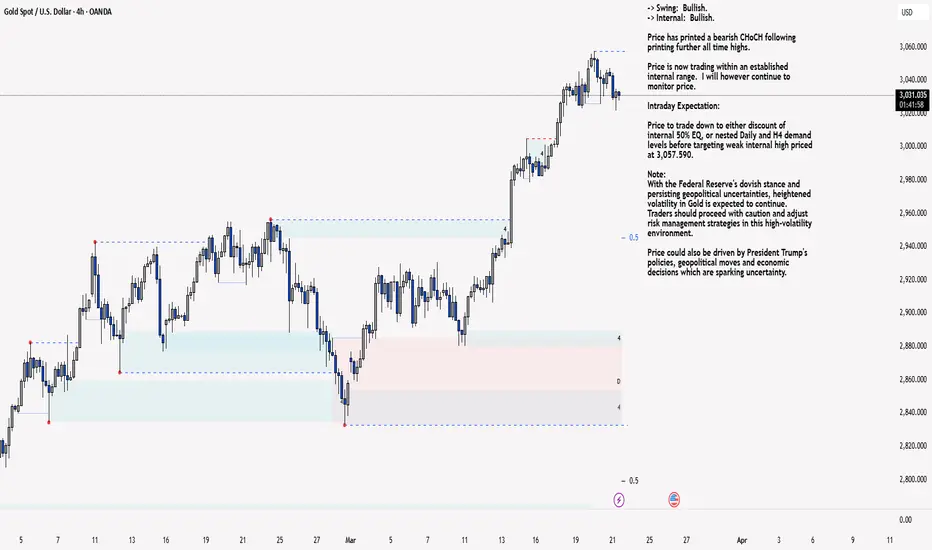
XAU/USD 21 March 2025 Intraday AnalysisH4 Analysis:
-> Swing: Bullish.
-> Internal: Bullish.
Price has printed a bearish CHoCH following printing further all time highs.
Price is now trading within an established internal range. I will however continue to monitor price.
Intraday Expectation:
Price to trade down to either discount of internal 50% EQ, or nested Daily and H4 demand levels before targeting weak internal high priced at 3,057.590.
Note:
With the Federal Reserve's dovish stance and persisting geopolitical uncertainties, heightened volatility in Gold is expected to continue. Traders should proceed with caution and adjust risk management strategies in this high-volatility environment.
Price could also be driven by President Trump's policies, geopolitical moves and economic decisions which are sparking uncertainty.
H4 Chart:
M15 Analysis:
-> Swing: Bullish.
-> Internal: Bullish.
You will note how price has mitigated M15 demand zones at the extreme of strong internal low. The remainder of my analysis and bias remains the same as analysis dated 19 March 2025.
Price has continued to surge to new all time highs, largely fuelled by geopolitical tensions, gold is solidifying itself as a safe haven asset.
Price has printed a further bullish iBOS followed by a bearish CHoCH to confirm internal structure.
Intraday Expectation:
Price has mitigated M15 demand zone. Technically price should target weak internal high priced at 3,057.590.
Alternative scenario:
You will note internal range has significantly narrowed. All HTF's require a pullback, therefore, it would be completely viable if price printed a bearish iBOS.
Note:
With the Federal Reserve maintaining a dovish stance and ongoing geopolitical tensions, volatility in Gold prices is expected to remain elevated. Traders should exercise caution, adjust risk management strategies, and stay prepared for potential price whipsaws in this high-volatility environment.
M15 Chart:
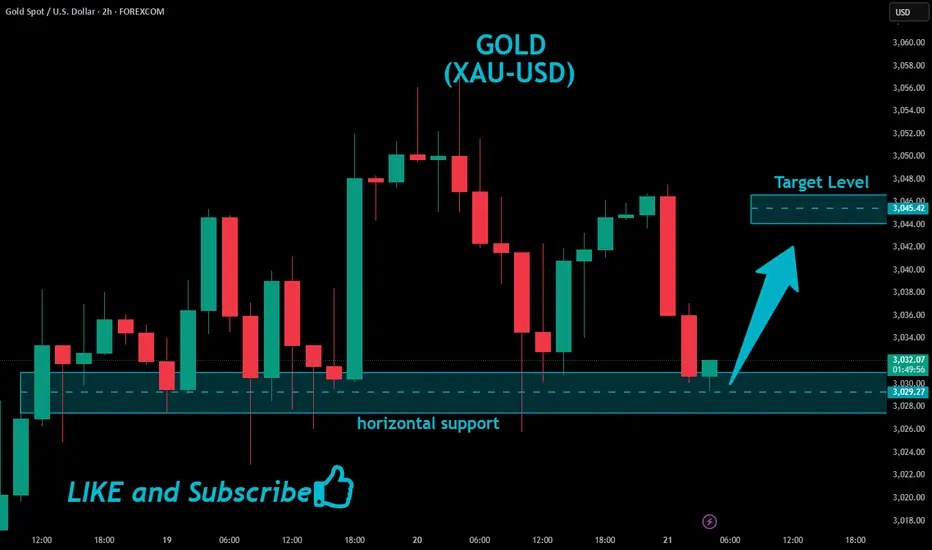
GOLD Swing Long!
HI,Traders !
GOLD has made a retest
Of the horizontal support
Of 3029.27 and we are already
Seeing a bullish rebound
From where we will be
Expecting further move up !
Comment and subscribe to help us grow !
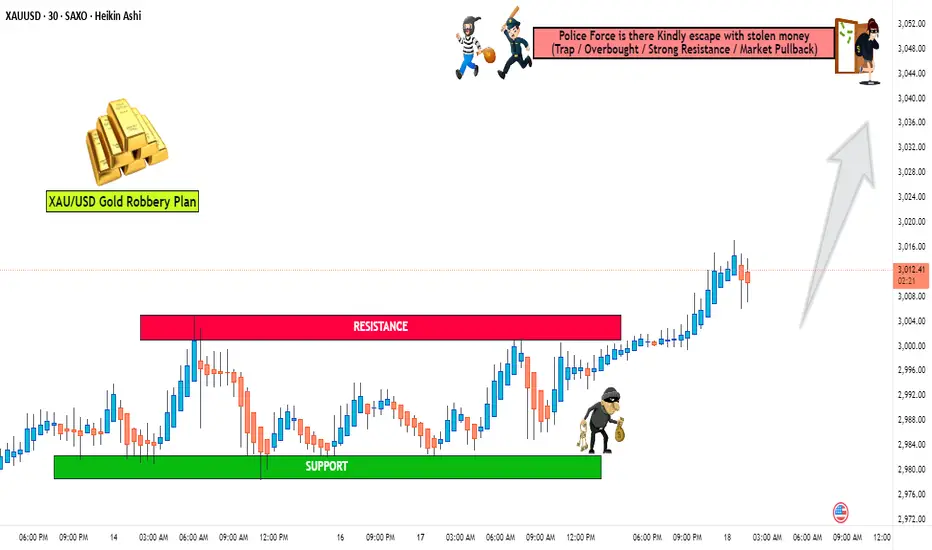
XAU/USD "Gold vs U.S Dollar" Metals Market Heist Plan🌟Hi! Hola! Ola! Bonjour! Hallo! Marhaba!🌟
Dear Money Makers & Robbers, 🤑 💰💸✈️
Based on 🔥Thief Trading style technical and fundamental analysis🔥, here is our master plan to heist the XAU/USD "Gold vs U.S Dollar" Metals Market. Please adhere to the strategy I've outlined in the chart, which emphasizes long entry. Our aim is the high-risk Red Zone. Risky level, overbought market, consolidation, trend reversal, trap at the level where traders and bearish robbers are stronger. 🏆💸Book Profits Be wealthy and safe trade.💪🏆🎉
Entry 📈 : "The vault is wide open! Swipe the Bullish loot at any price - the heist is on!
however I advise to Place buy limit orders within a 15 or 30 minute timeframe most recent or swing, low or high level. I Highly recommended you to put alert in your chart.
Stop Loss 🛑:
Thief SL placed at the recent / nearest low level Using the 30mins timeframe (2984)
SL is based on your risk of the trade, lot size and how many multiple orders you have to take.
🏴☠️Target 🎯: 3048 (or) Escape Before the Target
🧲Scalpers, take note 👀 : only scalp on the Long side. If you have a lot of money, you can go straight away; if not, you can join swing traders and carry out the robbery plan. Use trailing SL to safeguard your money 💰.
XAU/USD "Gold vs U.S Dollar" Metals Market Heist Plan is currently experiencing a bullishness,., driven by several key factors.
📰🗞️Get & Read the Fundamental analysis, Macro Economics, COT Report, Sentimental Outlook, Positioning and future trend...
Before start the heist plan read it.👉👉👉
📌Keep in mind that these factors can change rapidly, and it's essential to stay up-to-date with market developments and adjust your analysis accordingly.
⚠️Trading Alert : News Releases and Position Management 📰 🗞️ 🚫🚏
As a reminder, news releases can have a significant impact on market prices and volatility. To minimize potential losses and protect your running positions,
we recommend the following:
Avoid taking new trades during news releases
Use trailing stop-loss orders to protect your running positions and lock in profits
💖Supporting our robbery plan 💥Hit the Boost Button💥 will enable us to effortlessly make and steal money 💰💵. Boost the strength of our robbery team. Every day in this market make money with ease by using the Thief Trading Style.🏆💪🤝❤️🎉🚀
I'll see you soon with another heist plan, so stay tuned 🤑🐱👤🤗🤩
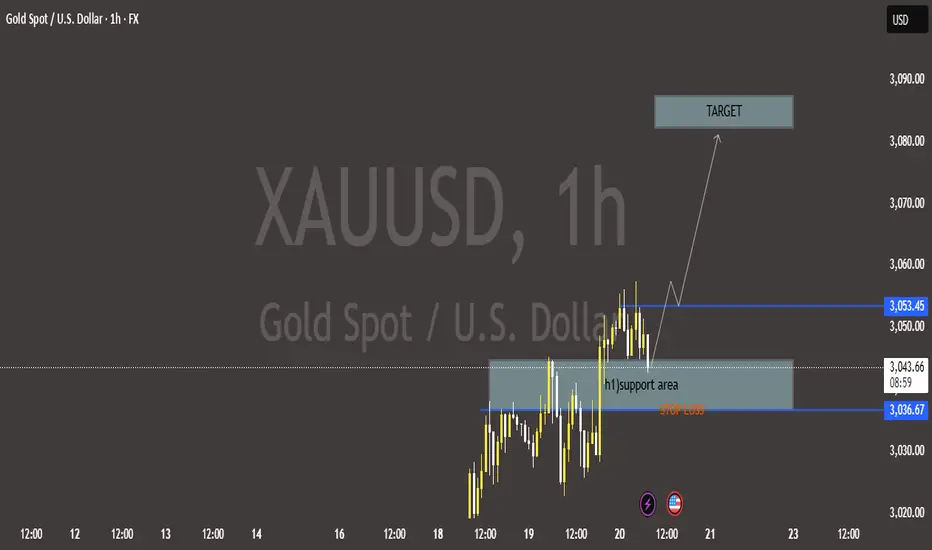
XAU/USD Bullish Breakout Setup – Gold Price Analysis🔍 Key Observations:
🟢 Support Zone:
H1 Support Area 📉: $3,036.67 - $3,044
Price is currently testing this zone (🔵).
🔴 Resistance Level:
$3,053.45 (🛑 Immediate Barrier)
📈 Trade Setup:
✅ Potential Buy Entry near support (🟢)
🎯 Target Zone: $3,080 - $3,090 (📍🚀)
❌ Stop-loss: Below $3,036.67 (⚠️🔴)
📊 Price Action:
If support holds 🟩, price could move UP (⬆️) toward the target 🎯
If it breaks down ⬇️, price may fall further (⚠️📉).
📌 Conclusion:
Bullish 📈 if the price respects support (🟢)
Bearish 📉 if it breaks below stop-loss (⚠️).
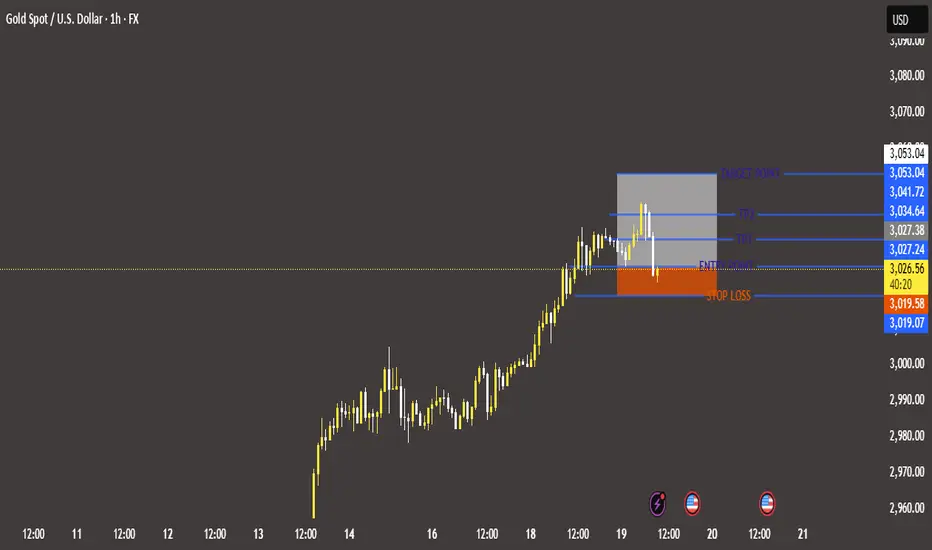
Gold (XAU/USD) Trade Setup – Bullish Momentum Ahead?Gold Spot (XAU/USD) 1H Chart Analysis
🔹 Entry Point: 3,026.90 🔵
🔹 Stop Loss: 3,019.58 - 3,019.07 ❌ (Risk Zone)
🔹 Take Profit Levels:
TP1: 3,034.64 🎯
TP2: 3,041.72 🚀
Final Target: 3,053.04 🏆
📈 Trend Analysis:
🔸 The market has been in a strong uptrend 📈 before pulling back to the entry zone.
🔸 The trade setup suggests a buy (long) position, aiming for higher levels.
🔸 If momentum continues, price may reach TP1 → TP2 → Final Target.
⚠️ Risk-Reward Ratio:
✅ Potential Reward: ~27 points 🏅
❌ Risk: ~7-8 points 🚨
💰 Risk-to-Reward Ratio: 1:3 (Favorable setup)
🔻 Risk Factor:
If price drops below 3,019.58, the trade will hit stop loss and may indicate a trend reversal 🔄.
📢 Conclusion:
Bullish trade setup looking promising if price holds above the entry point and moves towards TP targets! 🚀🔥
XAU/USD 19 March 2025 Intraday Analysis H4 Analysis:
-> Swing: Bullish.
-> Internal: Bullish.
Price has now printed a bearish CHoCH confirming internal range, however, I will continue to monitor.
Intraday Expectation:
Price to trade down to either discount of internal 50% EQ or nested Daily and H4 demand zones before targeting weak internal high priced at 3,045.310.
Note:
With the Federal Reserve's dovish stance and persisting geopolitical uncertainties, heightened volatility in Gold is expected to continue. Traders should proceed with caution and adjust risk management strategies in this high-volatility environment.
Price could also be driven by President Trump's policies, geopolitical moves and economic decisions which are sparking uncertainty.
H4 Chart:
M15 Analysis:
-> Swing: Bullish.
-> Internal: Bullish.
Again, since yesterday's analysis, price has continued to surge to new all time highs, largely fuelled by geopolitical tensions. Gold is solidifying itself as a safe haven asset.
Price has printed a further bullish iBOS followed by a bearish CHoCH to confirm internal structure.
Intraday Expectation:
Price has traded down to discount of 50% internal EQ and nearly mitigated M15 demand zone. Technically price should target weak internal high priced at 3,045.410.
Alternative scenario:
You will note internal range has significantly narrowed. All HTF's require a pullback, therefore, it would be completely viable if price printed a bearish iBOS.
Note:
With the Federal Reserve maintaining a dovish stance and ongoing geopolitical tensions, volatility in Gold prices is expected to remain elevated. Traders should exercise caution, adjust risk management strategies, and stay prepared for potential price whipsaws in this high-volatility environment.
M15 Chart:

GOLD Growth Ahead!
HI,Traders !
GOLD is making a
Local pullback while
Trading in an uptrend so
After will soon
Hit a horizontal support
Of 2949.56 from where
We will be expecting a
Local bullish rebound !
Comment and subscribe to help us grow !

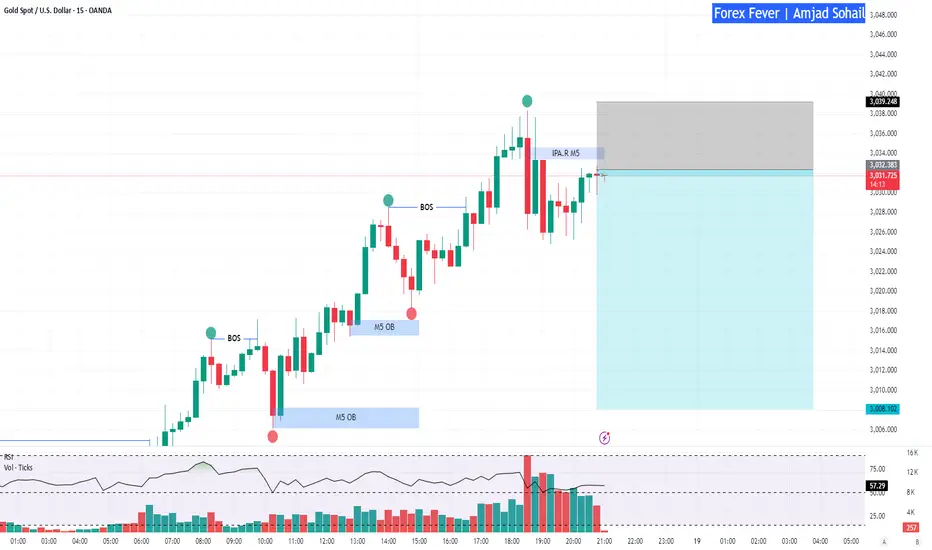
XAUUSD, Expecting a short sell till 3008 areaXAUUSD, Expecting a short sell till 3008 area based on M1 Order Block and M5 BPR, with targets 3020 & 300/.
good luck
Gold’s Big Moment: $3,000 in Play – Can Bulls Hold It?Gold has finally reached the psychological $3,000 level, triggering the first round of sell-offs as traders take profit. The question now is whether this move can sustain itself or if we are set for a deeper pullback. Given the rapid move up, I remain cautious, ready to cut the trade quickly if I see signs of weakness in the continuation.
Fundamentals:
• Market Sentiment: Bullish drivers remain strong as gold benefits from rising inflation expectations and the Fed’s rate pause, which has fueled demand for safe-haven assets.
• Geopolitical & Economic Factors:
• President Trump’s aggressive tariff agenda is fanning concerns about global trade, increasing risk aversion and driving flows into bullion-backed assets.
• Chinese jewelry stocks are soaring, signaling growing demand for gold in the region.
• The CME FedWatch Tool indicates a 97% probability that the Fed will hold rates steady at its next meeting, reinforcing gold’s appeal.
• Technical Considerations:
• Gold hit a fresh all-time high of $2,993, putting the psychological $3,000 mark in focus.
• Above $3,000, there is little historical price action to guide resistance levels, making price discovery uncertain.
• On the downside, $2,970 acts as a key pivot, with $2,951 and $2,914 serving as strong support zones if a deeper retracement occurs.
Risk Management:
• The first sell-off at $3,000 indicates short-term profit-taking.
• I am monitoring price action closely and will exit quickly if the move proves unsustainable.
Let’s see if gold can hold above $3,000 or if we are in for a correction!
Note: Please remember to adjust this trade idea according to your individual trading conditions, including position size, broker-specific price variations, and any relevant external factors. Every trader’s situation is unique, so it’s crucial to tailor your approach to your own risk tolerance and market environment.
Gold Market Forecast: Next Week’s Trading Setup & Key Price ZoneGold remains range-bound near record highs, with bullish potential as traders eye the Fed’s next move. Concerns over U.S. tariffs driving inflation, ongoing geopolitical tensions, and China’s rising gold reserves add to market uncertainty.
In this video, I break down the key technical level, market sentiment, and my personal strategy for positioning ahead of next week’s price action.
🔔 Don’t forget to like, subscribe, and hit the notification bell for more market insights!
#GoldPrice #XAUUSD #GoldForecast #GoldTrading #ForexAnalysis #MarketNews #FederalReserve #InterestRates #SafeHaven #Geopolitics #TradingStrategy
Disclaimer:
Forex and other market trading involve high risk and may not be for everyone. This content is educational only—not financial advice. Always assess your situation and consult a professional before investing. Past performance doesn’t guarantee future results.

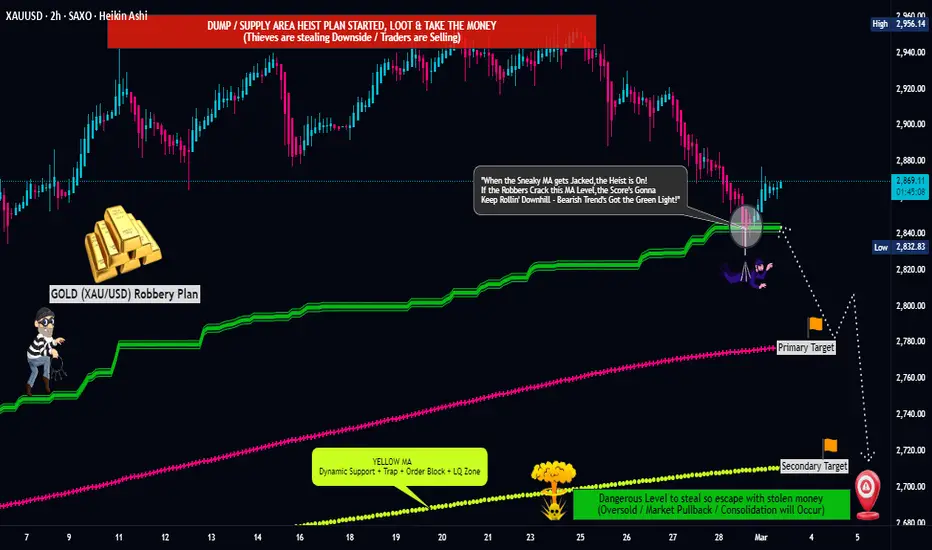
XAU/USD "The Gold vs U.S Dollar" Metals Market Robbery Plan🌟Hi! Hola! Ola! Bonjour! Hallo! Marhaba!🌟
Dear Money Makers & Thieves, 🤑 💰🐱👤🚀
Based on 🔥Thief Trading style technical and fundamental analysis🔥, here is our master plan to heist the XAU/USD "The Gold vs U.S Dollar" Metals Market. Please adhere to the strategy I've outlined in the chart, which emphasizes short entry. Our aim is the high-risk Green Zone. Risky level, oversold market, consolidation, trend reversal, trap at the level where traders and bullish thieves are getting stronger. 🏆💸Book Profits Be wealthy and safe trade.💪🏆🎉
Entry 📈 : "The heist is on! Wait for the breakout (2830.00) then make your move - Bearish profits await!" however I advise placing Sell Stop Orders below the breakout MA or Place Sell limit orders within a 15 or 30 minute timeframe. Entry from the most recent or Swing high or low level should be in retest.
📌I strongly advise you to set an alert on your chart so you can see when the breakout entry occurs.
Stop Loss 🛑: Thief SL placed at (2830.00) swing Trade Basis Using the 2H period, the recent / swing high or low level.
SL is based on your risk of the trade, lot size and how many multiple orders you have to take.
Target 🎯:
Primary Target - 2780.00 (or) Escape Before the Target
Secondary Target - 2710.00 (or) Escape Before the Target
🧲Scalpers, take note 👀 : only scalp on the Short side. If you have a lot of money, you can go straight away; if not, you can join swing traders and carry out the robbery plan. Use trailing SL to safeguard your money 💰.
📰🗞️Fundamental, Macro, COT Report, Global Market Analysis, Sentimental Outlook, Intermarket Analysis, Quantitative Analysis, Positioning:
XAU/USD "The Gold vs U.S Dollar" Metals Market is currently experiencing a Neutral trend., driven by several key factors.
⭐☀🌟Fundamental Analysis
Gold prices are influenced by various fundamental factors, including:
- Inflation: Rising inflation can lead to increased demand for gold as a hedge against inflation.
- Interest Rates: Lower interest rates can make gold more attractive to investors, while higher interest rates can reduce demand.
- Central Bank Policies: Central banks' decisions on gold reserves and monetary policies can impact gold prices.
- Global Economic Conditions: Economic downturns or crises can increase demand for gold as a safe-haven asset.
⭐☀🌟Macro Economics
Macroeconomic factors that can impact gold prices include:
- GDP Growth: Slowing GDP growth can lead to increased demand for gold.
- Unemployment Rates: Rising unemployment can increase demand for gold.
- Inflation Rates: Rising inflation can lead to increased demand for gold.
⭐☀🌟Global Market Analysis
Global market trends can also impact gold prices:
- Stock Market Performance: Weakness in the stock market can lead to increased demand for gold.
- Currency Fluctuations: A weaker US dollar can make gold more attractive to investors.
⭐☀🌟COT Data
Commitment of Traders (COT) data can provide insights into market sentiment:
- Non-Commercial Traders: An increase in long positions by non-commercial traders can indicate bullish sentiment.
- Commercial Traders: An increase in short positions by commercial traders can indicate bearish sentiment.
⭐☀🌟Intermarket Analysis
Intermarket analysis involves analyzing the relationships between different markets:
- Correlation with Other Assets: Gold's correlation with other assets, such as stocks and bonds, can impact its price.
- Commodity Prices: Changes in commodity prices, such as oil and copper, can impact gold prices.
⭐☀🌟Quantitative Analysis
Quantitative analysis involves using mathematical models to analyze gold prices:
- Technical Indicators: Technical indicators, such as moving averages and relative strength index (RSI), can provide insights into gold's trend.
- Statistical Models: Statistical models, such as regression analysis, can help identify relationships between gold prices and other variables.
⭐☀🌟Market Sentimental Analysis
Market sentimental analysis involves analyzing investor attitudes and sentiment:
- Bullish Sentiment: Increased bullish sentiment can lead to higher gold prices.
- Bearish Sentiment: Increased bearish sentiment can lead to lower gold prices.
⭐☀🌟Positioning
Positioning involves analyzing the current market position:
- Long Positions: An increase in long positions can indicate bullish sentiment.
- Short Positions: An increase in short positions can indicate bearish sentiment.
⭐☀🌟Next Trend Move
Based on the analysis, the next trend move for XAU/USD is uncertain. However, if inflation concerns rise, or if there's a significant increase in bullish sentiment, gold prices could move higher.
Short-Term: Bullish: $2,900-$3,000, Bearish: $2,700-$2,600
Medium-Term: Bullish: $3,200-$3,500, Bearish: $2,400-$2,200
Long-Term: Bullish: $3,800-$4,000, Bearish: $2,000-$1,800
⭐☀🌟Overall Summary Outlook
The overall summary outlook for XAU/USD is neutral. Gold prices are influenced by a complex array of factors, and the current market position is uncertain. Investors should monitor inflation concerns, interest rates, and global economic conditions to make informed decisions.
📌Keep in mind that these factors can change rapidly, and it's essential to stay up-to-date with market developments and adjust your analysis accordingly.
⚠️Trading Alert : News Releases and Position Management 📰 🗞️ 🚫🚏
As a reminder, news releases can have a significant impact on market prices and volatility. To minimize potential losses and protect your running positions,
we recommend the following:
Avoid taking new trades during news releases
Use trailing stop-loss orders to protect your running positions and lock in profits
💖Supporting our robbery plan 💥Hit the Boost Button💥 will enable us to effortlessly make and steal money 💰💵. Boost the strength of our robbery team. Every day in this market make money with ease by using the Thief Trading Style.🏆💪🤝❤️🎉🚀
I'll see you soon with another heist plan, so stay tuned 🤑🐱👤🤗🤩