XAUUSD Short / Sell Setupwait for the entry and place tp & SL, must use SL, never exceed more than 2% on SL of your portfolio on any trade. If tp is achieved first then trade setup will be invalid.
Xauusdsetup
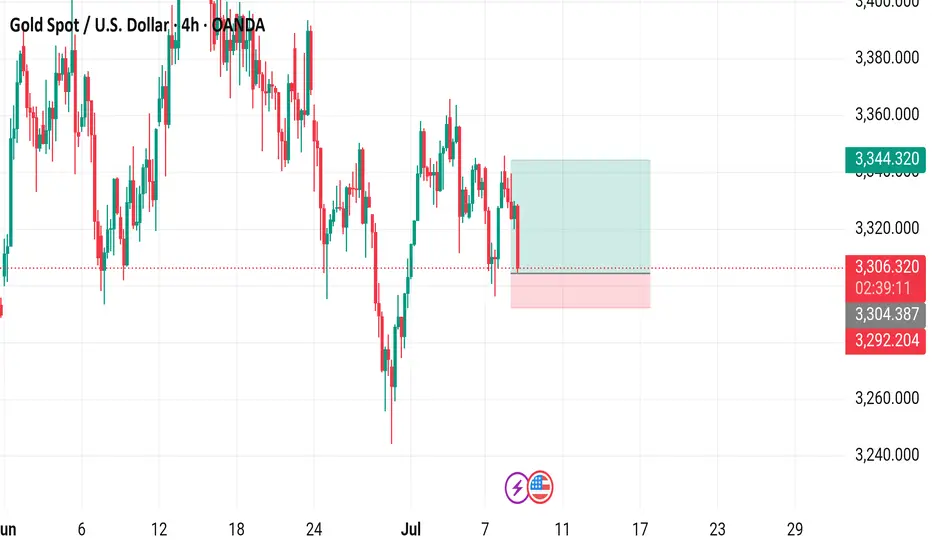
Gold Spot / U.S. Dollar (XAUUSD) 4-Hour Chart - OANDA4-hour chart from OANDA displays the price movement of Gold Spot (XAUUSD) against the U.S. Dollar. The current price is $3,805.780, reflecting a decrease of $30.660 (-0.92%). Key levels include a sell price of $3,305.390 and a buy price of $3,305.940. The chart highlights recent volatility with a shaded area indicating a potential support or resistance zone around $3,344.320. The time frame spans from late June to early July 2025, with the latest data point at 02:41:15 on July 8, 2025.
Setupsfx_ | XAUUSD(Gold):07/07/2025 Update | Gold dropped nicely when the market opened last night, dropping around 600 pips. However, it couldn’t hold on to the gains and came right back to the selling zone. There are two entry points and two potential targets.
Good luck and trade safely!
Team Setupsfx_
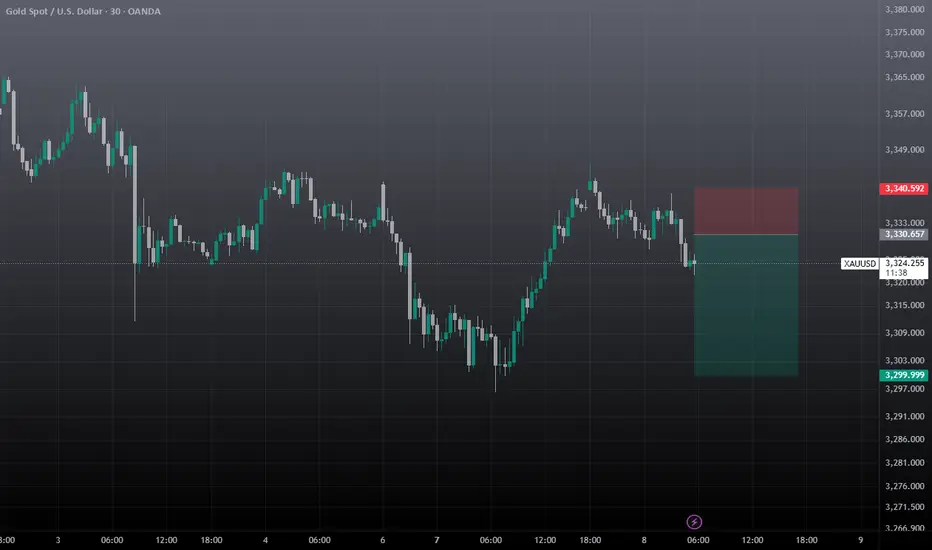
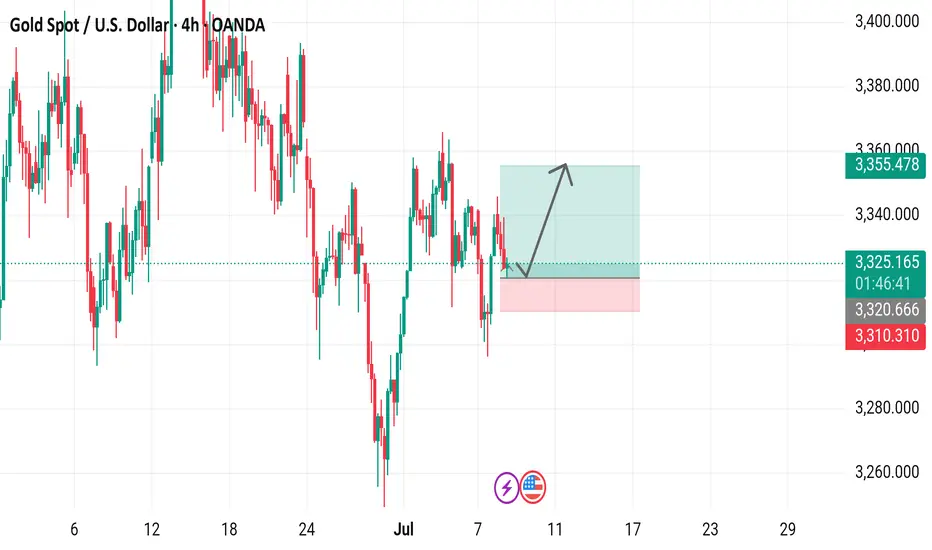
Gold Spot / U.S. Dollar (XAU/USD) 4-Hour Chart4-hour chart from OANDA displays the recent price movement of Gold Spot (XAU/USD) against the U.S. Dollar. The current price is $3,325.120, reflecting a decrease of $11.320 (-0.34%). The chart highlights a recent upward trend with a buy signal at $3,325.410 and a sell signal at $3,324.830, indicating a potential trading range. A shaded area suggests a possible price target or support/resistance zone around $3,355.478, with historical price levels marked on the right side. The timeframe covers the period around July 7-8, 2025.
4‑Hour Technical Framework- 8th July 2025Current Price: ~$3,330
Timeframe Focus: 4‑Hour and 1‑Hour
Directional Bias: Neutral-to-Bearish
Methodologies Used:
✅ Price Action, Fibonacci Levels, Support & Resistance
✅ Supply & Demand Zones
✅ ICT / Smart Money Concepts (BOS, CHoCH, Liquidity, OB, FVG)
4‑Hour Market Structure Analysis
Gold has shifted into a neutral-to-bearish regime on the 4‑hour timeframe, after a decisive Break of Structure (BOS) below prior swing lows at ~$3,345 and a clear Change of Character (CHoCH) as bulls failed to sustain above the ~$3,350 level. Price currently hovers around ~$3,330, consolidating within a bearish Fair Value Gap (FVG) left by the recent impulsive drop.
Key Observations:
A liquidity grab above $3,349 (stop sweep) preceded a sharp reversal, validating this as a sell-side liquidity zone.
The 4H supply zone / bearish Order Block (OB) at $3,345–$3,350 remains unmitigated and likely to attract sellers.
Immediate downside is cushioned by a 4H demand zone & FVG at $3,300–$3,305, which has acted as support during the prior dip.
A deeper daily demand zone rests around $3,280–$3,290, which aligns with historical support and unmitigated buy‑side liquidity.
Key 4‑Hour Levels to Watch
Price Level Type Notes
$3,360–$3,365 Supply / Fib 61.8% Strong resistance
$3,345–$3,350 Supply / OB + 50% Fib Primary sell zone
$3,330–$3,334 Bearish FVG Active imbalance
$3,300–$3,305 Demand / FVG Primary buy zone
$3,280–$3,290 Demand (daily OB) Secondary buy zone
The neutral-to-bearish bias is reinforced by the fact that price has failed to reclaim prior support and continues to respect supply zones.
1‑Hour Intraday Trade Ideas
Zooming into the 1‑hour chart, we align intraday setups with the broader 4H directional bias: selling into supply and covering into demand.
Setup 1: Short at 4H Imbalance
Entry: ~$3,332–$3,334 (inside active FVG)
Stop-Loss: Above $3,335
Targets:
TP1: $3,305
TP2: $3,280
Confluences: BOS + CHoCH, 4H FVG, sell‑side liquidity above.
Setup 2: Short on Retracement
Entry: ~$3,345–$3,350 (50% Fib + OB)
Stop-Loss: Above $3,352
Targets: Same as Setup 1.
Setup 3: Aggressive Long (Countertrend)
Entry: ~$3,300–$3,305 (demand + FVG)
Stop-Loss: Below $3,295
Target: $3,327
Note: Only valid if strong bullish reaction occurs in demand.
The Golden Setup
Sell at ~$3,332–$3,334 (active 4H imbalance) with a target of $3,300.
This setup offers maximum confluence — bearish FVG, BOS, and supply rejection — with tight risk parameters and favorable reward/risk ratio.
Summary Table
Bias Levels of Interest
Directional Bias Neutral-to-Bearish
Strong Sell Zones $3,330–$3,334 and $3,345–$3,350
Strong Buy Zones $3,300–$3,305 and $3,280–$3,290
Closing Notes
Gold continues to respect Smart Money footprints on the 4‑hour chart, suggesting more downside unless bulls reclaim $3,350 decisively. Today’s focus remains on short opportunities at premium levels into supply and imbalances, targeting well‑defined demand areas below.
Watch price action closely in the $3,332–$3,334 zone for the highest‑probability short entry of the session — The Golden Setup.

XAUUSD Outlook: How Risk Sentiment Could Shape the Next MoveI’m currently analysing XAUUSD (Gold) 🟡, which has come under bearish pressure 📉, showing signs of downside momentum. In the video 🎥, we also explore the inverse correlation between Gold and risk assets like the NASDAQ 📊.
Keep a close eye on NASDAQ movements—if risk assets break bullish 🚀, we may see further weakness in Gold. On the other hand, if risk sentiment shifts and risk assets break bearish 🛑, Gold could attract safe-haven demand and gain strength 💪.
We also dive into the price action, market structure, and pull up the volume profile 🧩. Gold is currently trading around the Point of Control (POC) ⚖️—a key level where significant volume has accumulated. A clean break above or below this area could act as a technical trigger for the next move 📈📉.
As always, this is not financial advice ⚠️—just my market view.

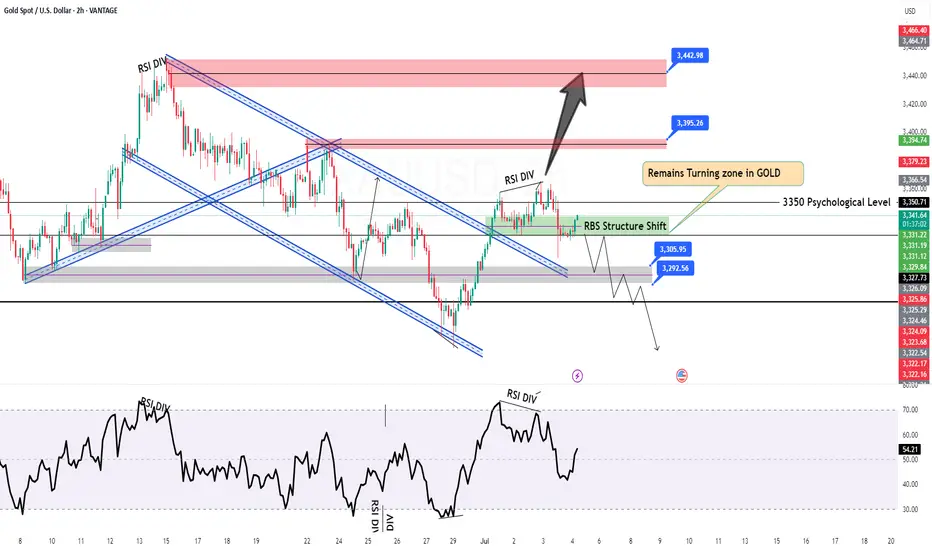
GOLD H2 Intraday Chart Update for 8 July 2025Hello Traders
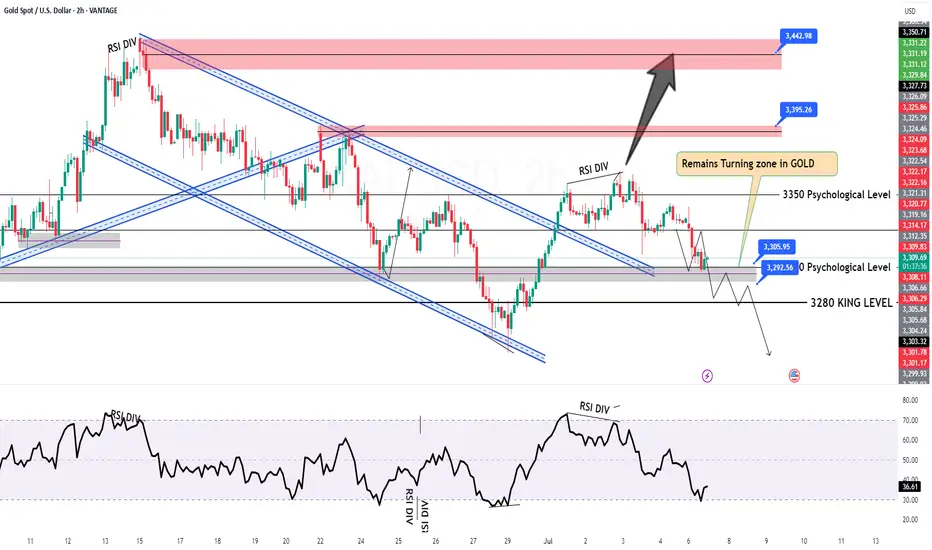
Gold is still in a range between 3300 - 3350 Psychological level, all eyes on breakout of both mentioned psychological levels for now
Intraday Strong support zone is located 3290-3300
Intraday Strong Resistance zone is located 3350-3360
US TARIFF WAR remains agenda for now
Disclaimer: Forex is Risky

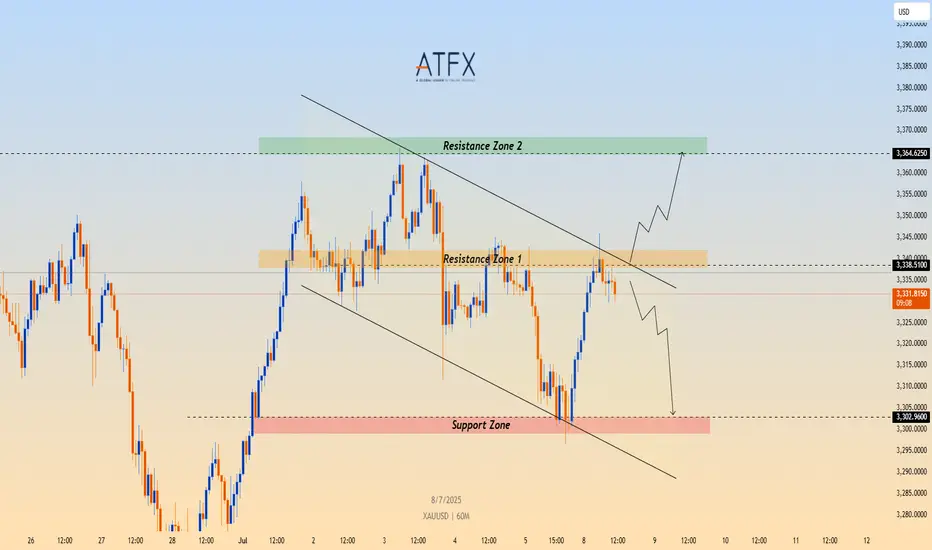
XAU/USD Eyes Key Resistance Amid Fresh Tariff Fears🟡 TVC:GOLD Gold Price Forecast: XAU/USD Eyes Key Resistance Amid Fresh Tariff Fears
OANDA:XAUUSD Spot gold (XAU/USD) is recovering from intraday lows near $3,296, now trading around $3,330 as fears over renewed U.S. tariffs fuel safe-haven demand. President Trump has begun issuing formal letters announcing fresh import tariffs—25% on South Korea, additional measures on Japan, and a 10% universal tariff on countries aligning with BRICS. With the 90-day tariff pause expiring August 1 and no trade progress in sight, geopolitical and economic uncertainty continue to support gold’s floor.
📉 Technical Structure
XAU/USD remains within a descending channel on the 1H chart, with price currently approaching the $3,338–$3,340 Resistance Zone 1. A clean breakout above the upper channel boundary could trigger a move toward the broader $3,364 Resistance Zone 2. Conversely, failure to break above Resistance Zone 1 would keep the bearish channel intact, with downside targets toward the $3,302–$3,305 support zone.
📌 Key Technical Zones
Resistance Zone 1: $3,338–$3,340
Resistance Zone 2: $3,364
Support Zone: $3,302–$3,305
Channel Structure: Bearish unless broken to the upside
📘 Strategy Summary
XAU/USD is showing signs of short-term recovery, but remains technically capped unless it breaks through $3,340 resistance. As long as the descending channel holds, rallies may be sold into. A confirmed break above $3,340 could shift bias toward $3,364, while rejection may reopen the path to $3,305 and potentially lower.
⚠️ Disclaimer
This analysis is for informational purposes only and does not constitute investment advice. Please consult a licensed financial advisor before making trading decisions.
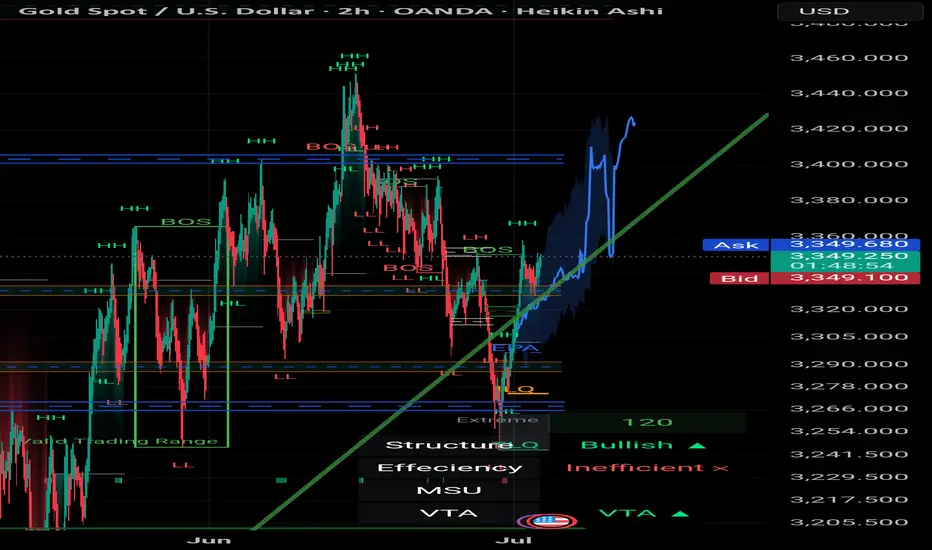
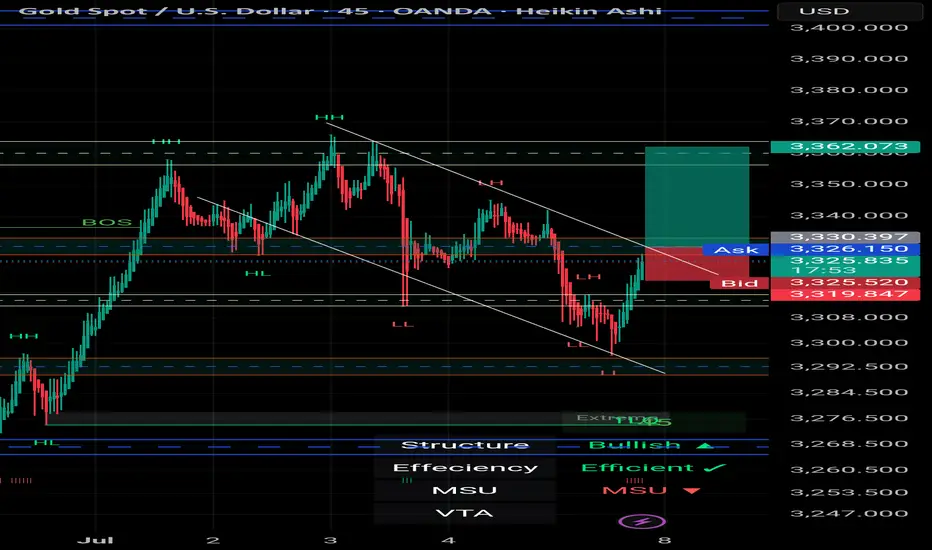
XAU/USD – 45-Minute Chart Breakdown **Date:** July 7, 2025 # 📊 XAU/USD – 45-Minute Chart Breakdown
**Date:** July 7, 2025
**Current Price:** $3,326.97
**Bias:** 📈 Bullish Breakout
---
## 🔹 Key Market Structure:
- **Trendline Breakout**: ✅
Price broke cleanly out of the descending trendline that had held since the $3,362 high.
- **LL → HL Shift**:
The structure is transitioning from Lower Lows to potential Higher Lows (HL) – a strong sign of **reversal**.
- **BOS Zone** (Break of Structure):
BOS has been confirmed; further upside is now **probable**.
---
## 🔸 Trade Zone:
| Type | Level | Description |
|------------|------------|--------------------------|
| **Entry** | ~$3,326 | Breakout confirmation 🔓 |
| **SL** | ~$3,319 | Below recent HL 🛡️ |
| **TP1** | $3,362 | Top of previous range 🎯 |
| **TP2** | $3,385+ | Momentum extension 📈 |
---
## 📌 Indicators & Labels:
- **Structure:** `Bullish` 🟢
- **Efficiency:** `Efficient` ✅
- **MSU:** Bearish (short-term countertrend, being invalidated)
- **VTA:** Active ⚡️
---
## 🧠 Strategy Note:
This breakout is occurring **after a full liquidity sweep** and a **strong bullish reaction** off the $3,290s. Volume is supporting the move and **confluence** builds toward continuation.
> 💬 *"The best trades come when structure, liquidity, and timing converge."* – Let's ride this wave with confidence.
---
### 👑 For Persian Princes of the Market 🇮🇷
We don’t guess. We **track, adapt, and lead**.
---
## 🟢 Potential Breakout from the Descending Channel
As observed in the **45-minute timeframe**, Gold (XAU/USD) has been respecting a classic **descending channel** formed by a sequence of Lower Highs (LH) and Lower Lows (LL), leading to an overall bearish structure.
However, in the latest candles, price has **broken above the upper boundary of the channel**, signaling a potential shift in market structure.
---
### 🔍 Technical Highlights:
- ✅ **Breakout above the channel** = First sign of bullish reversal
- ✅ **Formation of Higher Low (HL)** after a strong rally = Added confirmation
- ✅ **Efficient bullish move** with momentum pushing toward previous Highs
---
### 🎯 Forecast Scenario:
If price holds above the breakout zone (around **$3,327**), we can expect a bullish continuation toward:
- 🥇 **Target 1:** $3,362
- 🥈 **Target 2:** $3,385+
A **successful retest** of the broken channel would serve as a powerful confirmation for this setup.
---
> ⛳️ *This move reflects not just a breakout — but a disciplined journey through structure, liquidity, and price behavior. Pure technical elegance.*
> — *Mohsen Mozafari Nejad*
---
📈 **Structure:** Bullish
⚡️ **Momentum:** Efficient
🕰 **Timeframe:** 45 Min
💰 **Current Price:** ~$3,327
#XAUUSD: Early Mitigation Or Sellers Trap! Let's See Gold dropped after touching 3365 taking price to 3318.Currently ranging market showing confusion over how gold would react to NFP data which is coming out tomorrow. At this moment we are quite certain that price would drop tomorrow either from entry one or entry two. Please use accurate risk management while trading.
Good luck and trade!
Team Setupsfx_
GOLD H2 Intraday Chart Update For 7 July 2025Welcome to the new week traders
as we have FOMC meeting minutes report due this week so firs market is fell down from 3350 Psychological level now is testing 3300 psychological level
all eyes on breakout of 3300 level for now if market breaks 3300 level then it will move towards 3280 then 3350
only clear breakout of 3335 will clear path for towards 3368 level
Disclaimer: Forex is Risky
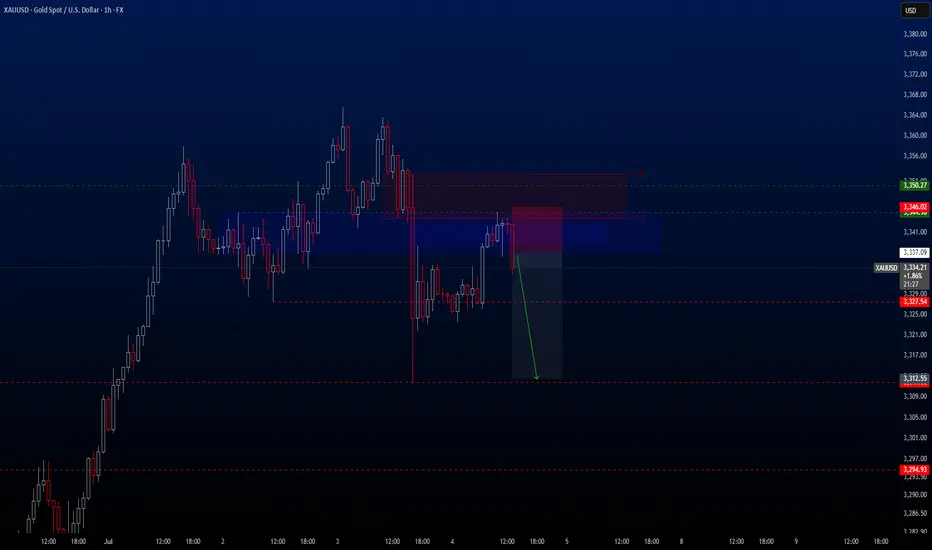
XAUUSD – High-Precision Sell Setup with 1:2.70 R/RGreetings, traders.
After a brief tactical pause, we’ve identified a **high-conviction short setup** on **XAUUSD**.
Despite the U.S. Independence Day holiday, structural momentum suggests there’s still room for meaningful movement in gold during today’s session. The risk-to-reward profile on this setup is exceptional — clocking in at **1:8.70**, it meets our highest-tier execution standards.
If momentum stalls or price consolidates excessively, the trade will be manually closed by **23:00 (UTC+4)**, regardless of outcome.
🧠 Trade Parameters:
• **Timeframe:** 1-Hour (H1)
• **Direction:** Sell
• **Entry:** 3337.09
• **Take Profit:** 3312.16
• **Stop Loss:** 3345.63
• **Risk/Reward Ratio:** 1:2,70
• **Trade Management Note:** Will be closed manually by 23:00 (UTC+4) if momentum conditions are not met.
🔗 Signal Source
All trade setups are published directly by Velatrix Capital — a high-discipline trading desk focused on FX, crypto, and global indices.
No opinions. No hype. Just statistically-grounded execution.
All signals are posted via our TradingView desk:
👉 (tradingview.sweetlogin.com)
📈 **We don’t chase hype. We build edge.**
🔔 **Subscribe for future setups and institutional-grade trade intelligence.**
**Velatrix Capital**
Consolidating Below Trendline Resistance, Bearish Bias IntactTechnical Structure:
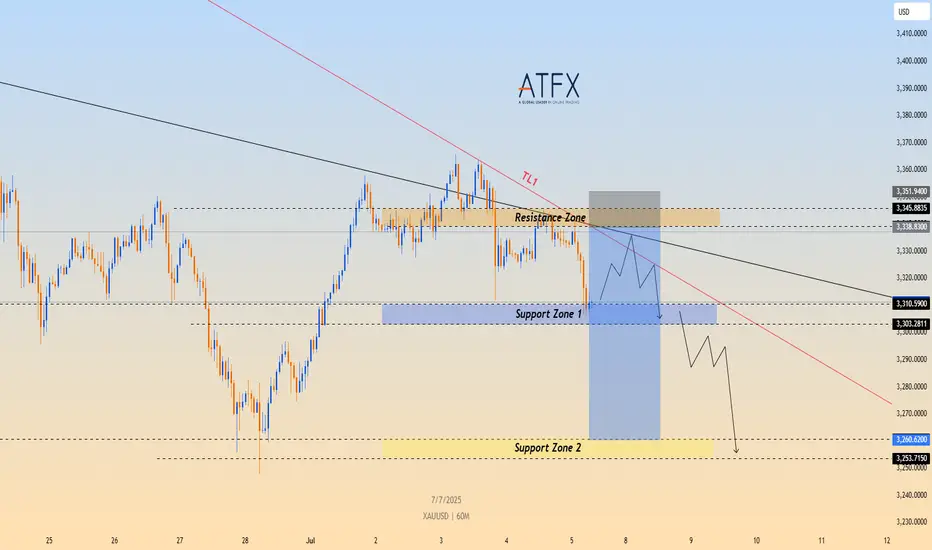
OANDA:XAUUSD Gold (XAU/USD) continues to trade below the descending trendline TL1, having failed multiple times to breach the $3,338–$3,345 resistance zone. After retesting Support Zone 1 ($3,303–$3,310), the price is showing signs of a short-term bounce. However, the broader structure remains bearish unless the price can break above TL1.
Key Technical Levels:
Resistance Zone: $3,338 – $3,345
Support Zone 1: $3,303 – $3,310
Support Zone 2: $3,260 – $3,253
Trendline: TL1 continues to act as dynamic resistance
Strategy Insight:
If TVC:GOLD gold remains below the descending TL1, bearish pressure is likely to resume. A short opportunity may arise if the price retests the resistance area and stalls. A confirmed break below Support Zone 1 would expose targets at $3,260 and $3,253.
Disclaimer:
This analysis is for educational purposes only and does not constitute investment advice. Please consult a qualified financial advisor before making trading decisions.
Current outlook for XAUUSD for the july 7th -11th 2025Support and resistance tells us to watch for price action around $3325 - $3345. Either a possible short at 3345 if rejected, or possible further downside if it breaks below 3325.

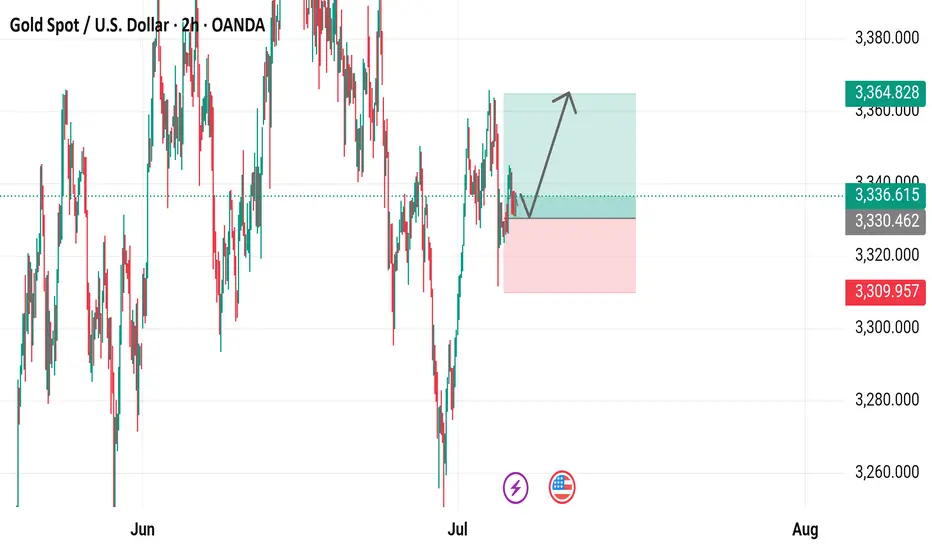
Gold Spot / U.S. Dollar (XAUUSD) 2-Hour Chart2-hour chart from OANDA displays the recent price movement of Gold Spot (XAUUSD) against the U.S. Dollar. The current price is $3,336.615, up by $10.585 (+0.32%). The chart highlights a recent upward trend with a buy signal at $3,336.970 and a sell signal at $3,336.260. Key price levels include a resistance zone around $3,364.828 and a support zone near $3,309.957, with the price showing a potential breakout above the recent consolidation range.
renderwithme | XAUUSD - GOLD Pre-NFP Technical AnalysisCurrent Market ContextPrice Levels: Gold (XAU/USD) is trading around $3,341.79 as of July 4, 2025, with recent price action showing consolidation between $3,300 and $3,400 after a pullback from highs near $3,500.
Recent Performance: Gold rose slightly by 0.27% to $3,335.17 per troy ounce on July 4, supported by positive momentum from trading above the 50-day EMA. However, it has faced resistance near $3,400 and experienced low liquidity due to the U.S. Independence Day holiday.
Market Sentiment: The overall sentiment remains cautiously bullish, driven by a weakening U.S. dollar amid concerns over U.S. fiscal imbalances (e.g., Trump’s tax-cut bill adding $3.4 trillion to the national debt) and expectations of a dovish Federal Reserve policy. However, short-term volatility is expected due to holiday-thinned liquidity and upcoming economic data
# Technical Outlook
Bullish Scenario: If gold holds above $3,300 and breaks $3,353, it could retest $3,400 and potentially climb toward $3,435–$3,451. A weekly close above $3,400 would negate near-term bearish risks and signal a continuation of the broader uptrend.
Bearish Scenario: A sustained break below $3,300 could trigger a deeper correction toward $3,248 (monthly low) or $3,226–$3,203. A drop below $3,203 would challenge the medium-term uptrend, potentially opening the door to $3,150 or lower.
Range-Bound Expectation: Due to low liquidity and pending NFP data, gold may consolidate between $3,320 and $3,340 early next week, with volatility increasing post-NFP
Disclaimer --
This analysis is based on recent technical data and market sentiment from web sources. It is for informational purposes only and not financial advice. Trading involves high risks, and past performance does not guarantee future results. Always conduct your own research or consult a SEBI-registered advisor before trading.
#Boost and comment will be highly appreciated

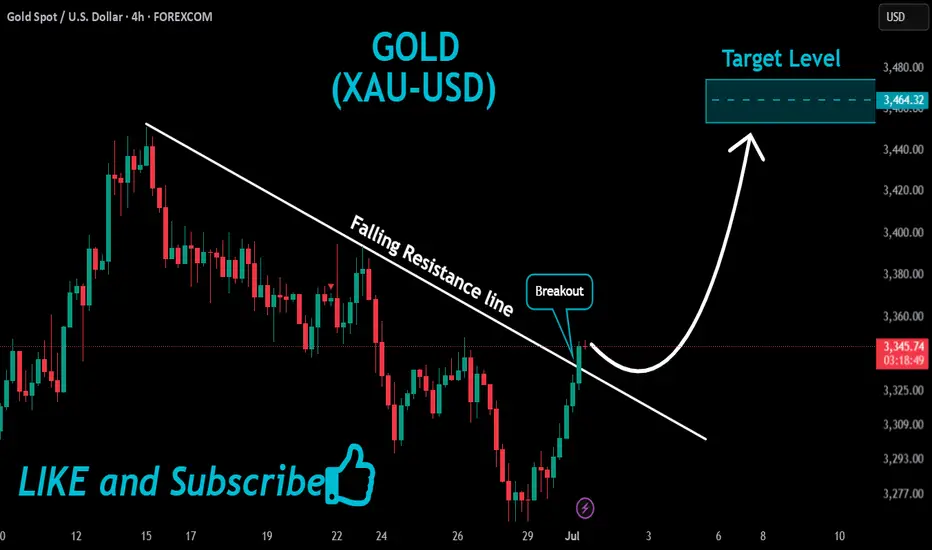
GOLD Massive Bullish Breakout!
HI,Traders !
#GOLD is trading in a strong
Uptrend and the price just
Made a massive bullish
Breakout of the falling
Resistance line and the
Breakout is confirmed
So after a potential pullback
We will be expecting a
Further bullish continuation !
Comment and subscribe to help us grow !
XAUUSDHello traders. After a short break, we’ve identified a promising sell opportunity on the XAUUSD pair.
Despite the U.S. Independence Day holiday, I believe we may still see solid movement in gold during today's session.
🔍 Trade Details
✔️ Timeframe: 1-Hour (H1)
✔️ Risk-to-Reward Ratio: 1:2.70
✔️ Trade Direction: Sell
✔️ Entry Price: 3337.09
✔️ Take Profit: 3312.16
✔️ Stop Loss: 3345.63
🕒 If momentum fades or the price consolidates in a tight range, I will keep this trade open only until 23:00 (UTC+4). After that, I’ll close it manually—whether in profit or loss—depending on how price action evolves.
🔔 Disclaimer: This is not financial advice. I’m simply sharing a trade I’ve taken based on my personal trading system, strictly for educational and illustrative purposes.
📌 Interested in a systematic, data-driven trading approach?
💡 Follow the page and turn on notifications to stay updated on future trade setups and advanced market insights.
Gold AnalysisI am seeing gold for a bearish move as it shifts its direction i am taking a short position from marked zone you guys can manage your risk accordingly
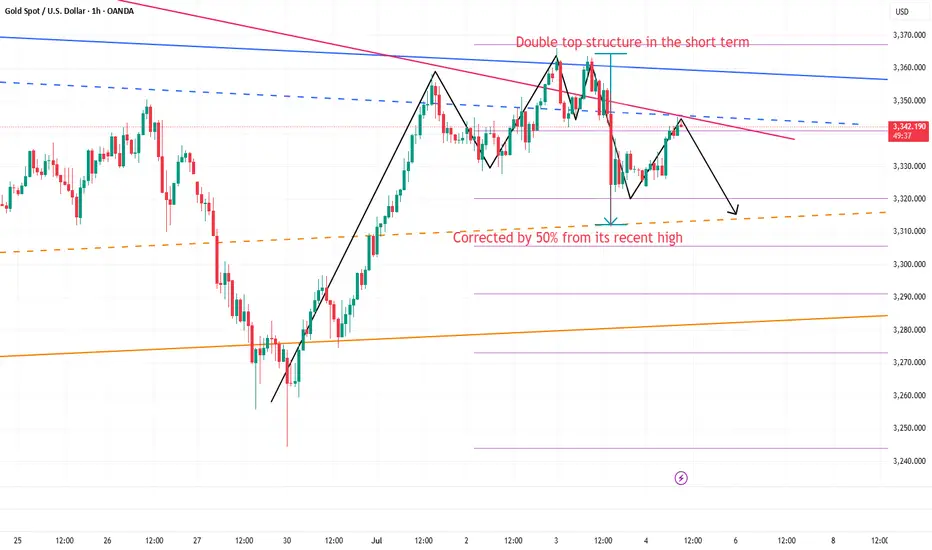
Still short gold before breaking 3355After the release of NFP yesterday, gold began to fall sharply from 3352, reaching a low of around 3312; although it has gradually rebounded above 3340, the time span is not short, so the rebound is not strong; and the double top structure successfully constructed by gold in the 3365-3360 area in the short term still plays a technical suppression role in the short term, greatly weakening the rebound potential; and with the decline of gold yesterday, I think before gold recovers the 3352 starting point, gold will also be under pressure in the 3345-3355 area in the short term. If gold cannot successfully break through this area during the rebound, gold is expected to retest the 3330-3320 area again.
Because of the US Independence Day, the gold market will be closed in advance today. It is expected that gold will not have a breakthrough today, so it may be difficult to break through the 3345-3355 area in the short term, so we can still continue to maintain the trading rhythm of shorting gold in terms of trading.
So I think shorting gold still has a lot of profit potential. We can short gold with 3345-3355 area as resistance and look to the target area: 3335-3325-3315.
GOLD H2 Intraday Chart Update For 4 July 2025As you can see that GOLD is still in consolidation range above 3300 Psychological Level
Currently prices are still standing @ 3340 nearby Psychological Level, only if market breaks 3368 clearly then it will consider Bullish other below 3368 market still in Bearish Move
Reminder: Today is US Bank Holiday
Disclaimer: Forex is Risky
GOLD H2 Intraday Chart Update For 3 July 2025Hello Traders,
Main event of is day NFP and all eyes on 3400 Psychological for now, right now market sustains around 3350 Psychological level for downward move GOLD still need to break 3324 level in order to go further down above 3324 LEVEL GOLD is still remains Bullish
Remember: It's NFP day
Disclaimer: Forex is Risky

Mozafari Nejad ### Multi-Timeframe Analysis: 15min + 30min + 2# XAU/USD | Gold Market Outlook by Mohsen Mozafari Nejad
### Multi-Timeframe Analysis: 15min + 30min + 2h | July 2–3, 2025
---
## 🔍 Technical Overview:
| Timeframe | Structure | Efficiency | Context |
|-----------|-----------|------------|---------|
| 15min | Bullish ✅ | Efficient ✅ | Reverse H&S complete – price entering neckline zone |
| 30min | Bullish ✅ | Inefficient ❌ | Clean BOS – ready for potential continuation |
| 2H | Bullish ✅ | Inefficient ❌ | HL confirmed – clear bullish delivery range ahead |
---
## 🧠 Key Insights:
- **Left Shoulder - Head - Right Shoulder** clearly visible and now validated with neckline break
- Price is reacting from **last TLQ + ILQ zones** with MSU
- Strong **liquidity gap** above 3,380–3,405 likely to be targeted
- **Highs around 3,420–3,440** may act as liquidity magnet if clean break happens
- **BOS and CHoCH** confirmed across all LTFs — strong bullish intent
- Structure remains **bullish** as long as 3,312–3,320 HL holds
---
## 🎯 Price Zones to Watch:
| Zone | Action |
|--------------|----------------|
| 3,335–3,340 | OB Flip Support / Demand (Retest Possible) |
| 3,368–3,375 | Reaction Zone / Short-Term Take Profit |
| 3,404–3,420 | Major Liquidity Above / SH Grab |
| 3,428–3,440+ | Stop-Hunt Potential for Final Exit |
---
## 📌 Trade Scenarios:
### 🟢 Long Setup
- **Entry:** 3,340–3,348 (OB retest or continuation)
- **SL:** below 3,328
- **TP1:** 3,375
- **TP2:** 3,400
- **TP3:** 3,420+
### 🔴 Caution for Short
Only valid if price shows **CHoCH + strong rejection** from above 3,420–3,440.
Otherwise, trend continuation is dominant.
---
## 🧭 Summary:
> Gold continues its bullish structure in all LTFs.
> Reverse H&S has broken neckline cleanly.
> Momentum + inefficiency zones above = clear drive to liquidity.
> Patience is key – reentry on OB retest = high R/R setup.
---
🖋️ Prepared by: **Mohsen Mozafari Nejad**
*Smart Money | Liquidity Zones | Order Blocks | MSU/MSD Framework*