XAU/USD Bullish Reversal from Key SupportXAU/USD Bullish Reversal from Key Support 📈🟢
📊 Chart Analysis:
Rounded Bottom Structure ⬆️
The price has formed a rounded bottom pattern, indicating potential trend reversal from bearish to bullish.
Multiple bounces (🟠 circles) from the curved support trendline confirm the validity of this structure.
Support Zone Rejection ✅
Price recently rejected from a major horizontal support zone (around 3,303.796 USD) with a strong bullish wick.
This zone has acted as a springboard for prior upward moves.
Falling Wedge Breakout 💥
A falling wedge (bullish pattern) has formed and is breaking to the upside.
Breakout confirmation is underway, indicating momentum shift.
Target Projection 🎯
The projected move from the breakout suggests a potential target at 3,385.820 USD.
This aligns with previous resistance areas.
Key Levels to Watch:
Resistance: 3,385.820 USD (target) and 3,425–3,450 USD (major resistance zone)
Support: 3,303.796 USD (short-term), followed by 3,225–3,250 USD zone
🔔 Conclusion:
Price action suggests a bullish bias with a possible upward continuation if it sustains above the wedge breakout.
Confirmation above 3,330 USD with volume can fuel a rally toward the 3,385–3,400 USD target zone.
📌 Risk Management Tip: Watch for fakeouts near wedge resistance or a re-test of 3,303 USD for better entries.
Xauusdsetup

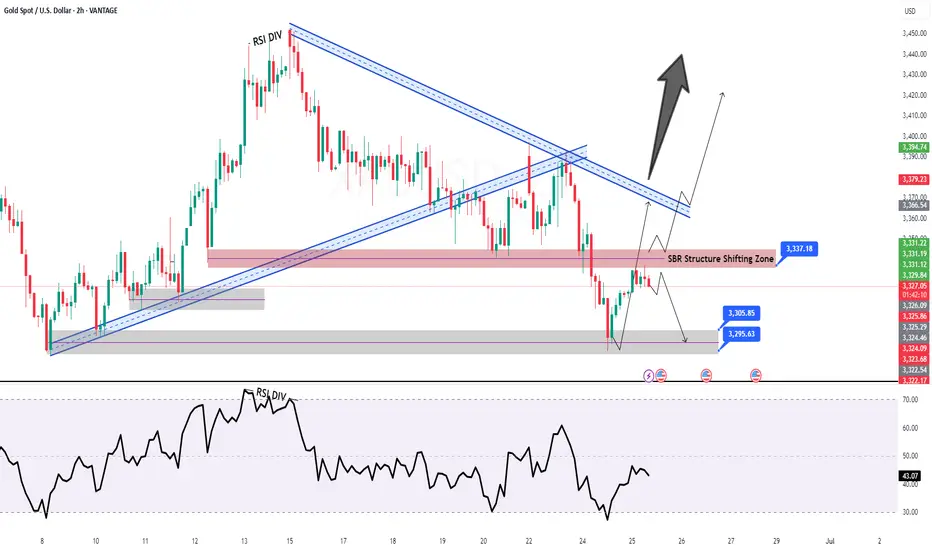
GOLD H2 Intraday Chart Update For 25 June 25 Hello Traders, as you can see that market just try to broke 3300 psychological level yesterday but unfortunately that was not successful attempt
All eyes on 3337-3348 zone for the day if market successfully breaks that zone it will move towards 3365 Blind Structure Level else we might see 3305 level test soon on Intraday basis
Reminder: This is also FED Chair Powell 2nd of Testifies
Disclaimer: Forex is Risky
XAUUSDHello traders.
I’ve spotted an exceptional sell opportunity on the XAUUSD pair—one of those setups that come around once in a hundred years! The trade offers a Risk-to-Reward ratio of over 1:8, so I thought it would be valuable to share it with you.
Please adjust your risk parameters accordingly before entering the trade.
🔍 Trade Details
✔️ Timeframe: H1
✔️ Risk-to-Reward Ratio: 1:8.70
✔️ Trade Direction: Sell
✔️ Entry Price: 3333.35
✔️ Take Profit: 3317.75
✔️ Stop Loss: 3335.13
🕒 If momentum fades or the price consolidates in a tight range, I will keep this trade open only until 23:00 (UTC+4). After that, I’ll close it manually—whether in profit or loss—depending on how price action evolves.
🔔 Disclaimer: This is not financial advice. I’m simply sharing a trade I’ve taken based on my personal trading system, strictly for educational and illustrative purposes.
📌 Interested in a systematic, data-driven trading approach?
💡 Follow the page and turn on notifications to stay updated on future trade setups and advanced market insights.
Gold Spot / U.S. Dollar (XAUUSD) 4-Hour Chart - OANDA4-hour candlestick chart from OANDA displays the price movement of Gold Spot (XAUUSD) from late June to early July 2025. The current price is $3,332.245, reflecting a +0.26% increase (+$8.795) as of 07:39 AM CEST on June 25, 2025. The chart highlights a recent price range between $3,320.076 and $3,365.226, with a notable support level around $3,329.934 and resistance near $3,355.226. The chart includes a shaded area indicating a consolidation or trading range.

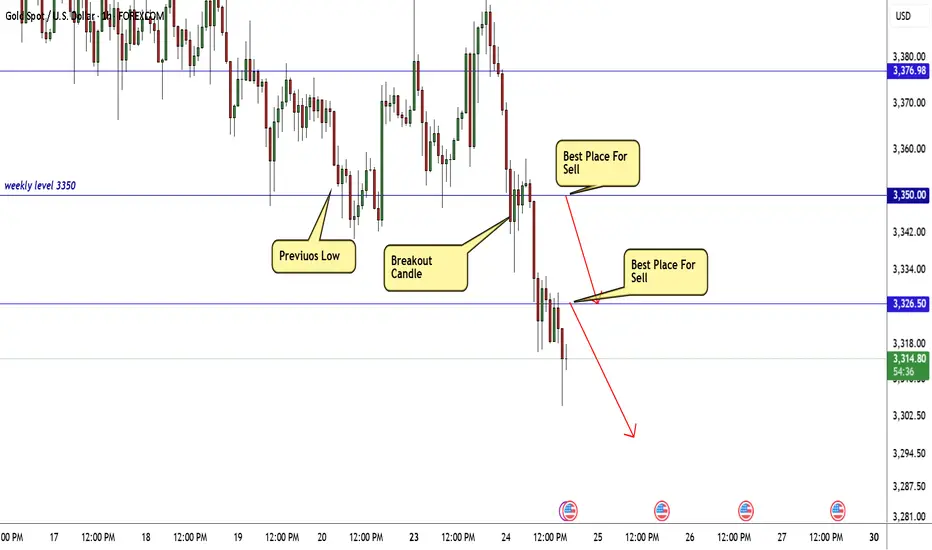
GOLD 2 Best Places For Sell Very Clear , Don`t Miss 300 Pips !Here is my opinion on Gold at the moment after the price moved very hard to downside as i mentioned in the last update , now we have a very good 2 places to sell it again , the first one @ 3326.00 , it`s a very good place to sell it cuz it was a very good support and the price break it and now it will play as a good res so we can sell from it , and if the price go higher we can sell from area between 3350 : 3345.00 , it will be a great place to sell it also , and if the highest place who force the price to downside we can add another sell entry from 3326.00 if we have a daily closure below it .
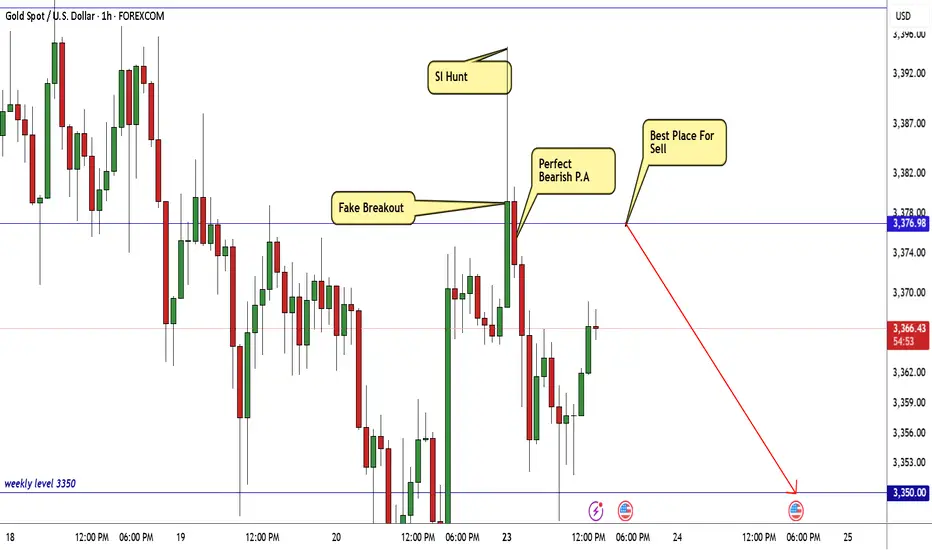
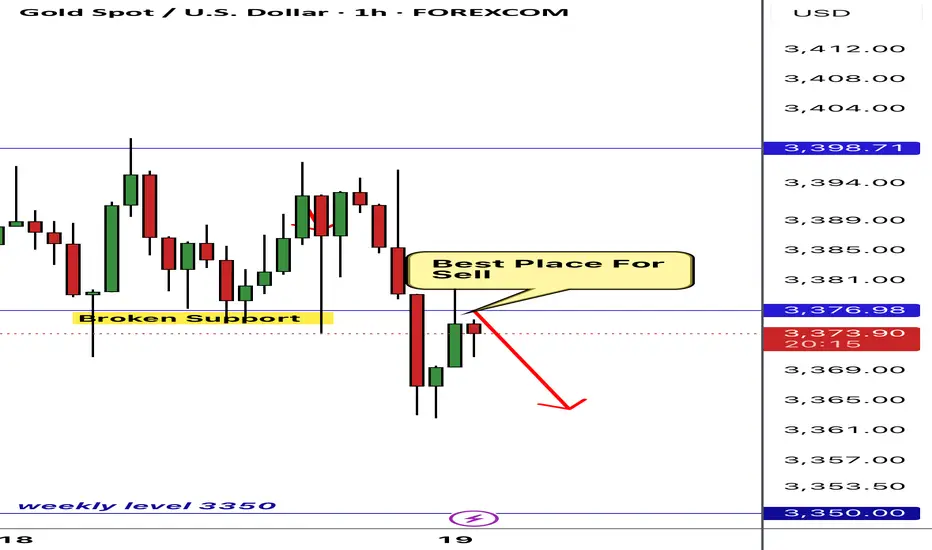
Gold Take All Stop losses,Are You Ready To Sell To Get 300 Pips?Here is my 1H Gold Chart and this is my opinion , the price opened this week with massive wick to upside to take all stop losses and then moved to downside very hard and aggressive , we have a very good Res that we sell from it last week 3377.00 , it`s still strong and forced the price many times to respect it so it still my fav level to sell it again today if the price touch it and give me a good bearish price action to confirm the entry and we can targeting 300 pips at least . if we have a daily closure above my res then we will think about buying instead of selling , but until now i`m looking to sell it from the level i mentioned .
GOLD Bearish Breakout!
HI,Traders !
#GOLD is trading in a
UPtrend and Broke our of the bearish
Wedge pattern then made
A retest and is going down
Now so we are bearish
Biased and we will be
Expecting a further move down !
Comment and subscribe to help us grow !
Gold (XAU/USD) Analysis - 24 June 2025📊 4-Hour Chart: Supply & Demand Structure
1. 📐 Market Structure & Bias
Gold has bounced off the $3,340–3,350 demand area multiple times—confirming a strong support structure on the 4H timeframe .
Following this bounce, gold made a higher-low, reinforcing a bullish trend.
Overall bias remains bullish, as long as prices hold above the $3,340 region. A break below this zone may bring deeper correction.
2. 🔍 Demand Zones (Buy Areas)
Zone A – $3,340 to $3,350
Comes with trendline support and prior consolidation.
Volume and price action confirm institutional buying interest.
Zone B – $3,300 to $3,310
A more significant base zone for deeper pullbacks or additional liquidity running.
3. ⚠️ Supply Zones (Sell Areas)
Zone C – $3,380 to $3,390
Shallow zone where recent rallies have stalled—ideal for supply fade strategies.
Zone D – $3,400 to $3,410
Major resistance zone—historical retracement area with institutional selling.
🔍 1-Hour Chart: Intraday Entry Zones (Aligned with 4H Bias)
Below are premium-level intraday buy setups made for quick execution within the bullish structure:
Entry Type Zone ($) Description
1. Buy the Dip 3,340 – 3,345 Touches 4H demand + trendline — watch for bullish rejection wicks or volume pickup.
2. Quick Dip Buy 3,350 – 3,355 Opportunistic entry higher in demand zone — quicker reentries with lighter pullback.
3. Deep Bounce 3,300 – 3,310 For deeper intraday swings only—requires strong confirmation from lower timeframes.
(Optional) Sell Supply Fade 3,380 – 3,390 Aggressive fade only if strong price rejection appears—caution advised.
Tips for Entry Confirmation:
Look for bullish pin bars, engulfing candles, volume confirmation, or trendline bounces within these zones. Only trade entries with clear price action confirmation.

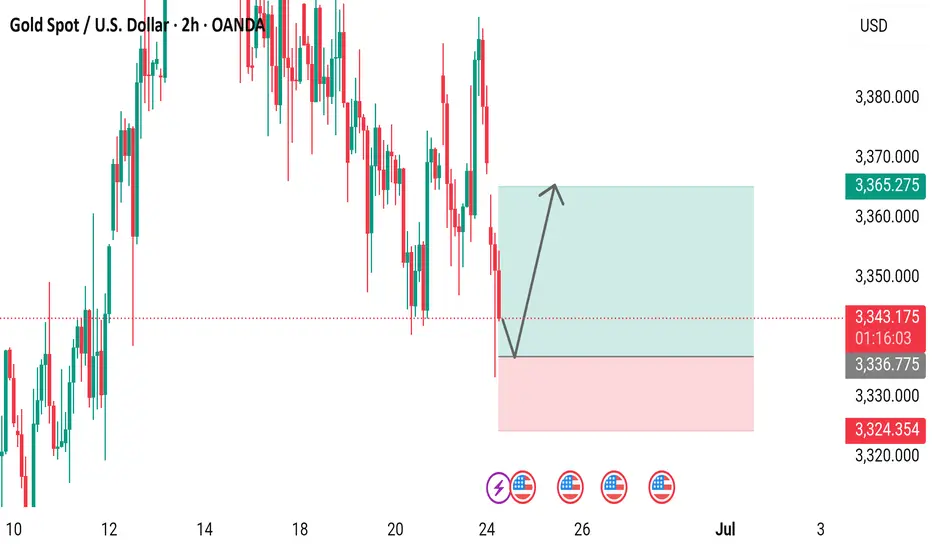
Gold Spot / U.S. Dollar (XAU/USD) 2-Hour Chart2-hour chart from OANDA shows the price movement of Gold Spot (XAU/USD) against the U.S. Dollar. The current price is $3,344.210, reflecting a decrease of $24.965 (-0.74%). The chart highlights a recent upward trend with a shaded area indicating a potential price range between $3,324.354 and $3,380.000, with key support and resistance levels marked. The timeframe spans from June 12 to July 3, 2025.
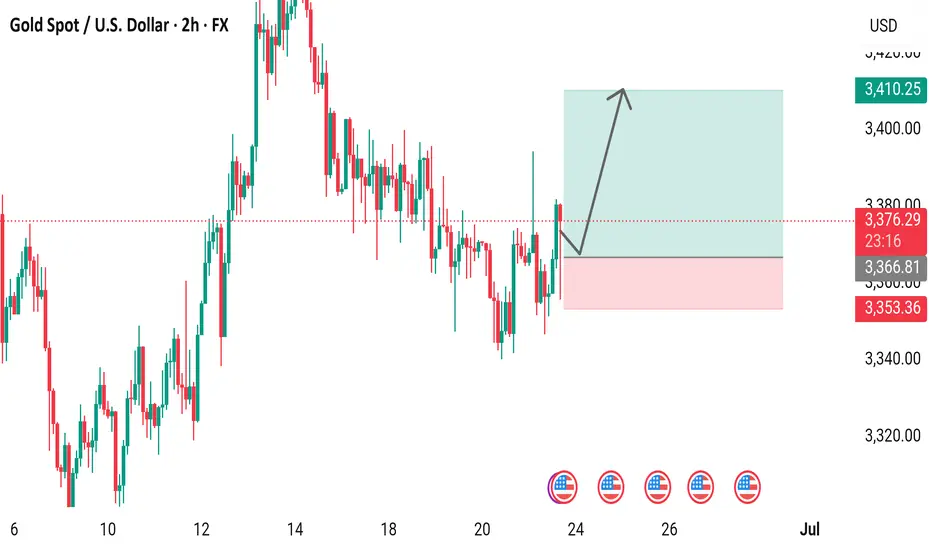
Gold Spot / U.S. Dollar (XAUUSD) 2-Hour Chart2-hour candlestick chart displays the price movement of Gold Spot (XAUUSD) against the U.S. Dollar, with the current price at 3,373.97, reflecting a +5.99 (+0.18%) change. The chart highlights recent price trends, including a notable upward movement, with key support and resistance levels marked around 3,366.81 and 3,410.25, respectively. The time frame spans from approximately 6:00 AM to 3:35 PM CEST on June 23, 2025.
Gold Spot Price Trend Analysispresents a detailed analysis of the gold spot price trend against the U.S. dollar, captured over a four-hour interval. The chart displays a fluctuating pattern, with prices ranging from approximately $3,320 to $3,383.74 USD. A notable decline is observed, marked by a red box indicating a support level at $3,332.53, while a green box suggests a resistance level at $3,383.74. The current price stands at $3,353.94, with a slight decrease of 0.42%. The chart provides valuable insights for investors and traders seeking to understand the dynamics of the gold market.

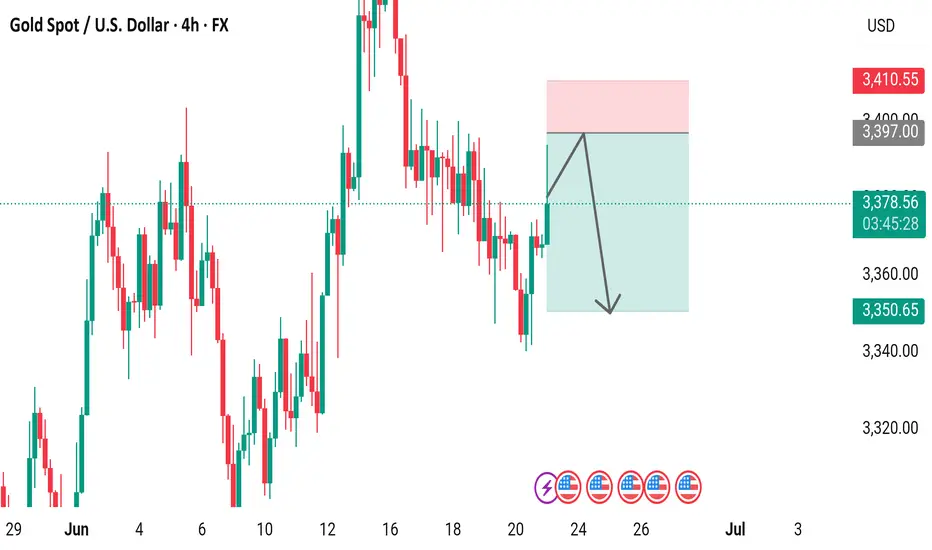
Gold Spot / U.S. Dollar (XAU/USD) 4-Hour Forex Chart4-hour forex chart displays the price movement of Gold Spot (XAU) against the U.S. Dollar (USD) from late June to early July 2025. The chart shows a recent price of 3,377.73 USD, with a slight increase of +9.76 (+0.29%). The candlestick pattern indicates a downward trend following a peak, with a highlighted resistance zone around 3,400 USD. The chart includes a 4-hour timeframe and key price levels ranging from 3,330.00 to 3,400.00 USD.
6/23 Gold Analysis and Trading ViewsGood morning, everyone!
Over the weekend, former President Trump announced and carried out an attack on Iran's nuclear facilities, triggering a renewed wave of risk-off sentiment in the markets. At today’s open, gold surged to around 3394. Driven by geopolitical tensions, the bearish technical structure has temporarily been disrupted.
Whether the bullish momentum can sustain will depend on how the situation continues to unfold.
Key technical levels to watch today:
Resistance: 3389 / 3407 / 3423 / 3432
Support: 3372 / 3365 / 3356 / 3348
Trading strategy: Given the current news-driven market, a buy-on-dip approach is preferred, with short positions as a secondary option depending on price reaction near resistance zones.
Also, pay close attention to today’s daily close (1D chart). If the price closes below 3355, it could signal profit-taking from the bulls, potentially pulling gold back into a bearish technical trend.
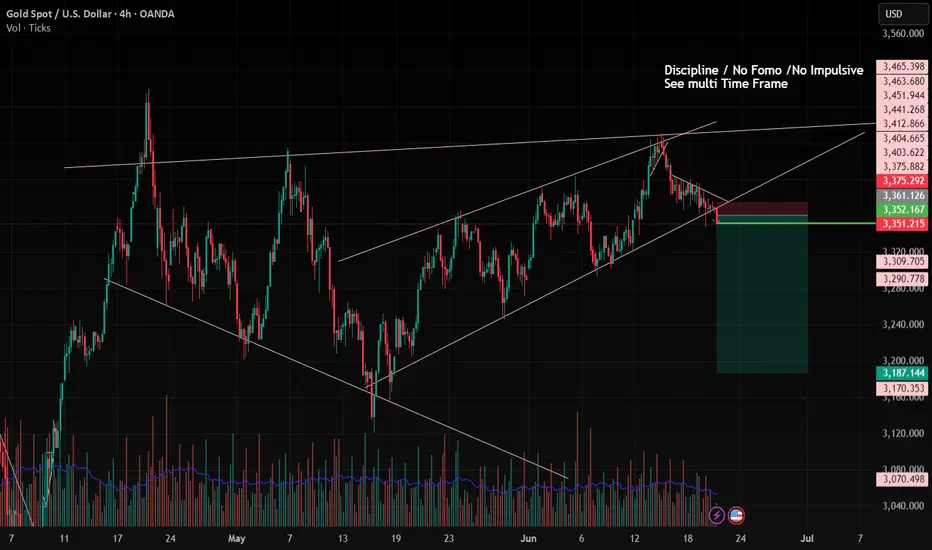
Gold Trade Setup - 22/Jun/2025Hi Traders,
I expect this pair to go Up after finishing the correction.
1) We are in uptrend and potentially correcting for further upside.
2) The current move can be just a part of a intermediate correction or can even go to break the top.
How to Enter : Look for engulfing with in the SL zone.

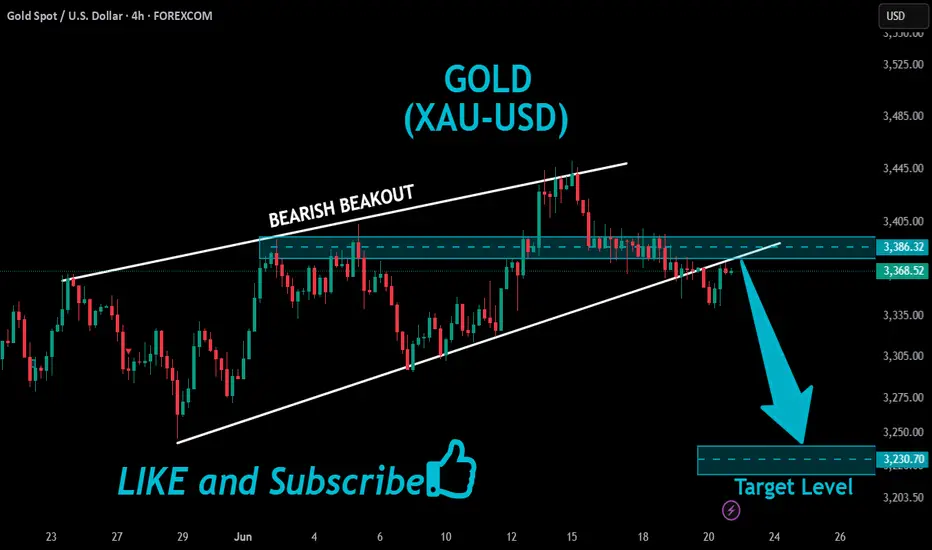
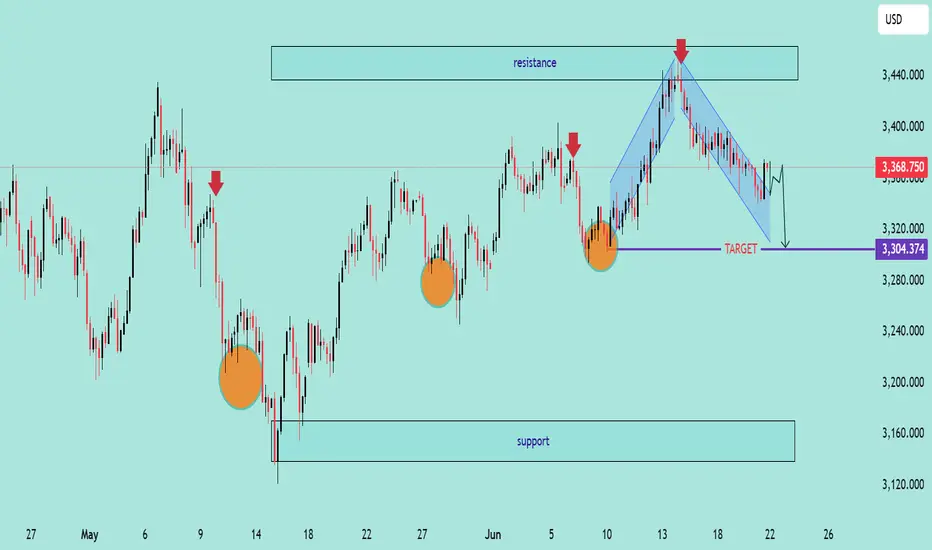
XAU/USD Bearish Pattern Analysis XAU/USD Bearish Pattern Analysis 📉
The chart presents a potential bearish continuation setup in the XAU/USD pair, highlighted by technical structures and key price levels:
📊 Technical Breakdown:
🔸 Bearish Rejection from Resistance
Price rejected strongly from the 3,440.000 resistance zone, marked with a red arrow.
This area has acted as a historical supply zone, triggering repeated reversals.
🔸 Descending Channel Formation 📉
A clear bearish flag/channel structure is visible post-rejection.
Price action broke down from the channel, signaling potential trend continuation.
🔸 Target Level 🎯
The expected target is around 3,304.374, aligning with previous support zones and structure lows.
This level coincides with a measured move from the channel breakdown.
🔸 Higher Lows Pattern Before Reversal ⭕
Prior to the current decline, the market formed a series of higher lows, highlighted with orange circles — suggesting a buildup before reversal.
🧭 Key Levels to Watch:
Resistance: 3,440.000 – 3,420.000 🔼
Current Price: 3,368.750
Short-Term Target: 3,304.374 🎯
Major Support: 3,140.000 – 3,160.000 🛡️
📌 Outlook:
The rejection from resistance coupled with the descending channel breakdown indicates bearish momentum. If the market maintains below the recent high, further downside towards 3,304 is expected. Break below this may expose deeper support zones.
📉 Bias: Bearish
⏳ Short-term Action: Watch for breakdown confirmation and momentum continuation.
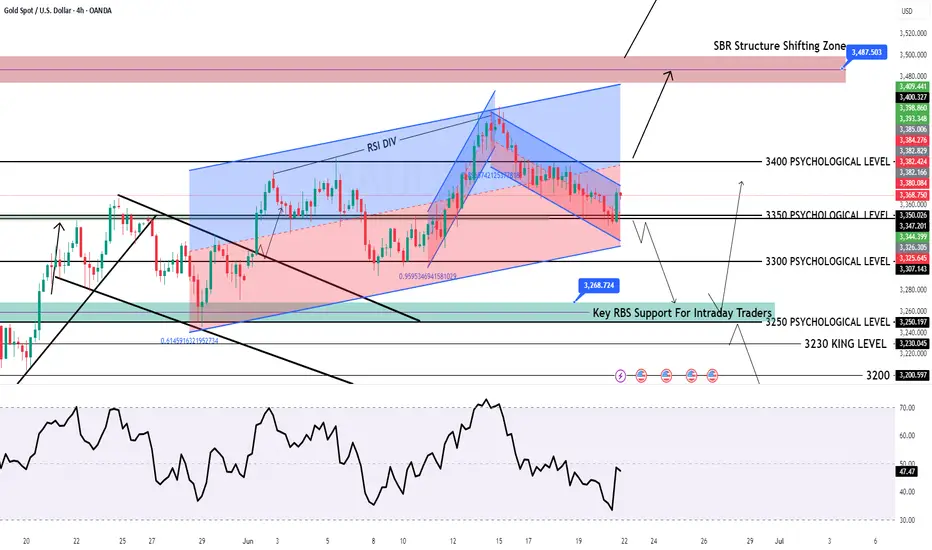
GOLD H4 Chart Weekly Update For 23 - 27 June 25Hello Traders,
welcome to the weekly update, as you can see that market was in range last week
as for now 3400 Psychological remains in focus if market breaks 3400 successfully the GOLD will rise towards 3440
only breaks below 3330 GOLD will leads towards 3250 possibly
FED Chair Powell Testifies due in the upcoming week
USPCE PRICE INDEX due on Friday
Disclaimer: Forex is Risky
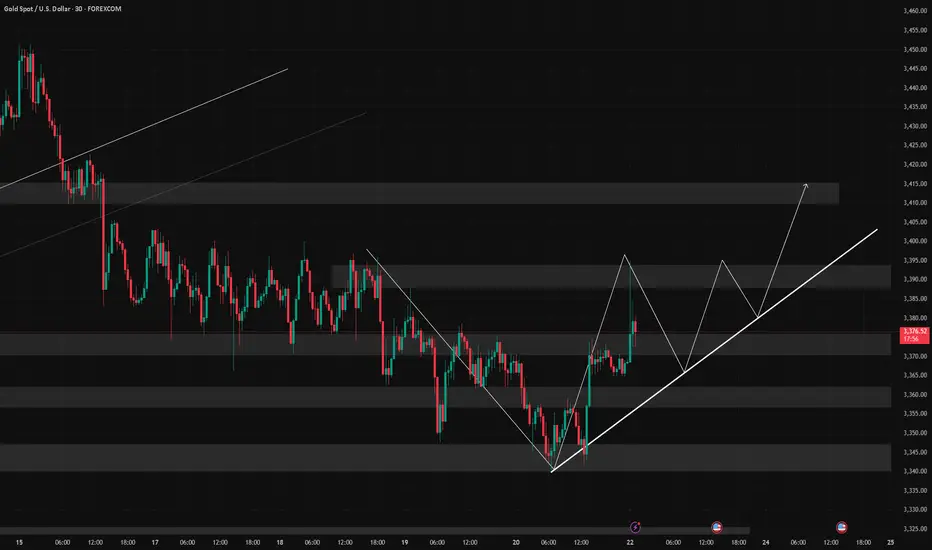
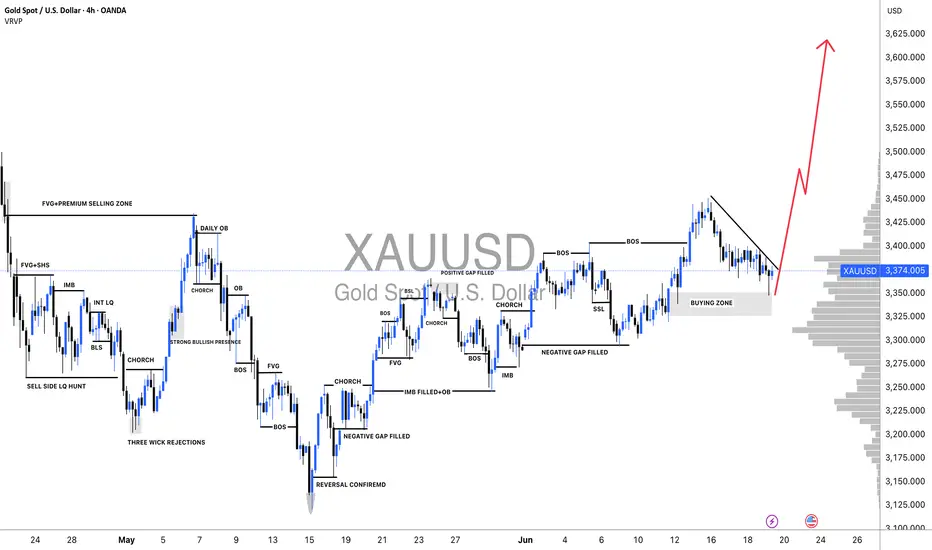
XAUUSD: Is Bullish Trend Ended? Or It is just beginning big moveAs we previously stated that price can reverse between 3340 to 3350 region, which was a pivotal point for bulls. Price smoothly moved currently trading at 3376 and possibly bullish move continuing towards 3400,3450 and ultimately reaching 3600.
Following the price’s all-time high at $3500, it experienced a sharp decline and failed to maintain that level. A substantial 2400 pips would have resulted in significant losses for many accounts. Initially, it was perceived as a minor correction, with the expectation of further price appreciation. However, this assumption proved incorrect. After reaching an even higher peak, the price invariably undergoes a more substantial correction.
At 3260, substantial bullish volume surged into the market, necessitated by the presence of a fair value gap. Subsequently, the price experienced a decline, reflecting the prevailing bearish trend, which favoured the bears. However, at 3200, a pivotal level representing a discounted price point, bull volume surged. This powerful bullish impulse propelled the price to 3432, ultimately confirming the bullish trend. AB=CD there recurring pattern emerged weekly. When the price reached the 3432 level as a fair value gap, the CD pattern commenced.
AB=CD we have identified a recurring pattern. It appears to be an equal move in any direction, and it has manifested precisely as anticipated. We were aware that the price would reject at 3120, and it did so accordingly. Currently, the market is in our favour. Upon market opening, it exhibited a positive gap, propelling the price to 3450. However, it subsequently declined, reaching 3384.
Presently, we find ourselves in the accumulation phase, poised for distribution. This distribution is anticipated to be substantial, potentially leading to another record high, potentially reaching 3650.
Moving forward, the price could continue towards our target from its current position. Alternatively, there exists a possibility that it may drain the sell-side liquidity and reverse from 3360-3370.
Our take-profit levels are set at 3450, 3490, 3520, and finally, 3600. When entering the market, it is advisable to employ a short time frame. It is important to note that this analysis is merely our opinion, and market conditions may deviate from expectations.
We extend our best wishes for success and safe trading. If you wish to demonstrate your support, you may consider liking, commenting, or sharing this analysis with others.
Sincerely,
Team Setupsfx_
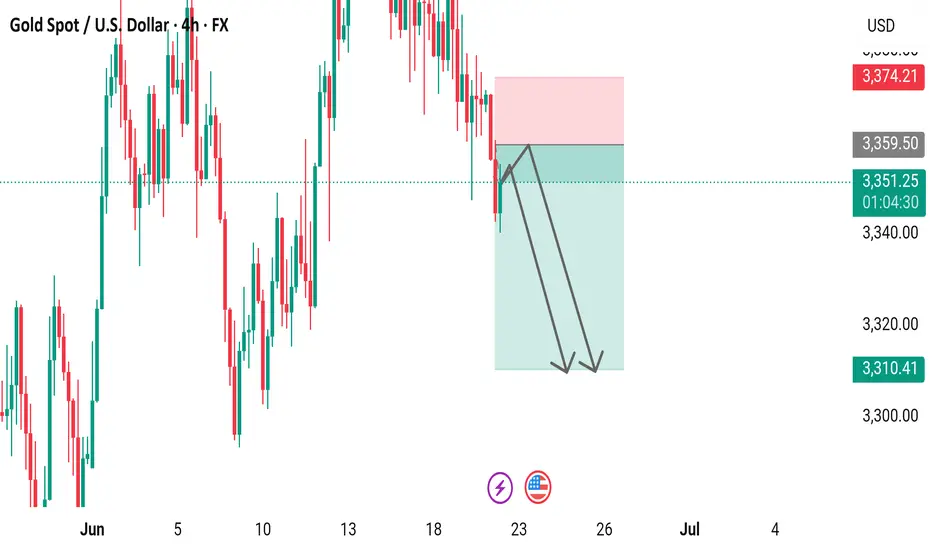
Gold Spot / U.S. Dollar (XAU/USD) 4-Hour Chart4-hour chart displays the price movement of Gold Spot against the U.S. Dollar (XAU/USD) from early June to mid-June 2025. The price, currently at $3,350.76, has experienced a recent decline of $19.76 (-0.59%) as of 01:06:10. The chart highlights a downward trend with a shaded area indicating a potential support or resistance zone between $3,310.41 and $3,374.21. Key price levels are marked, showing fluctuations between $3,300.00 and $3,374.21 over the observed period.
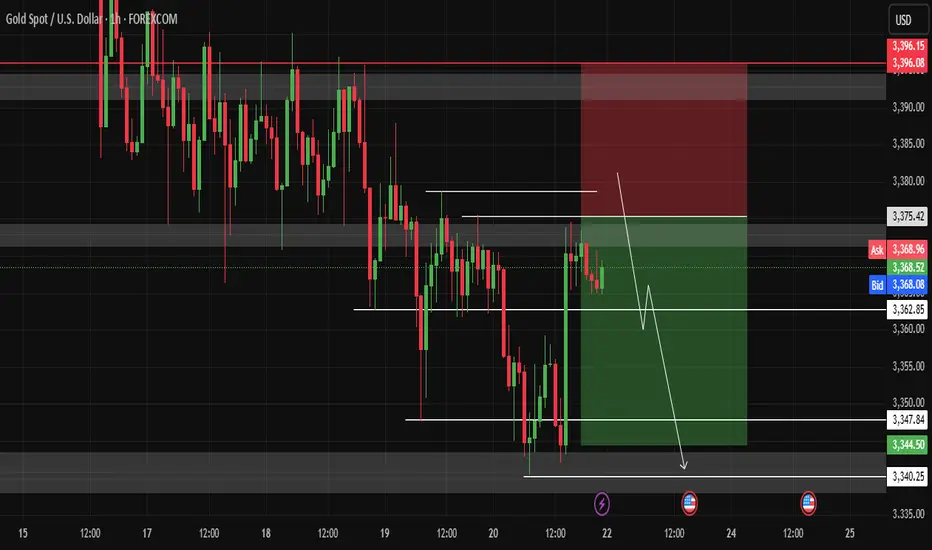
Gold Broke Out – Another Drop Loading?OANDA:XAUUSD TVC:GOLD Gold is attempting a rebound but faces strong resistance near $3,364–$3,368, where previous support converges with the descending trendline (TL1). A clear rejection here could resume the bearish momentum.
Technically, the price is hovering just below the TL1 resistance. The zone around $3,368 is critical — if bulls fail to reclaim this area, we could see a move back toward the $3,326 support, with a deeper target near weekly support at $3,310.
📉 A rejection around current levels = high probability drop
📈 Break and hold above TL1 = potential short-term reversal
🧠 Macro Check:
Despite intensifying Middle East tensions (Israel-Iran conflict escalating, Trump weighing intervention), gold remains under pressure. The Fed’s hawkish hold, persistent inflation, and a strong dollar continue to weigh on bullion in the near term.
🔍 Key Levels:
Resistance: $3,364–$3,368 (structure + TL1)
Support: $3,326 / $3,310
Bias: Bearish below $3,368
Setup Idea: Watch for rejection near resistance for short setups toward $3,326 and $3,310

XAUUSD , 1D , Short Pattern is breaking Down , it is looking very good
Risk According to your Capital .
GOLD Finally Breakout , Short Setup Valid To Get 200 Pips !Here is my opinion , after this amazing 4H / Daily Breakout , we should sell Gold From Area Between 3377.00 / 3375.00 And Targeting 250 Pips At Least .
XAU/USD 2-Hour Chart Analysis: Bullish Breakout in Progress2-hour candlestick chart of the Gold Spot/U.S. Dollar (XAU/USD) currency pair, displayed on TradingView, a popular trading platform. The chart tracks price movements over a period from the 4th to the 26th, with each candlestick representing a 2-hour interval. The price levels, shown on the y-axis, range from 3,320.00 to 3,398.54 USD, while the x-axis marks the corresponding dates. The current price is 3,370.55 USD, up by 1.61 points (+0.05%), highlighted in green to indicate a positive change. Green candlesticks represent bullish (upward) price movements, while red ones indicate bearish (downward) trends, offering a clear view of market dynamics.
